For two decades, network planning has rested on a single assumption: traffic volumes grow, but traffic structure remains stable. Demand was downstream-heavy, dominated by cacheable content, delivered in short flows, and predictable enough to be dimensioned with busy-hour engineering and historical CAGR curves. Every access technology, every peering policy and every capacity plan currently in production encodes that structure. AI does not merely add volume on top of it — it introduces a traffic class with fundamentally different structural properties.
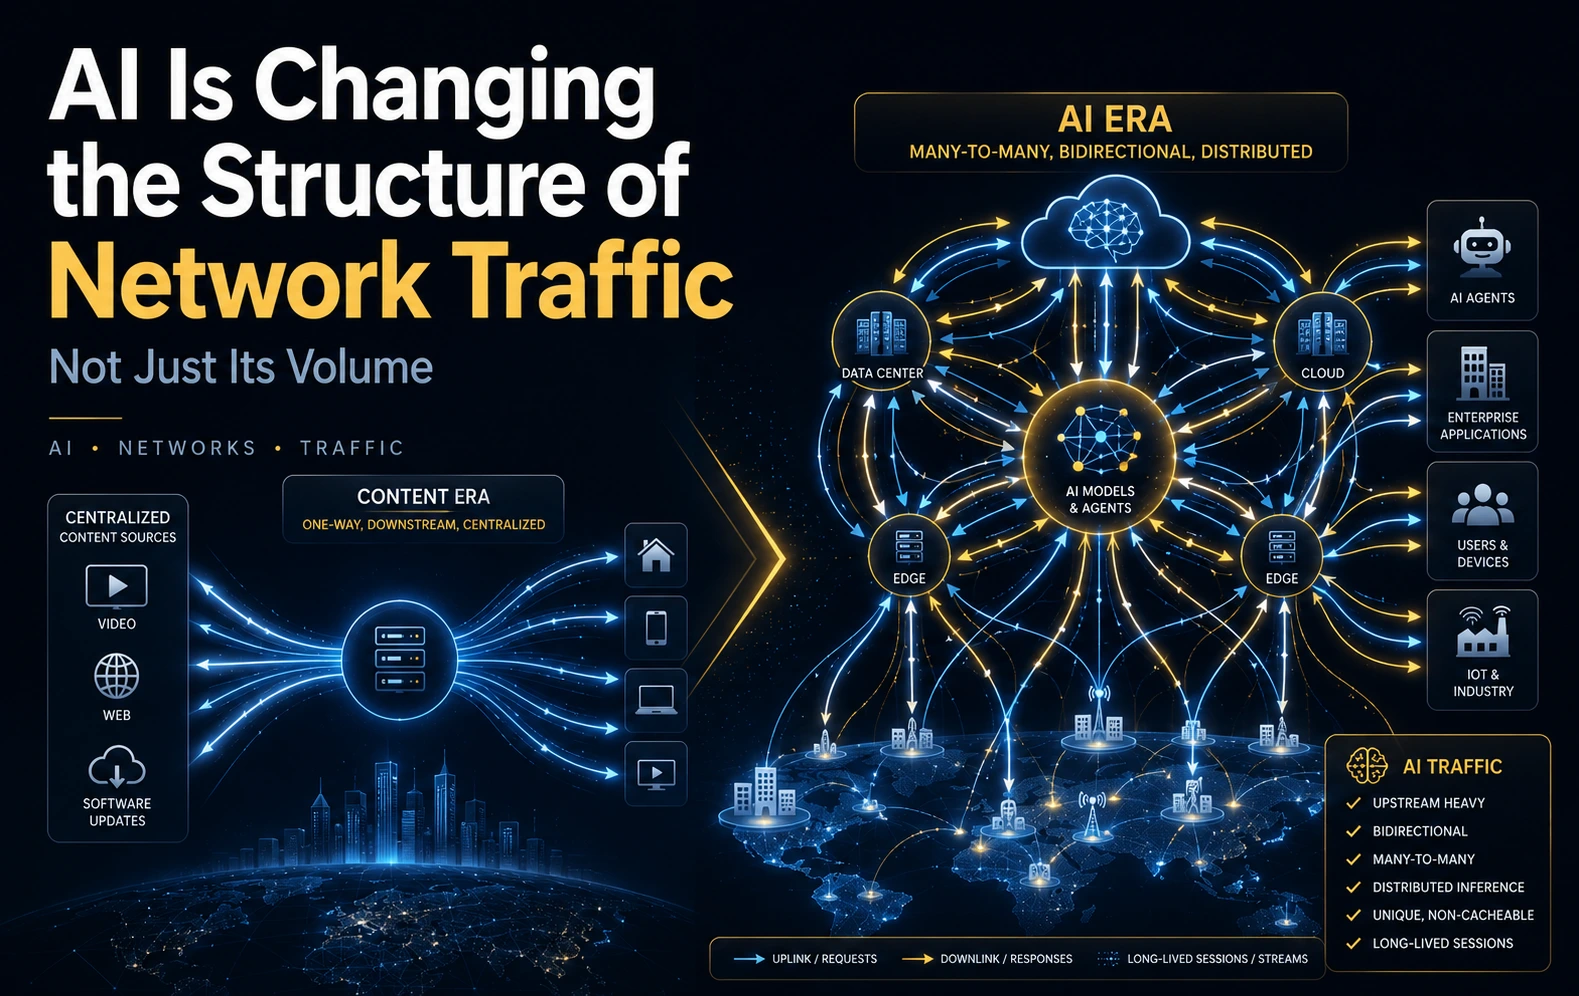
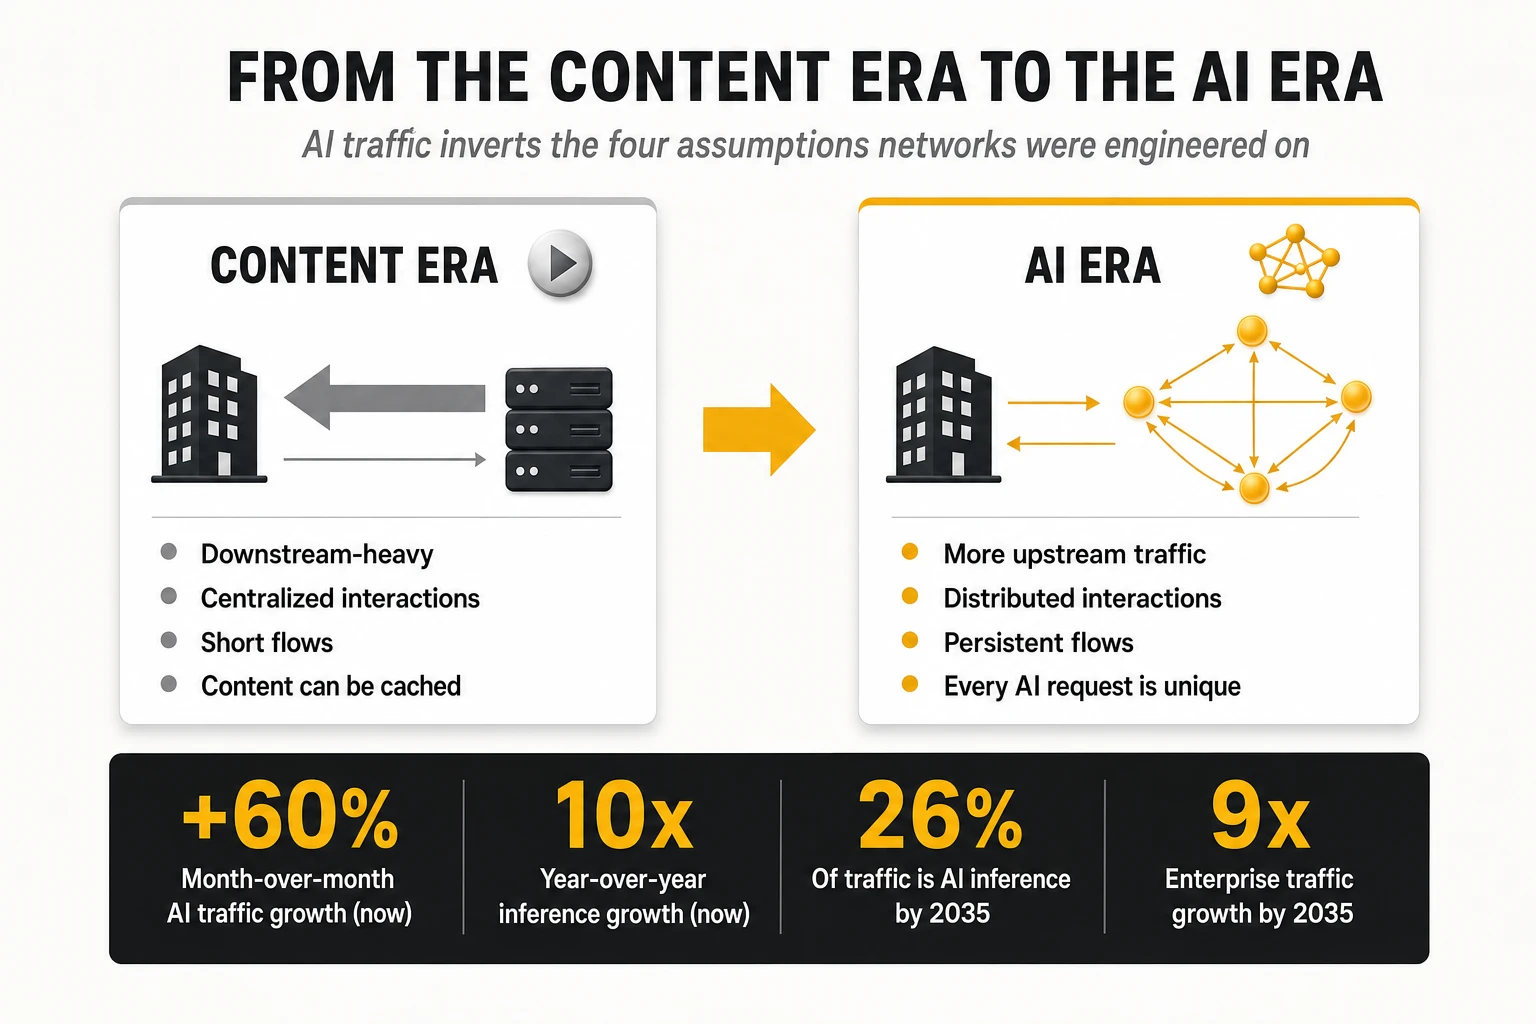
AI inference — the live, production use of AI models by users, applications and autonomous agents — differs from content traffic in four measurable dimensions:
- Direction: symmetric or upstream-heavy, where access plant and spectrum plans are engineered asymmetric.
- Uniqueness: every request is distinct, where the installed base assumes repetition and CDN offload.
- Duration: long-lived, stateful sessions, where traffic engineering expects short, completing flows.
- Multiplication: a single human request can trigger dozens of machine-to-machine transactions before a response is delivered.
The magnitude of the shift is documented, not speculative. Nokia Bell Labs forecasts overall network traffic growing 5 to 9 times by 2033, with AI traffic compounding at a 23–24% CAGR to roughly 1,088 exabytes per month by 2033 — around 30% of global WAN traffic by 2034 (Nokia Global Network Traffic report). Ericsson’s June 2026 Mobility Report measures uplink already growing faster than downlink at 43 of 55 service providers, with AI scenarios pointing to uplink volumes three times higher by 2031 (Ericsson Mobility Report, 2026). Industry projections presented through 2025 and 2026 go further: AI inference traffic growing 10x year over year on certain routes today, month-over-month traffic and flow increases of 60% where inference clusters interconnect, and — by 2035 — AI inference representing roughly 26% of total traffic while enterprise network traffic grows up to 9x.
There is a relevant precedent. In the content era, operators financed transport and access capacity while CDNs, hyperscalers and OTT platforms captured the service value. Whether the AI cycle repeats that allocation of value is the central strategic question for operators — and the answer depends on decisions taken within the next few years, not the next decade.
The thesis of this analysis: AI does not simply add traffic to the network. It invalidates the four assumptions the network was engineered on — direction, location, duration and cacheability. Operators that respond with capacity alone will repeat the content-era outcome. Operators that respond with placement, assurance and autonomy hold a genuine monetization position.
1. From the Content Era to the AI Era: four assumptions, all inverted
Every WAN in production today was dimensioned for the content era. A relatively small number of large content sources — video platforms, application stores, software distribution — pushed enormous volumes downstream toward millions of subscribers. Video alone represented roughly 65% of total internet traffic in 2022 (Sandvine Global Internet Phenomena Report, 2023), and the large majority of that volume was served from on-net caches and CDN interconnects rather than carried across the backbone. The industry’s engineering response was rational, and it hardened into four planning assumptions:
- Asymmetry: access plant provisioned downstream-heavy — legacy DOCSIS and copper deployments with downstream-to-upstream ratios typically between 5:1 and 10:1, and TDD mid-band 5G frame patterns commonly allocating around three quarters of slots to downlink.
- Centralization: a small set of content origins behind CDN and peering interconnects, making the traffic matrix stable and eyeball-to-content by construction.
- Short flows: transactions that complete in seconds, allowing buffers, load balancers, charging systems and security appliances to be tuned for flow completion.
- Cacheability: identical objects served millions of times from the network edge, decoupling delivered volume from backbone investment.
AI inference invalidates all four simultaneously. The subsections below take them one by one.
Direction: from downstream-heavy to symmetric
Content flows down; intelligence flows in both directions. A prompt with an attached document, image or video clip is uplink traffic. Sensor and telemetry data feeding real-time models is uplink traffic. Enterprise datasets moving toward inference endpoints — for retrieval, fine-tuning or context injection — are uplink traffic. The UL/DL ratio of AI workloads trends toward symmetry, and in machine-vision and industrial IoT scenarios inverts outright.
This inversion is measured, not projected. Ericsson’s 2026 measurements across 55 service providers found uplink growing faster than downlink at 43 of them, and more than 1.5x faster at 17; its scenario modeling puts uplink volumes at 3x 2025 levels by 2031 (Ericsson, 2026). Decades of asymmetric access engineering — DOCSIS upstream/downstream splits, TDD frame configurations, GPON dimensioning — now sit on the wrong side of the demand curve, and rebalancing them requires spectrum refarming, mid-band uplink carrier aggregation and FDD massive MIMO, none of which are software upgrades.
Location: from centralized to distributed
The content era had a few large origins; the AI era has many interacting endpoints. Inference executes in hyperscale regions, national data centers, metro edge facilities, enterprise premises and increasingly on devices — and these locations exchange traffic among themselves. A single AI application can chain a small on-premises model, a retrieval-augmented generation (RAG) system at a regional edge site, and a frontier model in a hyperscale region within one user transaction.
The planning consequence: the traffic matrix becomes any-to-any. The eyeball-to-content model is replaced by dense east-west flows between compute locations — data center interconnect (DCI), inter-edge and edge-to-core — that never appeared in consumer-era demand matrices and are poorly captured by NetFlow-based planning built around a handful of dominant ASes.
Duration: from short flows to persistent sessions
A video segment download completes in seconds; an AI session persists. Conversational assistants hold streaming connections open for minutes or hours. Agentic workflows maintain long-lived, stateful sessions against multiple backends. Real-time multimodal applications transmit continuously in both directions. Network functions tuned for flow completion — buffer dimensioning, load balancing, charging and policy enforcement, stateful firewalls and CGNAT — now face a traffic class built on persistent connections, with session tables and state-holding costs to match.
Cacheability: from replicable content to unique requests
This is the assumption whose loss carries the largest economic impact. The content internet scaled because identical objects could be served millions of times from caches within 10 milliseconds of the subscriber. Every AI request is unique: same question, different context window, different tokens, different answer. There is no object to cache. Every transaction must traverse the network to live compute, every time.
The CDN was the shock absorber of the content era — the mechanism that allowed delivered traffic to grow two orders of magnitude while backbone investment grew far less. No equivalent offload mechanism exists for inference. Whatever inference volume materializes, the network carries all of it end to end — which is precisely why the Nokia Bell Labs scenarios translate into materially higher WAN growth than the content decade produced.
2. The growth curve: what the numbers actually say
Traffic forecasts carry a credibility deficit in this industry. Planning departments have been misled by inflated projections before — video telephony in 3G, the “tactile internet” in early 5G. The appropriate discipline is to separate measured data from projections, and to label each accordingly.
What is measured today
- Uplink is outgrowing downlink at 43 of 55 measured service providers, in a market that passed 3 billion 5G subscriptions in Q1 2026 (Ericsson, 2026).
- Inference interconnection traffic is growing at rates without recent precedent. Industry figures presented across 2025–2026 point to 60% month-over-month traffic and flow increases on AI-related routes, and AI inference traffic growing approximately 10x year over year — from an admittedly small base.
- DCI demand is visibly tightening capacity on key metro and subsea segments, with lit-capacity utilization and wavelength pricing under pressure on AI-exposed routes.
- Baseline demand keeps compounding underneath the AI layer. Global mobile data traffic continues to grow at roughly 20% per year (Ericsson, 2026), and international bandwidth demand has compounded at approximately 30% annually over the past decade (TeleGeography). AI traffic stacks on top of that base, not instead of it.
Where growth concentrates first
AI traffic does not arrive uniformly across network domains — it concentrates. The earliest pressure points are DCI and the peering and transit edge: inference clusters exchanging traffic with data sources, retrieval systems and each other across metro fiber, internet exchanges (IXPs) and subsea systems. Access networks register the shift later and more gradually.
That sequencing matters for capacity planning. An operator can hold years of headroom in access while its metro rings and peering edge approach saturation. The content era trained planners to monitor the consumer access curve; the AI era begins in the interconnection fabric. The leading indicators to instrument are metro fiber utilization, IXP port growth, subsea route diversity and DCI order intake — the first places where under-investment converts into lost AI revenue rather than slower downloads.
What is projected for 2030–2035
- Overall traffic: 5–9x growth by 2033 depending on scenario (Nokia Bell Labs) — reported in industry coverage as a WAN traffic increase of up to 700% by 2034 (RCR Wireless, 2026).
- AI traffic volume: a 23–24% CAGR through 2033, reaching roughly 1,088 exabytes per month and around 30% of global WAN traffic by 2034 (Nokia Bell Labs).
- AI inference share: industry projections presented in 2026 put inference at approximately 26% of total traffic by 2035, with enterprise network traffic growing up to 9x over the same horizon — notable because enterprise was the slowest-growing segment of the content era.
- Compute side: McKinsey projects AI inference growing from 20.9 GW to 93.3 GW of data center power demand between 2025 and 2030 — a 35% CAGR that takes inference beyond 40% of total data center demand and past every other workload class (McKinsey, 2025).
Where skepticism is justified
The absolute volumes deserve scrutiny. Analysts have publicly questioned the more aggressive WAN growth assumptions (Network World, 2026), with reason: inference prices for constant model quality have been falling on the order of 10x per year — a decline exceeding 1,000x over three years for equivalent benchmark performance (a16z, 2024) — smaller models keep absorbing use cases, and on-device execution will retain part of the demand. No planning team can credibly commit today to a specific traffic multiple.
The structural change, however, is more robust than any volume forecast. Even in the most conservative scenario, the traffic that arrives is symmetric, distributed, persistent and non-cacheable. A network can absorb 3x growth of the legacy structure through routine capacity augments. It cannot absorb even 2x growth of the new structure without revisiting access asymmetry, metro capacity, peering policy and assurance architecture. Dimensioning for the volume while ignoring the structure is the most probable failure mode.
3. Why inference breaks traffic engineering: bandwidth, latency, resilience
Three specific mechanisms break, and each lands on a different function within the operator: bandwidth behavior affects capacity planning, latency behavior affects service design and SLA construction, and failure behavior affects architecture and contractual liability.
Bandwidth: unique, compounding and highly variable
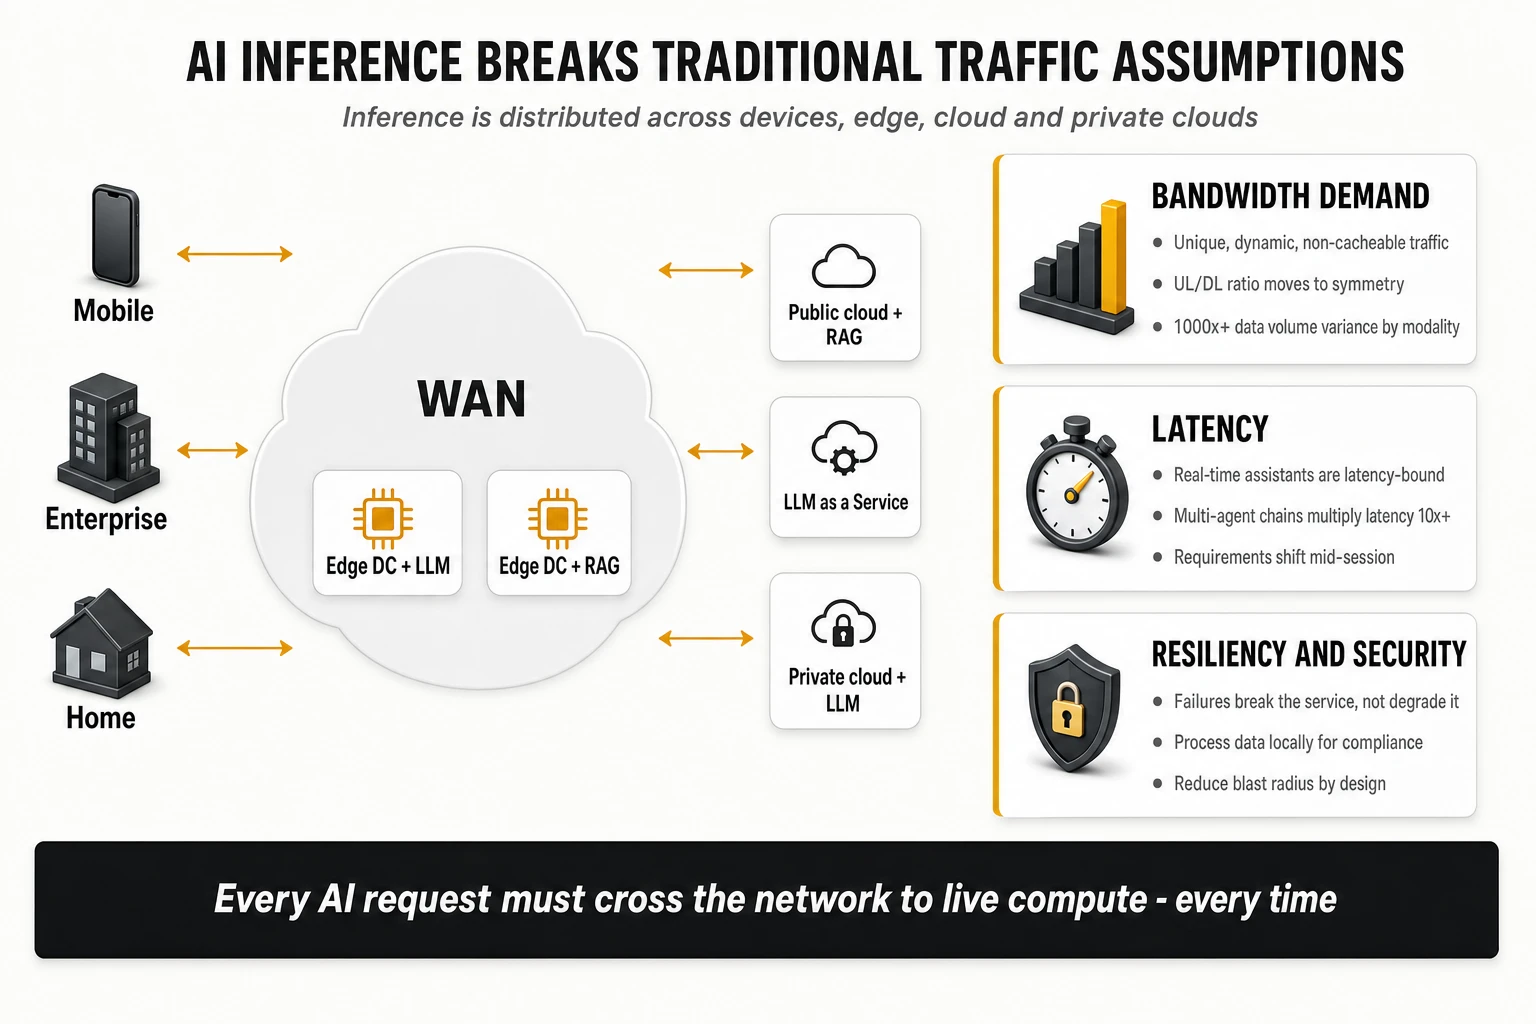
- AI traffic is unique, dynamic and non-cacheable. There is no CDN offload ratio to apply. Every byte must be transported in full.
- The UL/DL ratio converges toward symmetry. Asymmetric access plant and DL-weighted TDD spectrum plans meet a workload that uploads as much as it downloads.
- Agents compound bandwidth consumption. One user action fans out into n machine-initiated requests — each with its own round trip and payload.
- Modality drives extreme variance. Token representations vary by modality with more than 1000x differences in data volume: a text exchange is measured in kilobytes, a video-in/video-out interaction in gigabytes.
The modality variance has a direct consequence for demand modeling. Planning models assume reasonably stable payload sizes per subscriber or per application. With multimodal AI, the payload distribution is fat-tailed and non-stationary: as models improve at video and audio, users submit video and audio. A forecast calibrated on today’s text-dominated interaction mix can deviate by an order of magnitude without a single net addition to the subscriber base.
Latency: from performance metric to product feature
In AI services, network latency is a direct component of the product experience, not a background SLA parameter. Three factors drive this:
- Real-time assistants are chatty, interactive and latency-bound. Human conversational turn-taking averages roughly 200 milliseconds between speakers (Stivers et al., PNAS 2009), which is the implicit benchmark voice-driven AI is judged against. Conversational applications therefore operate against end-to-end response budgets of a few hundred milliseconds — budgets in which WAN round-trip time (RTT) consumes a material and visible share.
- Agentic workflows multiply latency. An agent executing ten processing steps before responding — tool invocation, retrieval, calls to other models — accumulates RTT at every step. Multi-agent systems push effective latency 10x or higher versus a single model call, so the network’s contribution compounds transaction by transaction.
- Latency requirements are non-deterministic per transaction. Multimodal requests and responses vary in size within a single session, so the workload oscillates between light and heavy from one exchange to the next. Static QoS classes and averaged SLAs were not designed for requirements that shift mid-session.
Resilience: failures do not degrade the service — they break it
Content-era services degrade gracefully; AI-era services fail hard. Adaptive streaming drops a quality tier and the session survives. An agent that loses connectivity to its tools mid-workflow does not produce a degraded answer — it produces no answer, or an incorrect one built on partial context. For enterprises deploying AI in revenue-critical processes, this reorders the requirements placed on connectivity. Three follow directly:
- Blast radius reduction: architect failure domains so that no single fault can interrupt the inference path — service continuity by design rather than by restoration.
- Data locality: process data close to its point of origin — for regulatory compliance, for intellectual property protection, and because reducing data movement reduces exposure in transit.
- End-to-end continuity: availability engineered across domains rather than per domain, and committed contractually — these are commercial requirements, not architectural preferences.
4. The Internet of Agents: traffic at machine speed
From human-bounded to machine-bounded load
The preceding sections assume a human at one end of each transaction; the larger structural shift removes the human entirely. The internet’s load profile has always been bounded by human behavior — users sleep, type slowly, consume one stream at a time — and every busy-hour model in the industry inherits those limits implicitly. Agents inherit none of them:
- Agents operate 24×7 — there is no busy hour and no overnight trough to smooth the load curve.
- Agents execute at machine speed — the next request is issued as soon as the previous response arrives.
- Agents parallelize: where a person issues one request and waits, an agent issues n requests concurrently — n times the RTTs, n times the bandwidth.
The adoption evidence
- Gartner projects 40% of enterprise applications will embed task-specific AI agents by end of 2026, up from under 5% in 2025 (Gartner, 2025).
- IDC forecasts a 10x increase in agent usage driving up to 1000x growth in inference demand by 2027.
- Analyst estimates size the agentic AI market at roughly $7.6 billion today, growing toward $236 billion by 2034 — a CAGR above 40%.
- Industry estimates for agent-driven traffic growth cluster around 450% — a figure to treat as directional rather than precise, but consistent in sign across sources.
The realistic ramp
Enterprise adoption still shows a measurable gap between pilots and production. Surveyed data through early 2026 places roughly 30% of organizations exploring agentic options and 38% piloting, but only around 11% operating agents in production. Agent traffic will therefore not arrive as a single wave; it will arrive as a ratchet, workflow by workflow. Each workflow that converts, however, becomes permanent, machine-speed, always-on load — and busy-hour engineering (dimension for the evening streaming peak, coast through the night) loses its meaning when the heaviest consumer on the network never idles.
The strategic consequence: the network is moving from an internet for users to an internet of agents, in which the majority of transactions have no human waiting at either end — but a human-facing business depending on them. That is a different network to plan, to secure and to sell.
5. Workload placement: why AI will be hybrid and distributed, and why that favors networks
If all inference executed in a handful of hyperscale regions, the operator role would reduce to wholesale transit and DCI toward third-party clouds. The economics and the physics of inference point the other way: AI workload placement is consolidating into a hybrid, distributed pattern stratified across four tiers.
- On-premises and device edge: small-model inference where real-time response, data confidentiality and bandwidth optimization dominate — manufacturing, healthcare, retail, automotive.
- Service provider and enterprise edge: mainstream inference and RAG, driven by data locality and compliance, latency and bandwidth performance, power and space constraints, and blast-radius reduction.
- Central and national data centers: large-scale inference and fine-tuning, where sovereignty requirements and unit economics set the placement logic.
- Hyperscale regions: frontier-scale training and the largest inference estates, where hyperscaler economics remain unmatched.
Market evidence: inference is selecting metro locations
The build-out data supports the intermediate tiers. McKinsey observes inference demand driving construction specifically in metro and near-metro sites optimized for low RTT and dense interconnection (McKinsey, 2025). Training built the giga-campuses; inference is selecting markets — and the locations it selects map onto the footprint operators already hold: central offices, aggregation sites, metro data centers, national backbones.
The placement arithmetic follows directly from the latency analysis. If time to first token is the KPI users perceive, and agentic workflows multiply round trips per transaction, then every millisecond of distance between demand and the inference endpoint is paid n times per interaction. The physics are fixed: light in silica fiber propagates at roughly 5 microseconds per kilometer, so every 100 km of route distance adds about 1 ms of RTT before any queuing or processing delay. That pulls interactive and agentic inference toward metro distance — single-digit milliseconds of RTT — while batch and less interactive workloads remain free to pursue low-cost power at national or hyperscale distance. The outcome is not edge versus cloud; it is a distance-stratified market in which each workload class procures the proximity it requires.
Power and space favor distribution
The energy numbers frame the constraint. Data centers consumed an estimated 415 TWh of electricity in 2024 — around 1.5% of global consumption — and the IEA projects that figure roughly doubling to 945 TWh by 2030, with AI the principal driver (IEA, Energy and AI, 2025). Meanwhile hyperscale campuses are increasingly gated by grid interconnection queues: in the United States, the median time from connection request to commercial operation has stretched to roughly five years (Lawrence Berkeley National Laboratory). McKinsey sizes the resulting global data center build-out at up to $7 trillion by 2030 (McKinsey, 2025). Distributed placement is partly an engineering response to that constraint: thousands of smaller sites with existing power envelopes, already permitted and already connected to transport, can absorb inference capacity that a single new campus cannot get energized in time. Operators hold exactly that portfolio — central offices and exchange buildings mostly running far below the power and space provisioned for them in the circuit-switching era.
Sovereignty makes the structure durable
Governments and regulated industries increasingly require AI processing of sensitive data within national borders, under national jurisdiction, in some cases in air-gap-capable environments. A hyperscale region in another jurisdiction does not satisfy that requirement regardless of its unit economics. Distributed, in-country, trusted infrastructure does.
Following the money, the conclusion is direct: every tier below the hyperscale layer requires precisely what operators have spent decades building — physical locations at the intersection of demand, national transport, regulatory standing and field operations. The open question is not whether operators hold the assets, but whether they productize them before the alternative ecosystem does.
6. Operating the AI-era network: the autonomy gap
The operational conclusion of the preceding sections is unavoidable. Traffic that is symmetric, distributed, persistent, non-cacheable and non-deterministic per transaction; latency committed per workload; failures that break services rather than degrade them; load generated 24×7 at machine speed. No NOC built on human dashboard supervision can operate that combination within the required reaction times — MTTR measured in minutes is incompatible with services that fail in milliseconds. The workload has changed; the operating model must change with it.
The TM Forum scale and the Level 2–3 disruption
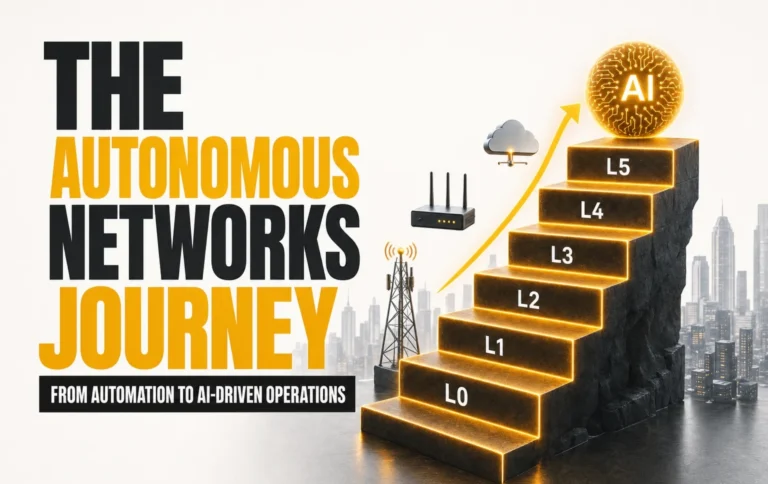
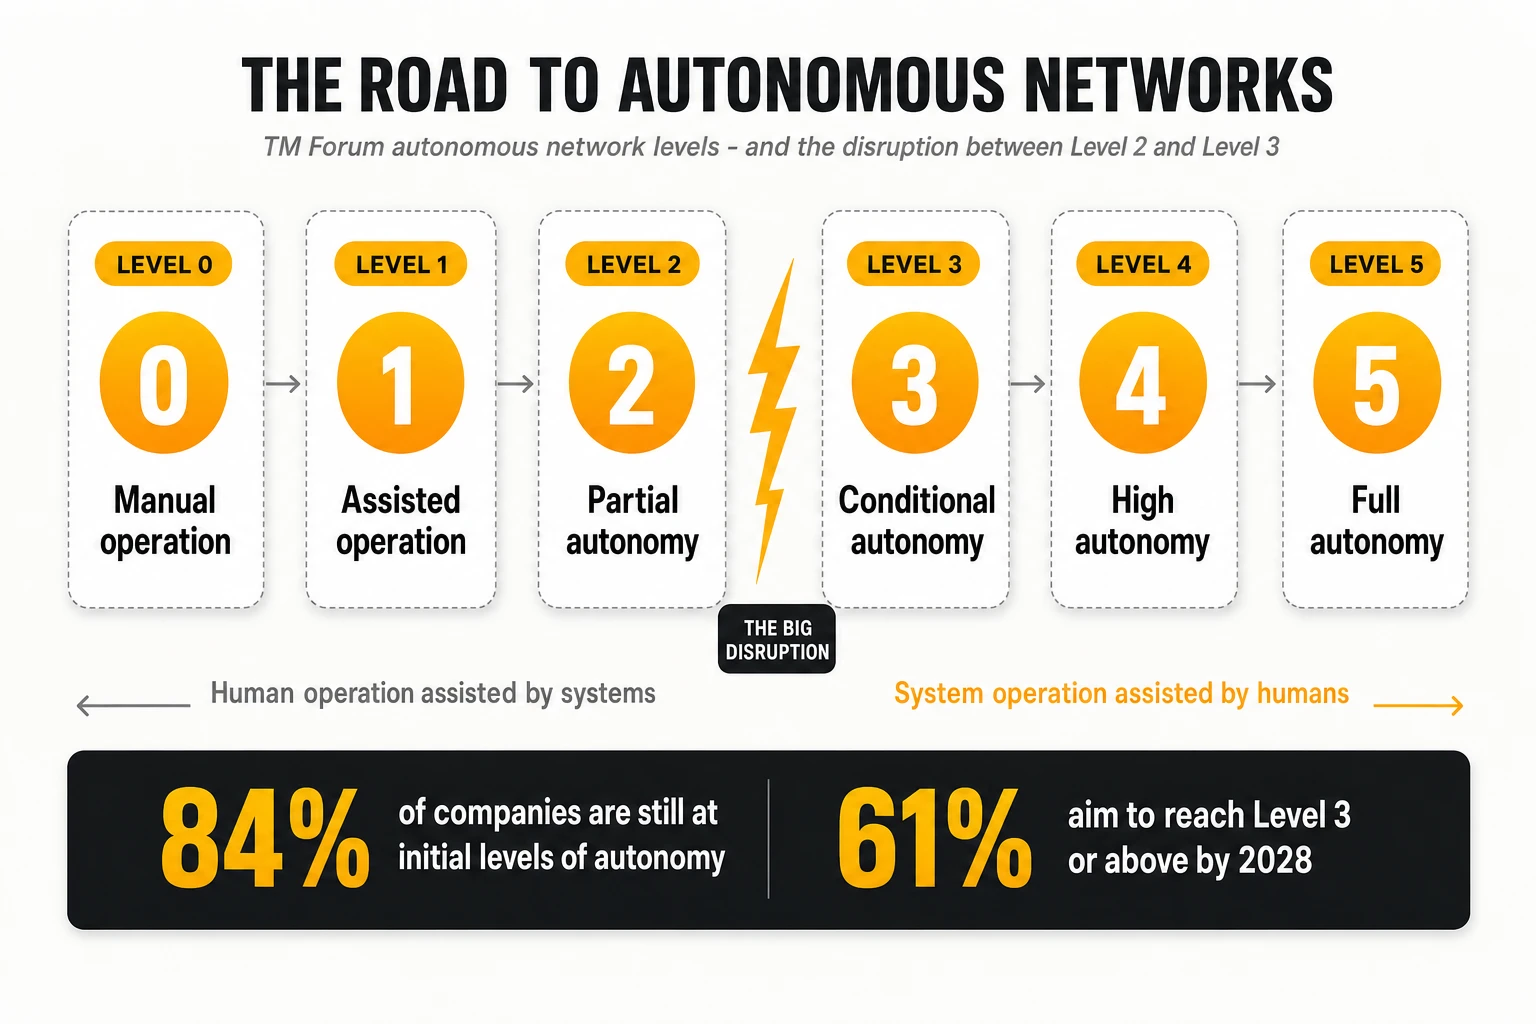
The industry’s shared yardstick is TM Forum’s autonomous network scale, from Level 0 (fully manual operation) to Level 5 (full autonomy). The inflection point sits between Level 2 (partial autonomy — humans operating with system assistance) and Level 3 (conditional autonomy — systems operating with human assistance). That transition inverts the division of labor: below it, personnel run the network with tools; above it, the network runs itself under supervision.
Ambition versus reality
- 84% of companies remain at the initial levels of autonomy, according to survey data based on TM Forum’s framework — while 61% target Level 3 or above by 2028.
- TM Forum’s 2025 survey of 125 respondents across 80 companies found only 21% operating at Level 3 or above (TM Forum, 2025); its 2025–2026 regional benchmark places 31% at Level 2, 17% at Level 3 and only 4% at Level 4.
- A separate Accenture study put 79% of telcos at Level 0 or 1, with only 22% expecting to reach Level 4 by 2030.
Read together: the majority of the industry intends to cross the hardest transition on the scale within roughly two years, starting from its lower half. Some will succeed. Most will not — and the difference will register directly in which operators can carry AI-era traffic at positive margin.
What crossing to Level 3 actually requires
- Closed-loop operation across business, service and resource layers — not merely scripted automation in the NOC. A commercially expressed intent (“this customer’s inference traffic receives sub-10 ms metro latency”) must translate into network action with no human in the loop.
- Telemetry engineered for decisions, not reporting. Autonomous systems act on data, and telemetry designed for monthly capacity reviews cannot drive sub-second control loops. This ties autonomy directly to the visibility investments addressed in the next section.
- Organizational redesign. Level 3 redefines the work of network engineering. Operators making verifiable progress treat it as a workforce transformation program, not a tooling procurement.
AI sits on both sides of this equation. Agentic operations — AI agents acting across business, service and resource layers — are the only realistic mechanism for reaching Level 3+, and AI traffic is the workload that makes Level 3+ mandatory. Operators that frame autonomous operations purely as cost reduction (the widely cited target of ~30% OPEX savings by 2028) are underpricing the program: it is an enablement investment that determines whether AI-era services can be sold at all.
7. Visibility and trust: the two capabilities that make AI SLAs real
Selling connectivity for AI workloads means committing to guarantees the content era never demanded. Two capabilities determine whether those guarantees are enforceable: visibility deep enough to correlate network behavior with AI application experience, and security strong enough to carry sovereign and regulated workloads.
Visibility down to the token
AI-grade assurance is multi-layer and multi-domain by definition: the IP/optical transport layer, the customer VPN/VRF layer, and — new to the assurance stack — the LLM application layer itself. The application-layer KPIs are token metrics:
- Request latency: end-to-end processing time per request, from submission to complete response.
- Time to first token (TTFT): elapsed time before the model begins responding — the metric users perceive most directly.
- Time per output token: the sustained generation rate after the first token — the fluidity of the response.
The commercial test is correlation. An operator that can attribute a degraded TTFT to a specific path, link or transient congestion event in real time can underwrite an AI SLA. One that cannot is selling undifferentiated bandwidth, whatever the contract nomenclature.
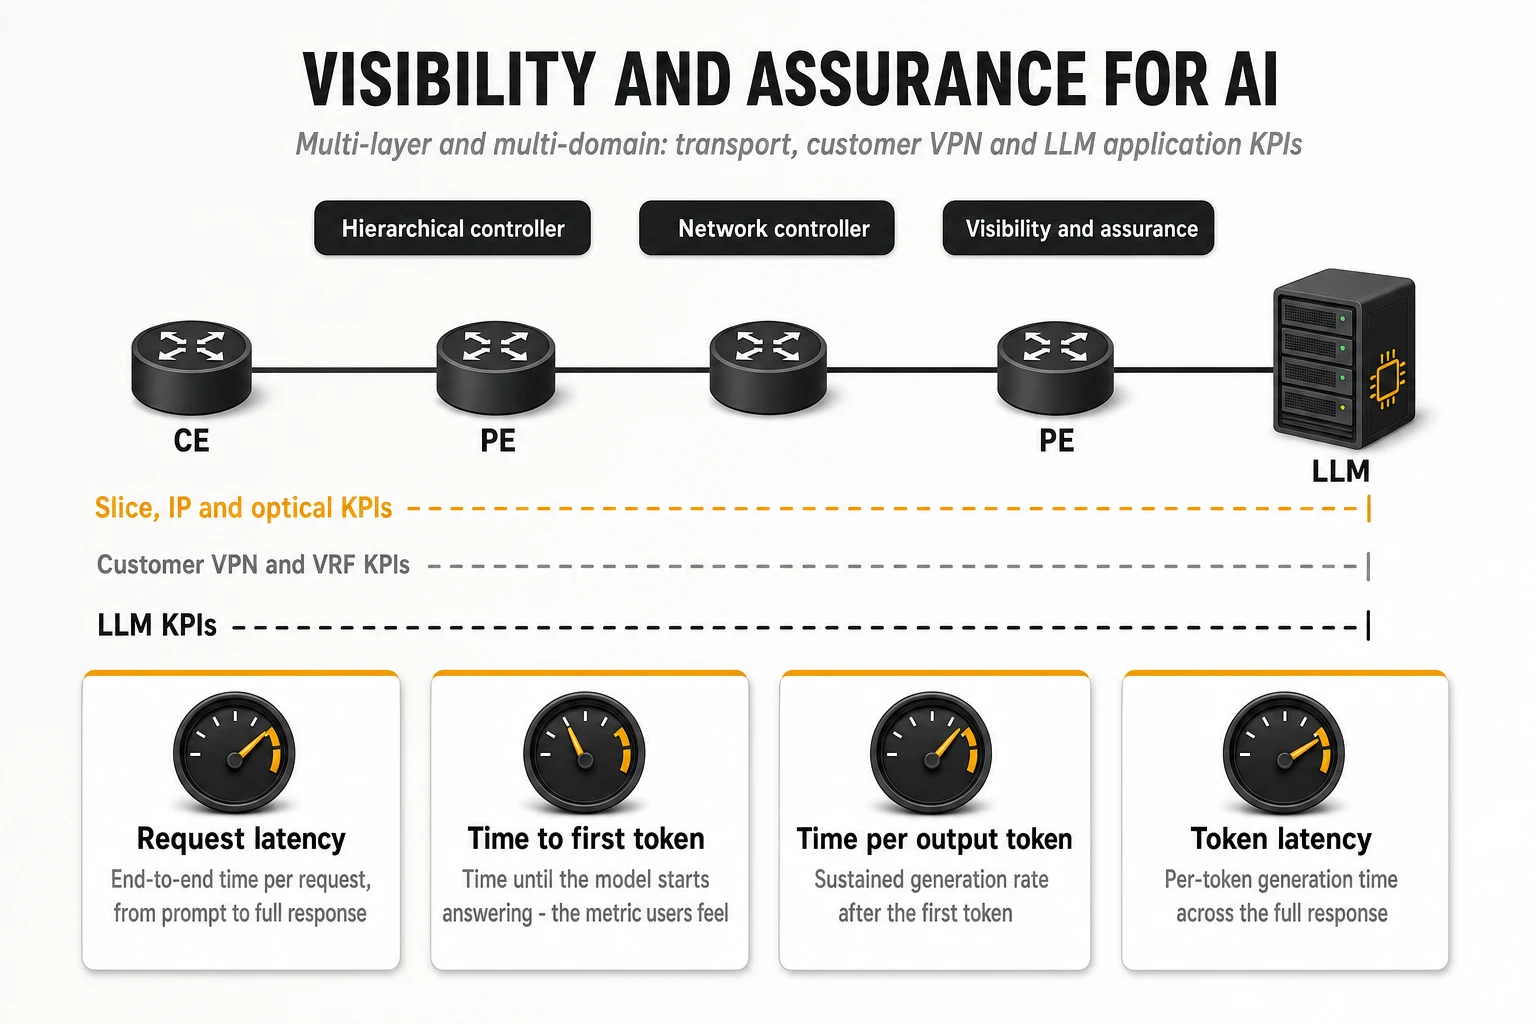
Achieving that correlation is a silicon problem as much as a software one. Granular visibility at AI timescales requires millions of probes at sub-millisecond resolution — feasible only with hardware support in the routing platforms. The emerging toolkit includes in-band performance measurement across all ECMP (equal-cost multipath) branches, exact per-flow path tracing, and deterministic demand matrices computed in real time rather than estimated monthly. The output is closed-loop assurance: real-time heat maps, P99 latency histograms per path and per link, and transient-event detection feeding routing analytics that act on what they observe.
Security fused into the infrastructure, not bolted on
Sovereign and regulated AI workloads carry security requirements that reshape transport design. The pattern consolidating across the industry fuses security into every layer rather than patching the perimeter afterwards:
- Hardware-anchored roots of trust providing secure boot and runtime integrity of network elements — verifiable evidence that each device executes exactly the software it should.
- Quantum-safe link encryption — MACsec with post-quantum pre-shared keys — protecting data in flight against harvest-now-decrypt-later attacks.
- Secure transport slices built with segment routing traffic engineering (SR-TE) and encryption-aware link affinities, constraining sensitive AI traffic to verified nodes and encrypted links within defined boundaries.
- Kernel-level runtime enforcement on network devices — eBPF-based policy engines detecting and blocking attacks against control planes, APIs, CLIs and file systems in real time, without downtime, closing the exposure window between vulnerability disclosure and patching.
- Air-gap-capable stacks with per-tenant isolation — per-tenant networking and encryption with externally held keys (external KMS), so sovereign customers retain control of their own cryptography end to end.
The strategic reading: this list constitutes a moat. Every item is capital-intensive, slow to build and impossible to simulate in an RFP response. Hyperscalers can match the compute; very few players can match verified, sovereign, quantum-safe transport at national scale. It is one of the few genuinely defensible positions operators hold in the AI value chain — which is why it belongs at the center of the commercial proposition rather than in the security annex.
8. The monetization window: this time, the assets match the demand
Most “beyond connectivity” diversification strategies fail for one reason: the operator brings no differentiated asset to the target market. TelcoCrux has made that argument repeatedly. The AI infrastructure opportunity differs in one specific, verifiable respect — the demand profile maps onto assets operators uniquely hold.
The four operator assets AI demand actually requires
- Trust: licensed, regulated, domestically accountable entities — the default counterparty when governments and regulated industries procure a sovereign AI foundation.
- Unique assets: thousands of powered, connected, physically secured facilities — central offices, aggregation sites, metro PoPs — located where inference needs to execute, convertible into edge AI infrastructure.
- End-to-end delivery: full-path control from enterprise premises to data center — the prerequisite for token-level SLAs, and the one capability no hyperscaler, neocloud or colocation provider can replicate.
- Location: presence at the intersection of demand — where enterprises, public sector and consumers actually are, not where land and power happen to be inexpensive.
Three layers of opportunity, three strategic pillars
The opportunity stack comprises three layers, in ascending order of ambition:
- Edge AI: hosting and interconnecting inference at the operator edge.
- AI-ready transport: the assured, secure, observable connectivity fabric spanning every tier of the placement hierarchy.
- Sovereign AI cloud: national-scale AI infrastructure for governments and regulated industries.
Matching those layers, the strategic agenda reduces to three pillars: service monetization (AI-centric B2B and B2C services rooted in enabling customer outcomes rather than reselling capacity), agentic operations (the Level 3+ autonomy that makes the unit economics work), and resilient infrastructure (trusted, observable, AI-ready transport and facilities). The pillars are interdependent; funding one in isolation produces stranded investment.
A crowded, overlapping ecosystem
This is not an uncontested market, and the capital commitments are asymmetric. The four largest hyperscalers guided to more than $300 billion of combined capex for 2025 alone, most of it AI infrastructure (company guidance, reported February 2025) — against roughly $1.5 trillion of total operator capex projected for the entire 2024–2030 period, about 85% of it tied to 5G (GSMA Mobile Economy, 2024). Hyperscalers are extending into every national market; neoclouds (GPU-specialized cloud providers) are scaling at venture speed; colocation providers are adding AI-optimized halls; NaaS and AI-fabric players are building precisely the on-demand interconnection layer operators should have owned. Each competes for a slice of the same stack — and each is simultaneously a potential partner and customer. The accurate framing: operators will partner with some of these players and consume from others, but the roles will be assigned within the next few years and will then harden.
The content-era precedent
Operators held location, trust and delivery advantages in 2008 as well. CDNs and clouds captured the value layer regardless, because operators moved at planning-cycle speed while the ecosystem moved at product speed. Today the placement logic, the sovereignty demand and the assurance requirements all favor operators. Comparable windows have historically remained open for three to five years before the roles hardened.
9. The hype check: what could deflate, and what survives every scenario
No analysis is complete without stress-testing its own argument. Four factors could make the AI traffic story smaller than projected:
- Model efficiency. Inference prices for constant model quality have been falling on the order of 10x per year (a16z, 2024), and smaller models keep absorbing use cases. Fewer bytes per interaction is a genuine countertrend to raw volume growth.
- On-device inference. Every workload that migrates onto the handset or the laptop leaves the WAN entirely. Device vendors are investing heavily in this direction.
- The agent adoption gap. Production deployment (~11%) lags far behind piloting (~38%). If enterprise agents stall at proof-of-concept, the 450%-class growth figures deflate with them.
- Macro discipline. AI infrastructure investment is running ahead of proven revenue across the economy. A funding correction would slow build-outs and traffic in parallel.
Each of those scenarios reduces the volume of AI traffic. None of them restores the legacy structure:
- On-device inference still synchronizes, retrieves and escalates to larger models across the network — asymmetrically upstream.
- Efficient models still serve unique, non-cacheable responses — the CDN offload ratio does not return.
- A slower agent ramp remains a ramp toward machine-speed, always-on load.
This is why the structure-first framing is robust to forecast error. An operator that rebalances toward symmetry, distributed capacity, persistent-flow engineering and token-aware assurance wins in the aggressive scenario and loses nothing in the conservative one. An operator that only procures volume headroom wins only if the most bullish forecasts materialize — and still operates the wrong network if they do.
10. What to do about it: positions by actor
Large operators
- Re-run the five-year demand model with symmetry, persistence and non-cacheability as inputs — not as sensitivities. If the access and metro plans survive unchanged, the model is wrong.
- Select a layer of the AI stack deliberately — edge hosting, AI-ready transport, sovereign cloud — and fund it as a product line with revenue targets, not as an infrastructure trial.
- Treat Level 3 autonomy as a 2028 revenue prerequisite, not an OPEX program, and budget it accordingly.
Mid-size and challenger operators
- Do not attempt to own the full stack. The defensible position is the trusted local layer: sovereign edge facilities plus assured transport, partnered with neoclouds or hyperscalers for compute scale.
- Sell the SLA others cannot underwrite: full-path, token-aware assurance for national enterprises and public sector. It monetizes assets already on the balance sheet.
Enterprises and public sector
- Introduce network requirements into AI procurement now: TTFT SLAs, data-locality guarantees, blast-radius commitments. An AI vendor unable to discuss the network path is itself a risk finding.
- Assign a placement tier per workload class — device, edge, national, hyperscale — on confidentiality and latency first, cost second. Retrofitting sovereignty is materially more expensive than designing for it.
Vendors and integrators
- The differentiators for the coming cycle are measurable: sub-millisecond telemetry at scale, per-path visibility, quantum-safe transport, runtime security without downtime. Roadmaps that lead with capacity alone are content-era roadmaps.
The bottom line
The AI traffic cycle is real, but the prevailing reading of it is wrong. The headline figures — 5–9x growth, 26% inference share, 9x enterprise traffic — invite a content-era response: procure capacity and wait for demand. The actual event is a change in the structure of demand: symmetric, distributed, persistent, unique, machine-generated traffic that cannot be offloaded to caches and will not tolerate manual operations.
Networks built for the legacy structure will carry the new traffic poorly and monetize it worse. Operators that rebuild around placement, assurance, security and autonomy obtain something the content era never offered them: a value layer that maps onto assets only they hold. The last time traffic changed structure, operators financed the build-out and others captured the value. This time, the entry ticket is the network they already own — reimagined, instrumented, and sold as the critical infrastructure of the AI economy.
At TelcoCrux, we help operators and vendors translate the AI traffic shift into network strategy that follows the money — placement, assurance and monetization, not just capacity. If you want an independent view of where your network stands for the AI era, let’s talk.