1. From monitoring to end-to-end intelligent service assurance
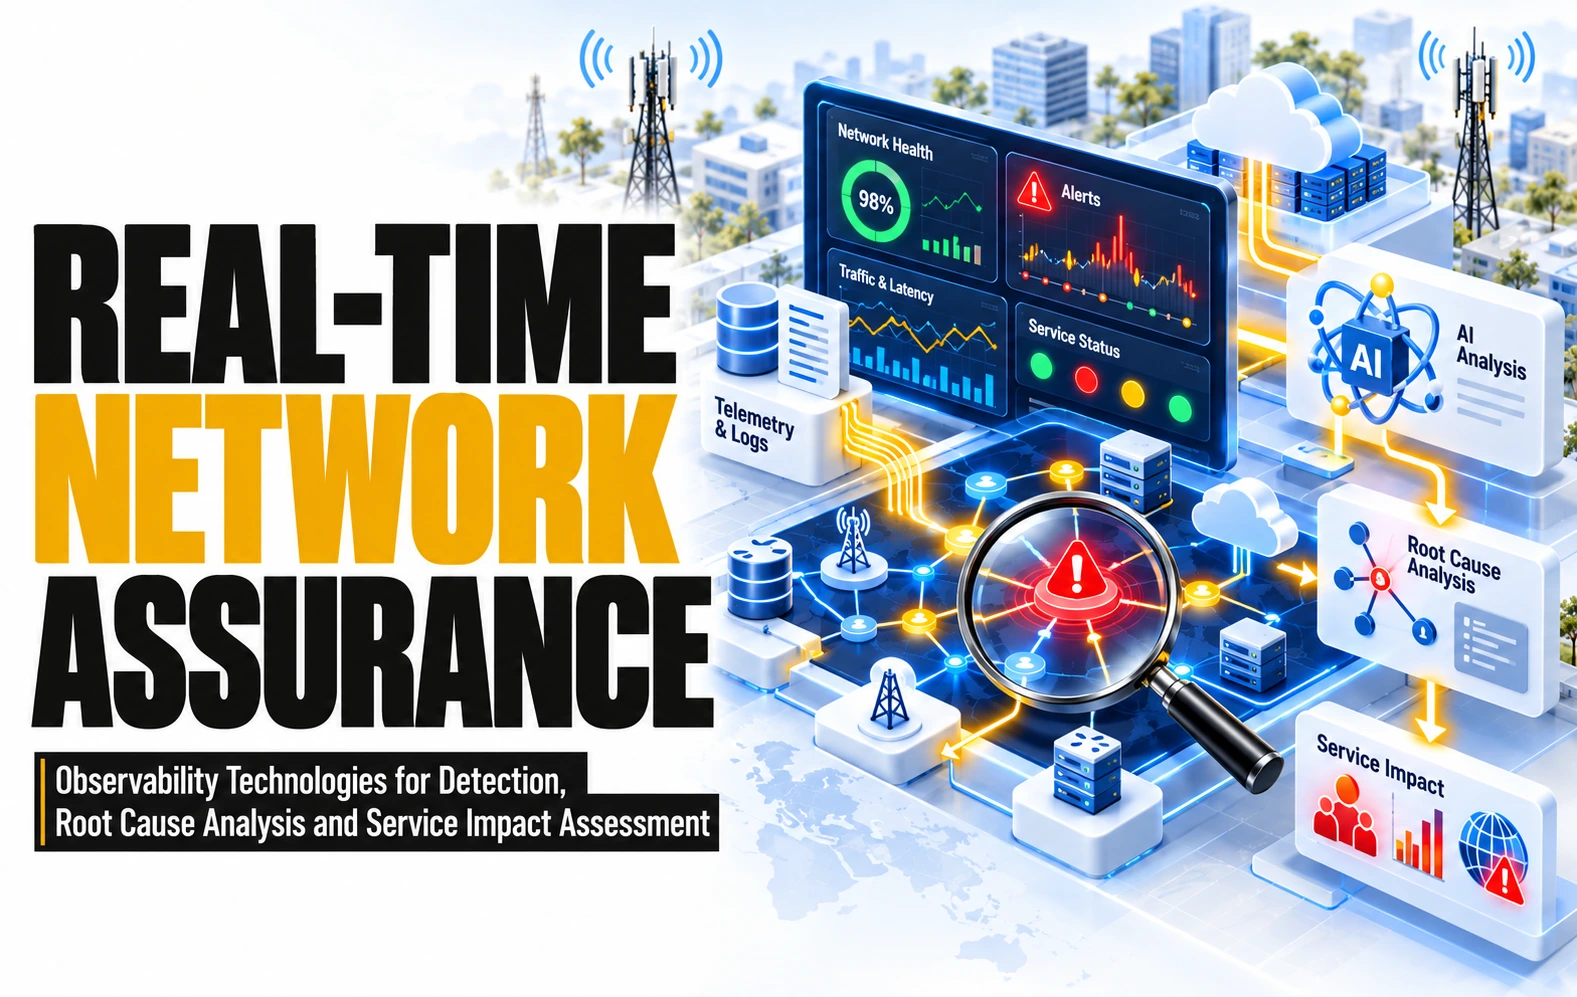
An operator that invests in observability is buying five outcomes, not a tool: detect a degradation before the customer does, understand why and whom it affects, organise the response, act safely, and verify that the service has actually recovered. The market sells pieces of that under six different names, and most programmes fund the first two outcomes and are surprised when the other three do not arrive. This article assembles the pieces into one operational system and gives every part of it a number that stays the same from the architecture to the suppliers.
The whole article runs on nine numbered categories: five operational blocks and four shared layers.
- 01 OBSERVE — capture and observability: the evidence.
- 02 UNDERSTAND — intelligence and diagnosis: detection, correlation, root cause, impact.
- 03 RESPOND — operational management and coordination: event intelligence, incident response, ITSM.
- 04 ACT — automation and remediation: decision, approval, orchestration, execution.
- 05 VERIFY AND LEARN — verification and improvement: recovery confirmed, closure, learning.
- 06 DATA AND REAL-TIME PROCESSING — the backbone every block writes to and reads from.
- 07 NETWORK AND SERVICE CONTEXT — discovery, inventory, topology, knowledge graph, dependencies.
- 08 AGENTIC AI AND OPERATIONAL KNOWLEDGE — agents, investigation, knowledge, tools.
- 09 GOVERNANCE, SECURITY AND CONTROL — identity, policies, authorisation by risk, audit, human control.
The same nine numbers organise every section. Section 2 describes the life of an incident and names the block that performs each step. Section 3 draws the architecture. Section 4 develops the capabilities of each category, 4.1 to 4.9, in the same order. Section 5 maps the suppliers to the same nine categories. Section 6 compares four ways of assembling them, category by category. Sections 7 to 10 test the result on two scenarios, a validation method, the published evidence and a roadmap. The model applies to any domain an operator runs — mobile core and radio, fixed access and transport, IP and optical, cloud platforms, digital and enterprise services; the mobile core supplies most examples because that is where the pressures are most visible.
Two disclosures. Views about a supplier’s strengths and limits are TelcoCrux assessments from documentation, published deployments, standards and analyst material, not laboratory benchmarks. Vendor-published percentages are reported as vendor claims and are not planning assumptions until the operator has reproduced them on its own incidents.
The question the article answers: how can an operator assemble observability, network intelligence, service context, incident management, agentic AI and governed automation into one operational system that detects, understands, resolves and verifies service degradation with progressively less human intervention? No supplier provides every part. The operators publishing validated results assembled the parts deliberately, kept the model of their network under their own control, and measured the result as recovered service rather than as reduced alerts.
What the operator is actually trying to achieve
Stated without product vocabulary, the objective has ten parts. Most programmes fund the first four and are then surprised that the last six did not arrive.
- Identify deviations before a conventional alarm fires, wherever the evidence allows (01, 02).
- Detect real degradations of the service, not excursions of a counter (02).
- Correlate related problems and eliminate the noise that buries them (02, 03).
- Identify probable causes with evidence and a stated confidence, not a single name delivered with false certainty (02).
- Determine which services and customers are affected, and prioritise by that impact rather than by alarm severity (02, 03, 07).
- Coordinate the response — the right team, supplier and escalation — without a human assembling it by hand (03).
- Investigate with the operator’s own knowledge, faster than a person reading five consoles (08).
- Automate the actions that are safe to automate, under explicit authorisation (04, 09).
- Verify that the service has recovered, which is a different fact from an action having executed (05).
- Learn from each incident so that the next one is detected sooner, diagnosed faster or avoided (05).
The first four are a technology problem. The remaining six are an operations problem. They have to be solved together, which is why the architecture gives the operational half the same depth as the technical half.
Six words that describe complementary capabilities, not competing products
The market uses six terms for parts of this objective. Each is necessary; none is sufficient.
- Monitoring measures resources against thresholds and raises alarms. It never disappears: hard failures are still best caught by a rule. Lives in 01.
- Observability widens the evidence — metrics, logs, traces, events, sessions — so that questions nobody anticipated can be asked. It is about the richness and freshness of the signal. Lives in 01 and 06.
- Service assurance adds the model: it relates evidence to services, customers and commitments, so a degradation can be stated in the terms a contract uses. Lives in 02 and 07.
- AIOps applies statistics and machine learning to the volume. It comes in two flavours that the article keeps apart: alert management (03) and causal diagnosis (02).
- Incident management turns a diagnosed problem into work: a record, an owner, a priority, an escalation path, a closure. Lives in 03.
- Autonomous operations is the ambition that the chain runs with progressively less human intervention, by incident class and by risk. It is a property of the whole cycle, governed by 09.
Two problems, not one
The technological problem is to obtain, connect and understand the signals. Get evidence out of a cloud-native network at the right granularity and latency; resolve identities so that one function is one entity whichever system named it; hold a model of what depends on what; run the engines that detect, correlate and explain. That is 01, 02, 06 and 07.
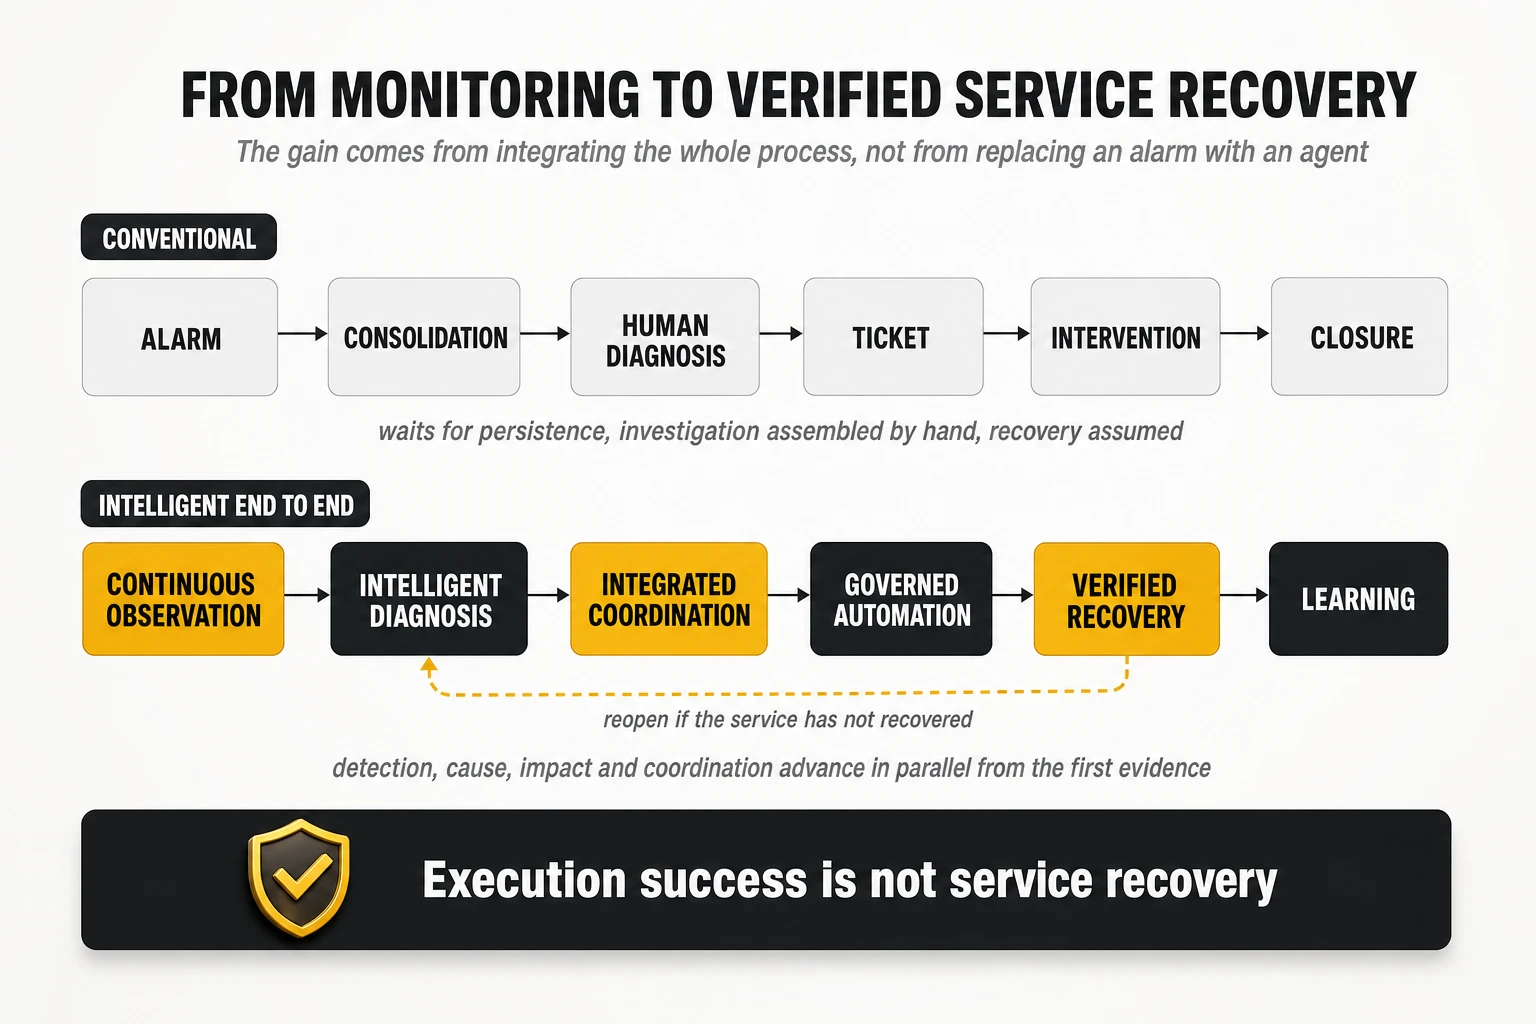
The operational problem is to convert that intelligence into decisions, actions and a verified restoration of the service. Decide that a set of correlated anomalies is an incident worth working; prioritise it; open and maintain a record several teams and suppliers can act on; choose an action and authorise it by its risk; execute it through the system that actually controls the network; verify that the customers are back; close the loop with what was learned. That is 03, 04, 05, 08 and 09.
The market is far better at selling the first problem. A platform that solves it brilliantly and hands the second to a human with a ticket has moved the bottleneck, not removed it. The figure below is the difference, in one line per model.
2. The end-to-end operating model
Before any architecture is drawn, the process it serves has to be written down, and the most useful form is the life of one incident from the first abnormal evidence to a verified closure. The sequence has sixteen steps because the steps most architectures compress into “action” are the ones that decide whether a service is restored. It is not a chain: several steps run in parallel, simple incidents skip some, and the whole thing loops back when an action fails. The same life cycle governs a user plane function in a 5G core, a broadband access node, a transport link, a cloud platform under a digital service and an enterprise product spanning all of them. Each step names the block or layer that performs it.
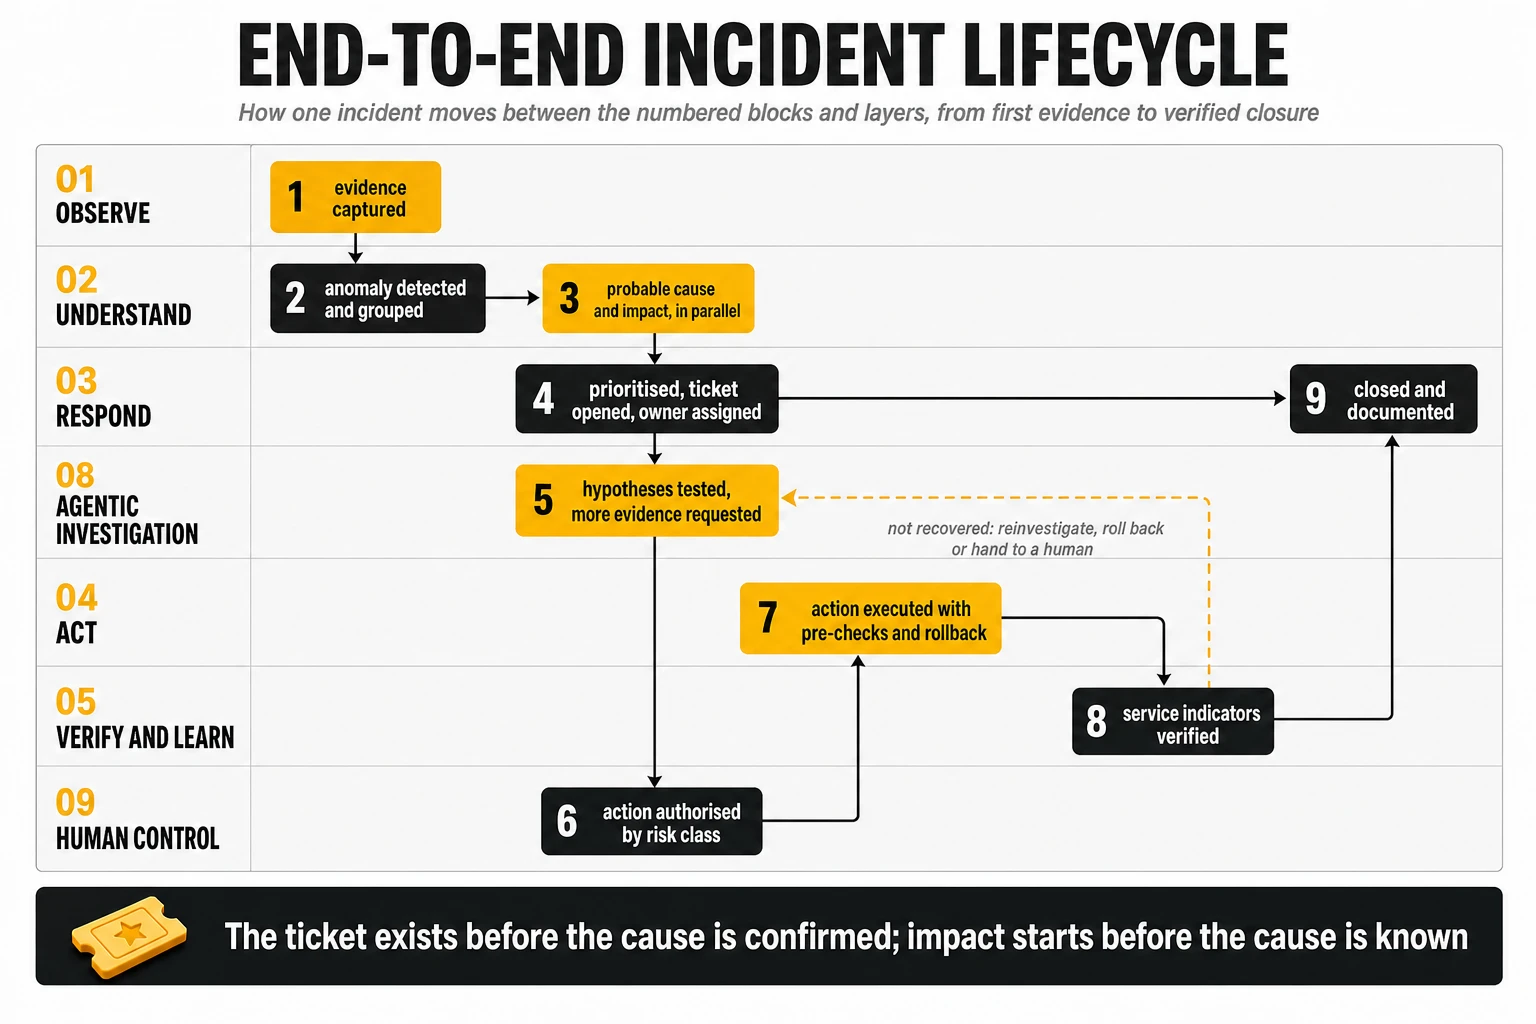
The life of an incident, step by step
| Step | What happens | Block or layer | Runs in parallel with |
|---|---|---|---|
| 1. Capture | Events, alarms, indicators, telemetry, sessions and experience measurements are collected continuously and normalised | 01 Observe, on 06 Data | Everything; it never stops |
| 2. Detect | A deviation from expected behaviour is identified, with or without a conventional alarm | 02 Understand (02.1, 02.2) | Capture |
| 3. Group and reduce | Related symptoms are deduplicated, suppressed, grouped and enriched so that one problem appears once | 03 Respond (03.1), using 02.3 | Detection of further symptoms |
| 4. Recognise a potential incident | The grouped evidence is judged worth working as an incident | 03 Respond (03.1), policies in 09, sometimes a human | Steps 5 to 7 |
| 5. Assess criticality | An initial priority is assigned from the service affected and the evidence available | 03 Respond (03.2), with context from 07 | Steps 6 and 7 |
| 6. Identify probable cause | A hypothesis with evidence for and against and a confidence level | 02 Understand (02.4); later 08 Agents | Step 7; refined throughout |
| 7. Estimate impact | Affected sessions, services, customers and commitments | 02 Understand (02.5) over the chain in 07 | Step 6; does not wait for it |
| 8. Create or update the incident record | A ticket is opened or updated, with identifiers that tie it to the evidence | 03 Respond (03.3), synchronised with 03.2 | Steps 6 and 7 continue |
| 9. Assign and mobilise | An owner, an on-call rotation, a team or a supplier is engaged; stakeholders are notified | 03 Respond (03.2) | Investigation |
| 10. Investigate in context | Hypotheses are tested against changes, infrastructure state, peers and additional evidence, including capture on demand | 08 Agents and engineers, through 06 and 07; evidence from 01.5 | Impact refinement; coordination |
| 11. Select an action | A mitigation or repair is chosen from runbooks, recommendations or expert judgement | 04 Act (04.1); 08 recommends | Risk assessment |
| 12. Authorise by risk | The action is approved automatically, by a human, or refused, according to its class and blast radius | 09 Governance, through 04.2 | Nothing: a gate |
| 13. Execute | Pre-checks, the change, post-checks, with rollback ready | 04 Act (04.3, 04.4) | Monitoring of side effects |
| 14. Verify recovery | Service indicators, experience and the affected customers are checked, not only the component | 05 Verify (05.1, 05.2) | Nothing: a gate |
| 15. Close | The incident is resolved and closed; customers and stakeholders are informed | 05 Verify (05.3) in the record of 03.3 | Step 16 |
| 16. Document and learn | Cause, timeline, actions and outcome are recorded; models, rules and runbooks are updated; a problem record is opened if the cause is structural | 05 Verify (05.4); 08 drafts; 03.3 holds | Normal operation |
What runs in parallel, and why the sequence is not a chain
Three overlaps are design rules, not observations. An architecture that does not support them will be slow in exactly the incidents that matter.
- The record exists before the cause is confirmed. A grouped set of anomalies affecting a service is enough to open a ticket, assign an owner and inform the customer desk. The ticket is enriched as the diagnosis improves, not withheld until it is complete.
- Impact starts before the cause is known. The dependency model produces the list of affected customers from the affected element alone, and the operations centre, the enterprise desk and customer care need that list immediately.
- Mobilisation runs while the investigation continues. The on-call engineer or the supplier is engaged on the probable cause, not after it is proven, which is why the probable cause must carry a confidence.
The process waits in only two places. The authorisation of an action (step 12) is a gate governed by risk. The verification of recovery (step 14) is a gate governed by evidence. Everything else overlaps. And there are two loops: when an action does not restore the service, the investigation reopens with the evidence the action produced; when verification reveals a side effect, the action is rolled back and the incident returns to step 10 instead of closing.
Incident, problem and change: three processes and the transitions between them
The life cycle above belongs to incident management, whose only purpose is to restore the service. Two neighbouring processes have to be connected to it. Problem management asks why this keeps happening and what structural change would stop it; it works on what incident management leaves behind: the recorded cause, the recurrence, the pattern. Change management governs deliberate modifications with its own approvals, windows and rollback plans, and it matters to assurance in both directions: a large share of degradations begin shortly after a change, and most remediations are themselves changes.
The transitions are where integration is usually weakest, and the architecture treats them as interfaces that have to exist.
- An incident whose cause is recurrent or structural opens or links to a problem record instead of simply closing (05.3 → 03.3).
- A problem whose fix is identified spawns a change with the normal controls (03.3 → 04.2).
- A change that coincides with the start of a degradation appears in the incident’s evidence automatically, through shared identifiers, not through an engineer remembering to look (04.2 → 02.4 and 08).
- An automated remediation is registered, pre-checked and auditable as a change even when it executes in seconds (04.4 → 04.2).
Five scenarios the operating model has to handle
The same life cycle runs differently depending on how much of it the system is allowed to do alone. An operator should be able to name, for each class of incident, which of five scenarios applies: fully automatic resolution; automatic detection with agentic investigation and supervised action; assignment to an engineer with a pre-investigated record; cross-domain coordination or supplier escalation; and the case in which the automation or the verification fails. The fifth scenario decides whether the architecture is trusted, and it is the one to design first.
| Scenario | Who diagnoses | Who decides | Who executes | What the system must guarantee |
|---|---|---|---|---|
| Detected and resolved automatically | Engines, with agents for evidence | Policy, pre-approved for the incident class | Automation with pre-checks and rollback | Verified recovery before closure; full audit trail; measured precision for the class |
| Detected automatically, agentic investigation, supervised action | Engines and agents | A human, on an evidence-backed recommendation | Automation on approval | Recommendation with confidence and alternatives; one-click authorisation; verification |
| Assigned to an operator | Engines and agents pre-investigate; the engineer concludes | The engineer | Engineer, or automation on the engineer’s instruction | Prioritised, enriched record; fast routing; tools that save the engineer the first hour |
| Cross-domain coordination or supplier escalation | Several teams, with a shared evidence base | The incident commander | Multiple parties | One master record; synchronised identifiers; escalation policy; supplier interfaces |
| Automation or verification fails | Reopened investigation with the new evidence | A human, immediately | Rollback or fallback, then human-led action | Detection of the failure itself; safe reversal; no closure without verification |
3. The reference architecture: five operational blocks and four shared layers
The architecture has five operational blocks (01 to 05), in the order the life cycle runs through them, and four shared layers (06 to 09) that serve several blocks each. It is an abstraction of responsibilities, not a list of nine products: one platform may cover several categories, and one category almost always needs several systems. What the abstraction fixes is the set of responsibilities and the interfaces between them, so that an operator can ask of any tool, including the ones it already owns, which category it serves, what it needs from the others, and what it must never be asked to do.
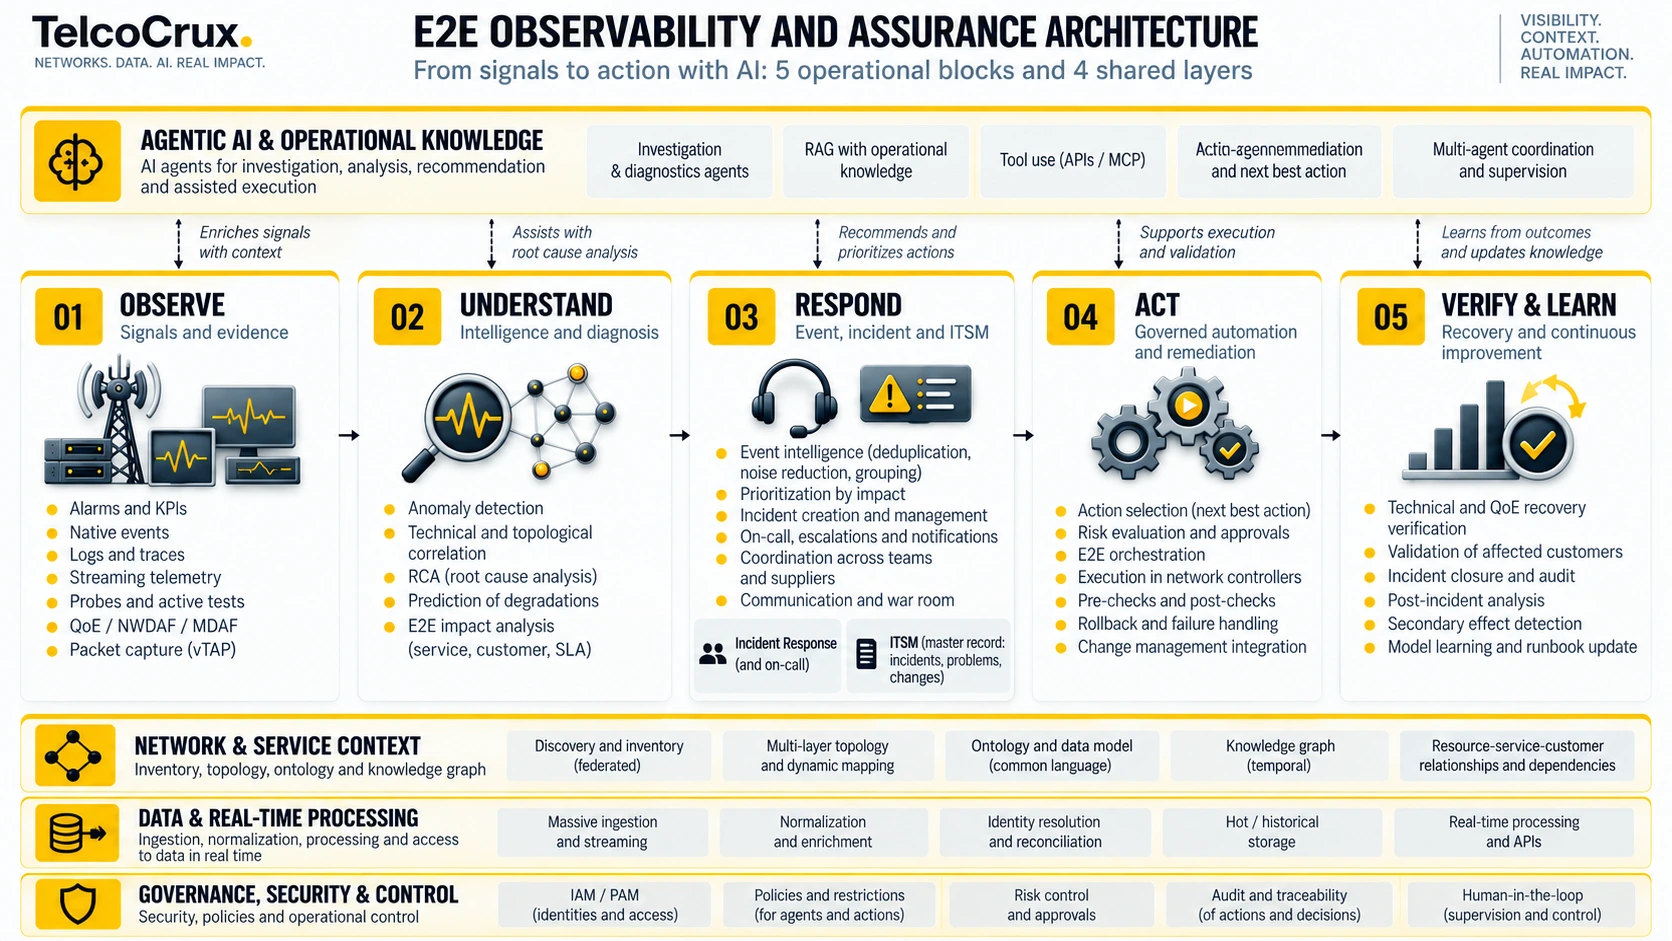
The five operational blocks (01 to 05)
The blocks are the five responsibilities of the system, from the first evidence to the recovery of the service. The table is the canonical list; section 4 develops each capability under the same number.
| Block | Responsibility | Capabilities | Shared layers it depends on most |
|---|---|---|---|
| 01 OBSERVE Capture and observability | Obtain the evidence at the granularity and latency the rest of the system needs, with some of it independent of the systems observed | 01.1 Alarms, counters and KPIs · 01.2 Native function events · 01.3 Logs, traces and streaming telemetry · 01.4 NWDAF and MDA feeds · 01.5 Probes and selective packet capture · 01.6 QoS, QoE and active tests | 06 for ingestion and identities; 09 for access and privacy of captures |
| 02 UNDERSTAND Intelligence and diagnosis | Turn evidence into an understood situation: what deviates, what belongs together, what probably caused it, whom it affects | 02.1 Anomaly detection · 02.2 Degradation prediction · 02.3 Technical and topological correlation · 02.4 Root cause with hypotheses and confidence · 02.5 Service, customer and SLA impact | 07 for topology and the chain to commitments; 06 for streams and history |
| 03 RESPOND Operational management and coordination | Turn a situation into managed work: one incident, one owner, one record, the right teams and suppliers | 03.1 Event intelligence · 03.2 Incident response · 03.3 ITSM and the master record | 07 for service ownership and impact; 09 for policies; 08 for enrichment and drafting |
| 04 ACT Automation and remediation | Convert an authorised decision into a safe change in the network or the platform | 04.1 Action selection and risk evaluation · 04.2 Approvals and change management · 04.3 End-to-end orchestration · 04.4 Execution with pre-checks, post-checks and rollback | 09 for authorisation by risk class; 07 for the blast radius; 08 for recommendations |
| 05 VERIFY AND LEARN Verification and improvement | Confirm that the service, not only the component, has recovered; close on evidence; improve the system | 05.1 Technical and QoE recovery verification · 05.2 Affected-customer validation and side effects · 05.3 Validated closure and post-incident analysis · 05.4 Learning: models, baselines, runbooks | 01 and 02 for the indicators; 07 for the customers to confirm; 08 for the analysis |
The four shared layers (06 to 09)
The layers are capabilities that several blocks use, and the most important change against earlier versions of this analysis is that the data backbone is a layer of its own, not a sub-function of observe. The graph in 07 is the clearest example of a layer that serves many blocks: 02 needs it for root cause, 03 to find the owner, 04 to evaluate the risk of an action and 05 to know which customers must be confirmed as recovered.
| Layer | Responsibility | Capabilities | Blocks it serves |
|---|---|---|---|
| 06 DATA AND REAL-TIME PROCESSING | Move, normalise, reconcile, store and expose every signal, as streams and as history, under the operator’s control | 06.1 Ingestion and streaming · 06.2 Semantic normalisation and identity reconciliation · 06.3 Temporal processing · 06.4 Hot and historical storage, search and analytics · 06.5 APIs and visualisation | 01, 02, 05 directly; 03, 04, 08 through its APIs |
| 07 NETWORK AND SERVICE CONTEXT | Know what exists, what depends on what, and who is affected, as it is now and as it was when the incident began | 07.1 Discovery · 07.2 Federated inventory and reconciliation · 07.3 Multilayer dynamic topology · 07.4 Ontology and temporal knowledge graph · 07.5 Resource to service to customer to commitment chain, changes and dependencies | 02, 03, 04, 05 and 08 |
| 08 AGENTIC AI AND OPERATIONAL KNOWLEDGE | Investigate what the engines surface, using the operator’s systems and knowledge through tools; recommend and coordinate | 08.1 Specialised agents and investigation · 08.2 Operational knowledge, RAG and history · 08.3 Tool access and contracts · 08.4 Recommendation and coordination | 02 (investigation), 03 (enrichment, drafting), 04 (recommendation), 05 (analysis) |
| 09 GOVERNANCE, SECURITY AND CONTROL | Decide what may run alone, what needs approval and what is forbidden; secure, audit and keep humans in control | 09.1 Identity, access and security · 09.2 Policies and autonomy control · 09.3 Audit, traceability and human control · 09.4 Observability of agents and automations | All five, most visibly at the two gates (steps 12 and 14) |
Three separations that must stay explicit
Three confusions cost operators more than any product choice, and the numbering exists partly to prevent them.
- Technical correlation (02.3) is not event intelligence (03.1). Correlation decides which symptoms may share a cause. Event intelligence decides which alerts are consolidated, which are suppressed and how they become operational work. A correlation overlay and an incident response platform overlap here, and they do not perform the same function.
- Event intelligence (03.1), incident response (03.2) and ITSM (03.3) are three capabilities, not one. The first manages and enriches signals. The second mobilises, escalates and coordinates. The third holds the master record of the incident, its changes and its problems. This is why an incident response platform and an ITSM platform are not the same purchase.
- Agentic intelligence (08) is transversal, not a replacement for 02. Detection and correlation run continuously and deterministically. Agents investigate situations, use tools, consult knowledge and propose actions. They do not need to process every raw event, and an architecture that makes them do so will be slow, expensive and late.
Two loops and three flows
The architecture runs at two speeds, and keeping them apart is the single most important design decision in it. The fast loop (01 and 02 on 06 and 07) is continuous: ingestion, identities, detection, grouping, preliminary correlation and the first estimate of cause and impact, performed by deterministic and analytical engines over streams, with no language model invoked per signal. The agentic loop (08 over 02, 03 and 04) is triggered: when the fast loop produces a situation worth investigating, agents take the structured hypotheses, reach through tools into the model, the evidence, the changes and the history, test and refine, request more evidence, draft the assessment and coordinate the response.
Three flows cross both loops and are designed separately.
- Evidence flow — high volume, one direction: from sources through 06 to the engines, the model and the stores. Design questions: granularity, latency, loss, identity.
- Decision flow — low volume, bidirectional: hypotheses, priorities, recommendations and authorisations between 02, 08, 03, 09 and humans. Design questions: structure, confidence, traceability, who may decide what.
- Execution flow — authorised actions from 04 to the systems that control the network, and verification results back to 05. Design questions: pre-checks, permissions, rollback, audit.
A platform that mixes the three — an agent that reads raw telemetry to decide and then writes directly to a controller — has removed the gates that make the architecture safe.
4. The technology capabilities behind each block and layer
This section develops the nine categories in order, 4.1 to 4.9, under the same numbers as section 3, and each capability keeps its number: 01.1 to 09.4. It is the longest section because these are the capabilities an operator will specify, buy, build or integrate. Suppliers are deliberately absent until section 5; here the question is only what each capability must do and what it must never be confused with.
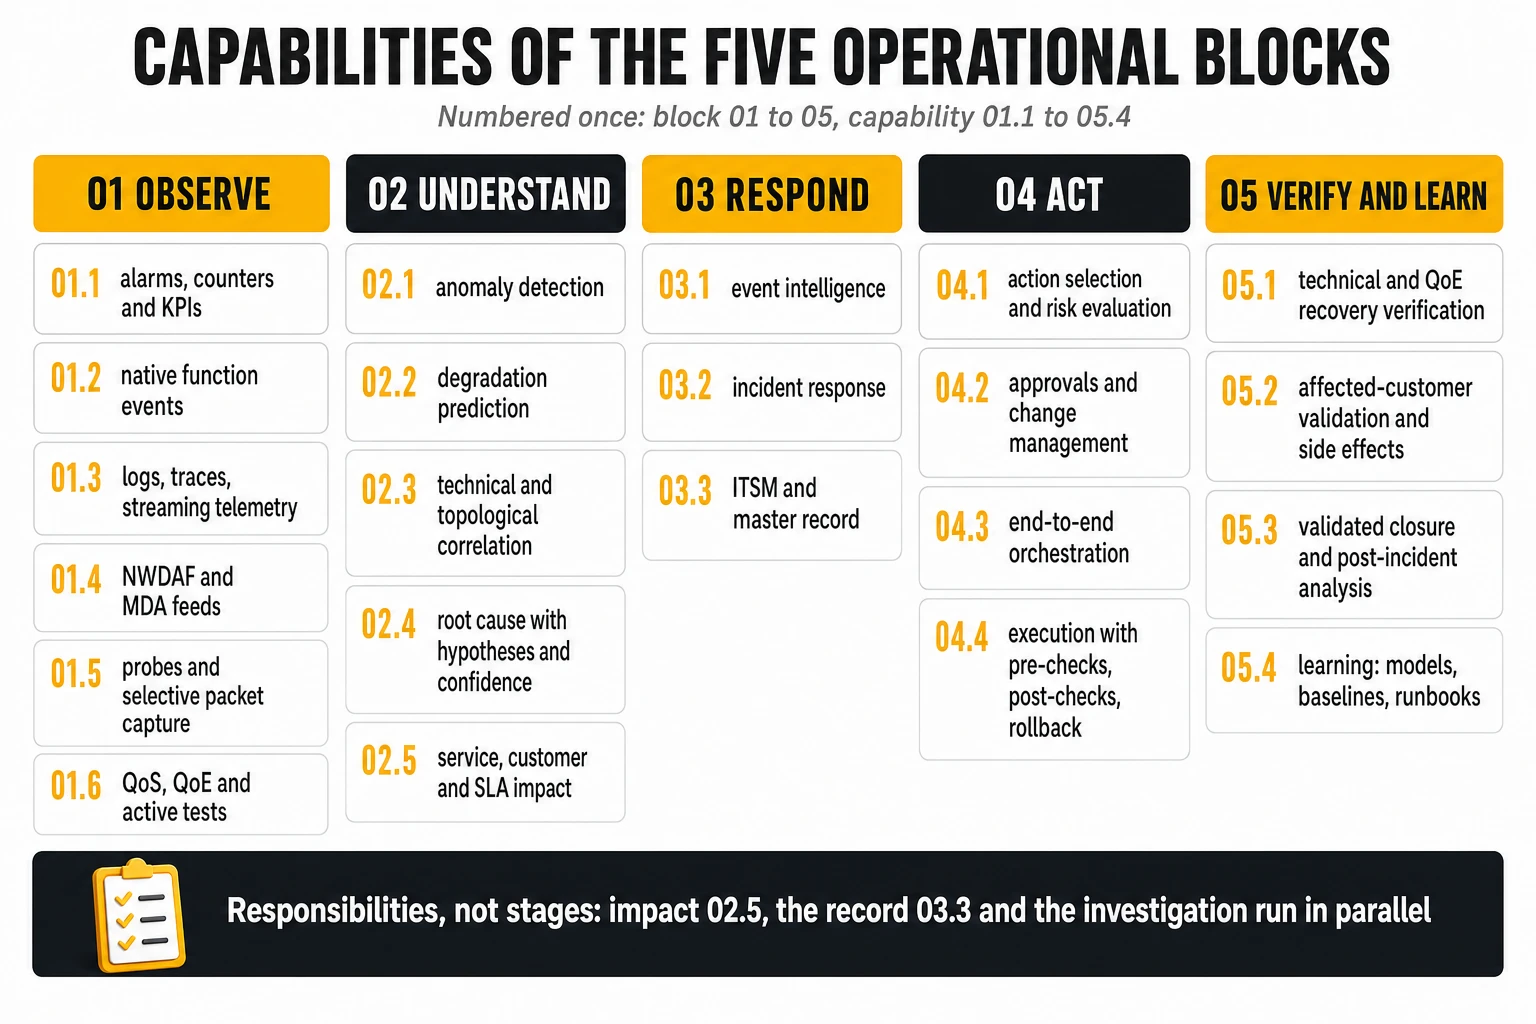
4.1 — 01 OBSERVE: capture and observability
Every signal answers some questions and not others, and the observe block is designed by knowing which is which. Two properties are decided here and cannot be recovered later: the granularity and latency of the evidence, which set the floor for how early anything can be detected; and the independence of some of that evidence from the systems it observes, which decides whether the operator still sees a function when the function stops reporting. The six capabilities below are the sources; the table after them fixes the vocabulary.
01.1 Alarms, counters and KPIs
Alarms report explicit failures and crossed limits, immediately and unambiguously, and nothing about slow degradation. Performance counters and indicators describe aggregate behaviour over time and are the raw material of statistical baselines; they say nothing about which subscriber or which session. Both come from element managers and mediation, usually at a cadence of one to fifteen minutes, and that cadence is the first limit on detection latency: no engine can see at ten seconds a deviation that is reported every fifteen minutes.
01.2 Native network function events
A native event is a semantic record the function emits for every procedure it handles: what happened, to whom, why, with cause and sub-cause codes, on which slice. The practice is established for well over a decade in some vendors’ packet cores, and no external observer can reconstruct the same record as cheaply. Two limits keep other sources alive:
- Events are not states. An event says that X happened; observability also needs to know how X is now. A session failure event carries none of the processor load, packet loss, routing, cluster state, software release or topology that correlation is made of.
- Control-plane events say almost nothing about the user plane. Knowing that a session was established does not say that a video is running at 1.4 Mbit/s with 120 milliseconds of round-trip time. The only place in a mobile core where the 3GPP session and the IP flow meet is the user plane function; a gateway that classifies traffic and emits per-flow usage events closes part of that gap, and a probe or inspection engine closes the rest.
01.3 Logs, traces and streaming telemetry
Logs and traces record the internal sequence of a failure inside the software; streaming telemetry from platforms and devices exposes how a function and its infrastructure are behaving now. In a containerised network this capability also includes the platform’s own signals: Kubernetes events, scheduling and scaling, resource consumption per pod, service mesh call records and kernel-level flow observation. Standard telemetry frameworks such as OpenTelemetry make these signals portable between tools. None of them sees the subscriber unless identity resolution in 06 joins them to the session.
01.4 NWDAF and MDA feeds: a direction, not a dependency
Standardised analytics move the analysis to the function rather than to the wire. The Network Data Analytics Function of 3GPP TS 23.288 subscribes to the functions’ event exposure services and provides analytics to authorised consumers, with Release 18 adding direct user plane event exposure. Management Data Analytics in 3GPP TS 28.104 consumes performance data, traces, alarms, NWDAF output and non-3GPP management data. ETSI’s Zero-touch network and Service Management framework describes the closed loops that block 05 ultimately implements. All three are a direction the plan follows and not a dependency it waits for: every core vendor exposes events in its own format today, and a migration that waits for standardisation will wait for years while the probe estate keeps growing.
01.5 Probes and selective packet capture
Sessions reconstructed by probes or exported by the functions show what actually crossed an interface, with protocol-level proof; packet capture is the deepest evidence and the most expensive. The strongest technical argument for keeping some packet evidence is independence: when the function generates its own observability, the observer and the observed are the same software, and a crash or a release that silently changes an event format can take the service and the evidence of the service down together. A passive observer keeps observing when the function stops reporting. The design question is therefore which points need an observer that does not depend on the function: the boundaries the operator does not control on both sides, such as roaming and interconnect, and the aggregation points through which every session passes. The independent observer need not be a classical probe: infrastructure-level observation in the cluster, flow telemetry from the transport, active tests from the terminal side, the cross-check of one function’s events against its peer’s, and export-health monitoring that turns a silent export into an alarm all qualify.
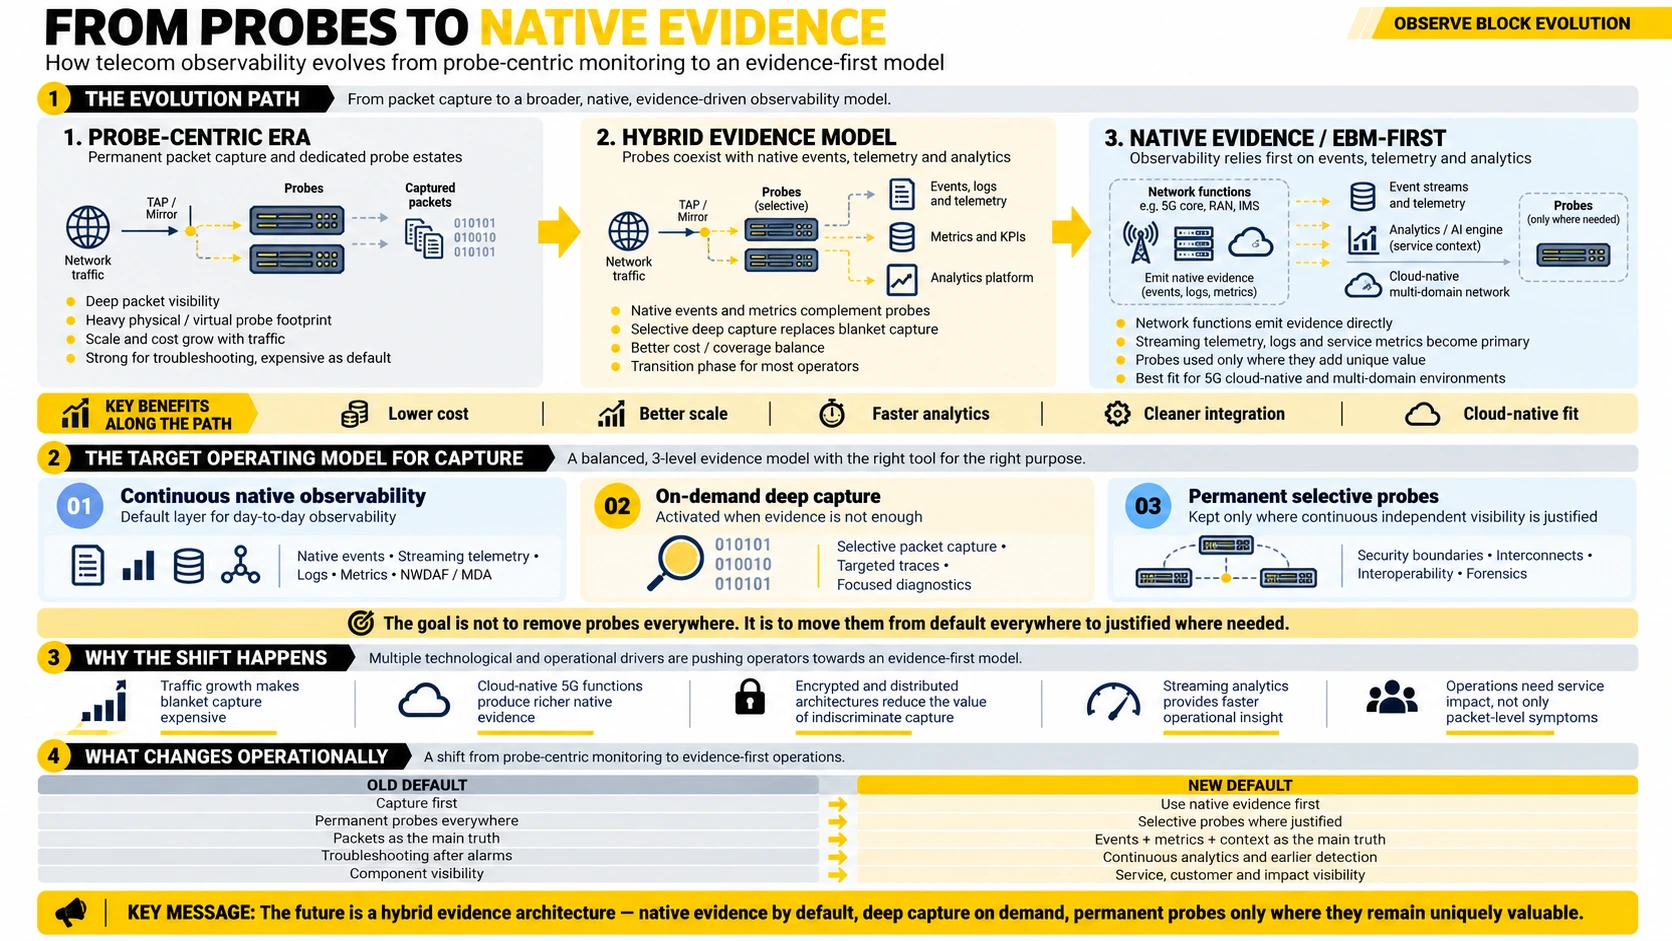
The target is three tiers of instrumentation, with lawful interception deliberately outside them.
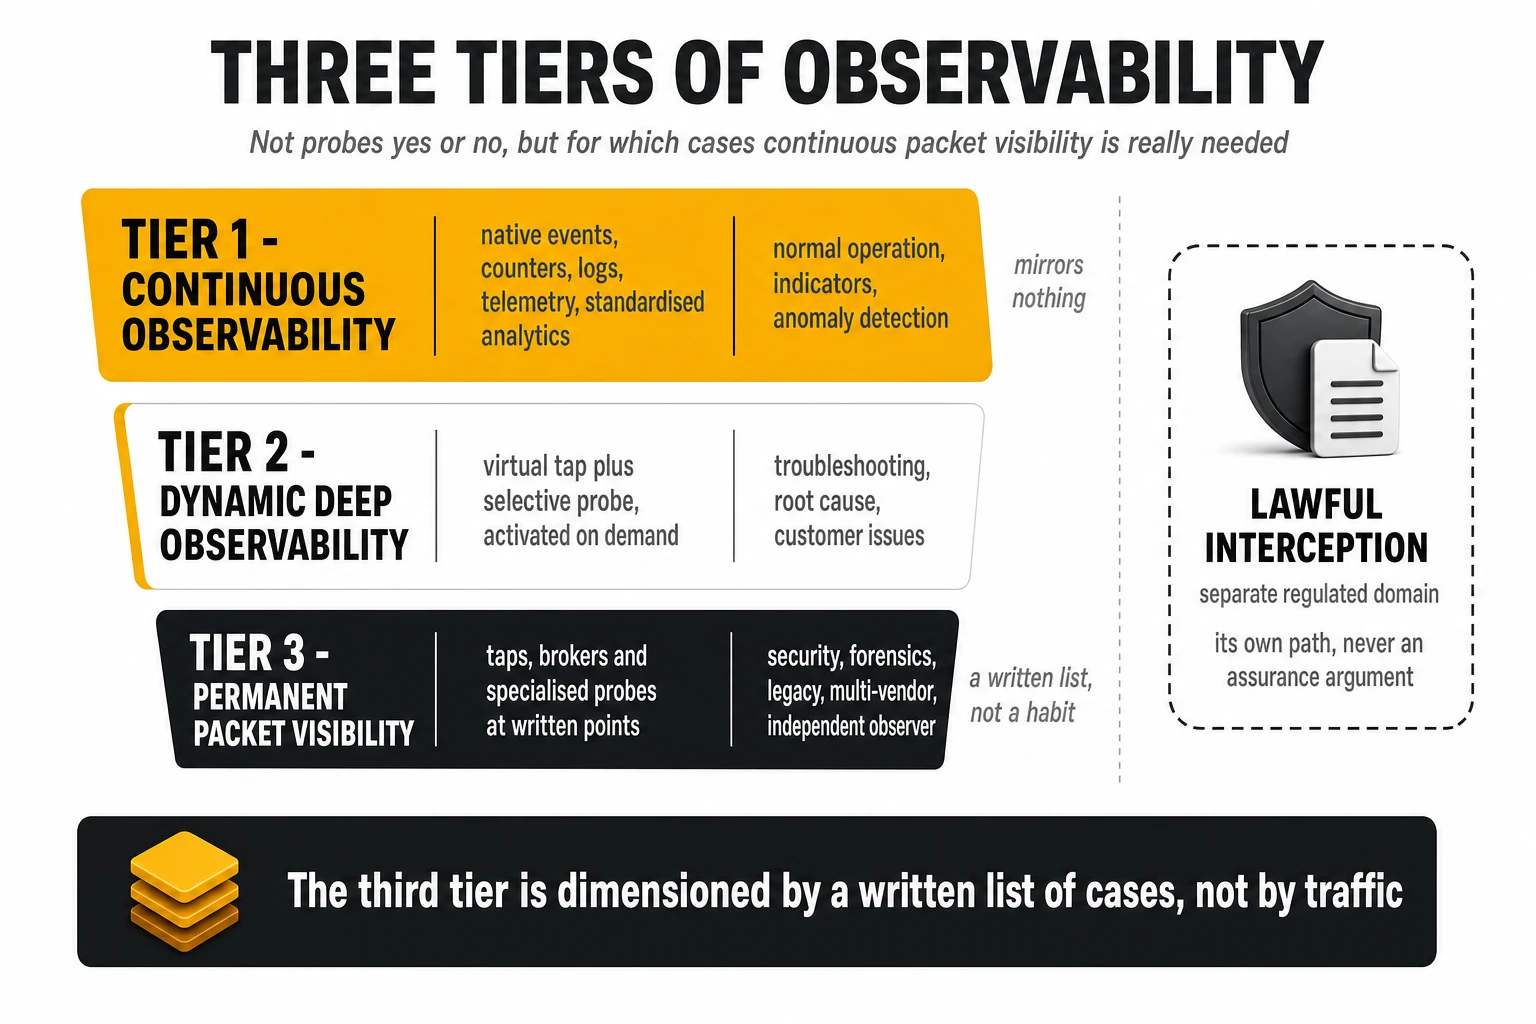
| Tier | Predominant sources | Used for | How it is dimensioned |
|---|---|---|---|
| 1. Continuous observability | Native events, counters, logs, streaming telemetry, standardised analytics | Normal operation, indicators, anomaly detection, most correlation — the fast loop | By the number of functions, not by traffic |
| 2. Dynamic deep observability | Virtual tap plus selective probe or inspection engine, activated on demand | Troubleshooting, root cause analysis, customer issues, inter-vendor disputes — the agentic loop’s evidence requests | By concurrent investigations, with a bounded capture window |
| 3. Permanent packet visibility | Taps, brokers and specialised probes at defined points | Security and forensics, legacy interfaces, multi-vendor evidence, independent observation at critical points | By a written list of cases and points, reviewed yearly |
| Outside the tiers: lawful interception | Points of interception in the functions, mediation and delivery functions | Regulatory obligation, audited against its own architecture | By warrant and regulation; never by assurance needs |
The second tier depends on packet on demand, which is a capability for obtaining evidence and not a remediation mechanism. The loop is simple: 02 detects an anomaly and narrows it to a function, an interface and a set of subscribers; 08 or an engineer decides that more depth is needed; a virtual tap opens on precisely that scope for a bounded window; a probe analyses the packets; the cause is established; the capture closes. The parameters around the loop are what make it work, and the one most often left undefined — what the tap does when the function it must observe is already overloaded — decides whether it works in the incidents that matter.
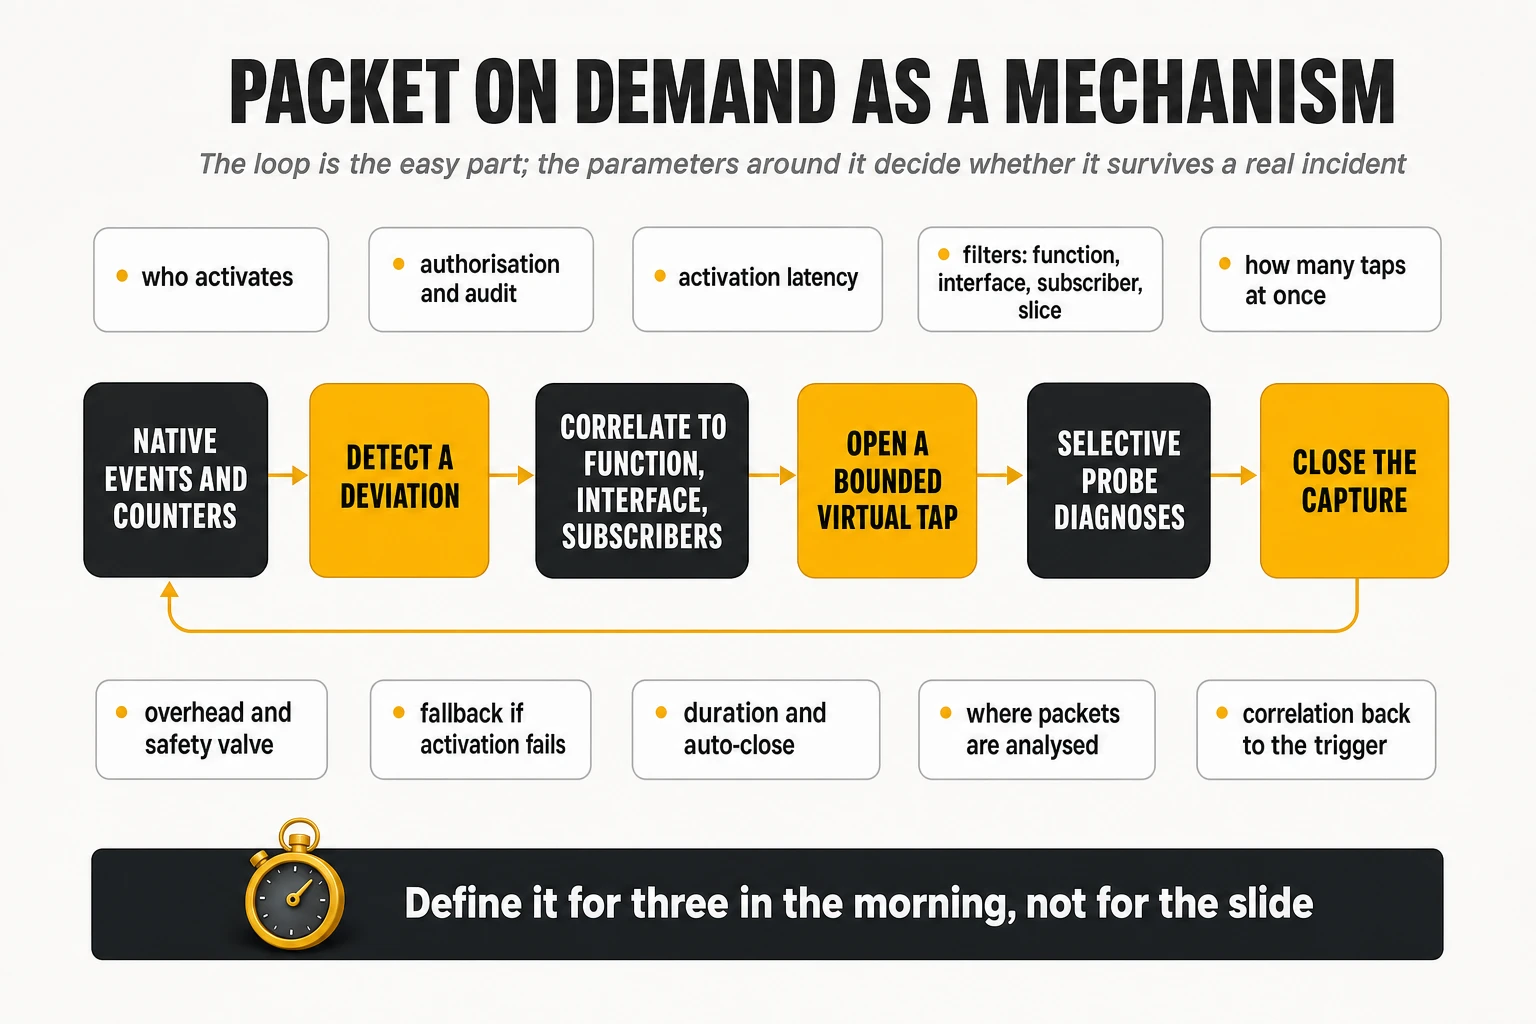
| Parameter | What must be defined | What to measure during coexistence |
|---|---|---|
| Trigger and actor | Automatic activation within policy, manual by on-call, or both; roles allowed | Share of investigations where the tap opened automatically with the right scope |
| Authorisation and audit | Approval path for per-subscriber captures; legal basis; audit trail | Time from request to approval; completeness of the audit record |
| Activation latency | Target from decision to first packet at the analyser | Measured distribution at peak and off-peak |
| Filters | Function, interface, subscriber set, slice, time window; subscriber following across functions | Cases where the needed filter was unavailable |
| Concurrency | Maximum simultaneous taps per function and per estate; queueing behaviour | Peak concurrent investigations and refusals |
| Overhead and safety valve | Export cost on the function; throttling or refusal when the function is overloaded | Function load with capture on; behaviour during an overload incident |
| Failure of activation | Fallback evidence path when the tap cannot be opened | Activation failures and whether the fallback produced a diagnosis |
| Duration and closure | Default window; automatic close; extension rules | Captures still open beyond the window |
| Analysis capacity and location | Where packets are decoded, with which decoders, at what throughput | Analysis backlog during concurrent investigations |
| Correlation to the trigger | Identifiers and time synchronisation linking packets to the triggering event and the incident record | Share of captures joined automatically to their incident |
| Retention and privacy | Masking, retention period, deletion, access control | Captures retained beyond policy; access exceptions |
Lawful interception is taken out of this debate in both directions. It is defined by its own architecture — in a 5G core, 3GPP TS 33.127, with points of interception inside the functions, mediation and delivery functions and an administration function — and audited against that architecture and national regulation. Native events do not satisfy it merely because the same information appears elsewhere; and interception does not require the assurance chain of taps, brokers and probes to be preserved, because the capability is provisioned in the functions and delivered through its own mediation. Where an operator has served it from the assurance probes, that is a deployment choice, and “we have lawful interception” must never become the reason for keeping the whole probe estate.
01.6 QoS, QoE and active tests
Quality-of-service measurements describe what the network delivered; quality-of-experience measurements describe what the customer received. Experience comes from user-plane classification, from application-side analytics specific to a service such as video, and from active tests that measure the service from the terminal side at a known cadence. Service-specific experience platforms are a source for one domain, not a mandatory component for every domain. These measurements are the indicators block 02.5 and block 05 are judged on, which is why they are collected at the source and not derived afterwards.
| Signal | What it answers | What it cannot answer on its own | Who produces it |
|---|---|---|---|
| Native function events | What happened, to whom, why (cause and sub-cause), on which slice | How the element is now; user-plane experience unless the gateway classifies traffic; anything once the function stops exporting | The network function, in a vendor-specific format |
| Performance counters and KPIs | Aggregate behaviour over time; statistical baselines | Which subscriber; the specific failing session | Element management and mediation |
| Alarms | Explicit failures and crossed limits | Slow degradation; cause; impact | Elements, managers, monitors |
| State and streaming telemetry | How the function and its infrastructure are now | Why a procedure failed; the subscriber | Platform and orchestration layers |
| Logs and traces | The internal sequence of a failure | Aggregate impact; the session across functions | The software itself |
| Sessions and packets on demand | Proof of what crossed the interface; protocol-level cause | Continuous coverage of everything; economics at scale | Virtual tap plus a selective probe or inspection engine |
| Permanent packet capture | Independent, forensic and multi-vendor evidence at defined points | Cost that does not grow with traffic; anything encrypted or internal to the function | Taps, brokers and specialised probes |
| Quality of service and experience | What the network delivered and what the customer received | The originating element | User-plane classification; service-specific analytics; active tests |
| Standardised analytics (NWDAF, MDA) | Core-internal insight and prediction on standard inputs | The end-to-end story beyond the core | Core and management planes |
| Topology and inventory | What depends on what; who is affected | Anything about the present moment | OSS, controllers and runtime discovery |
Evolving block 01: from permanent capture to native evidence
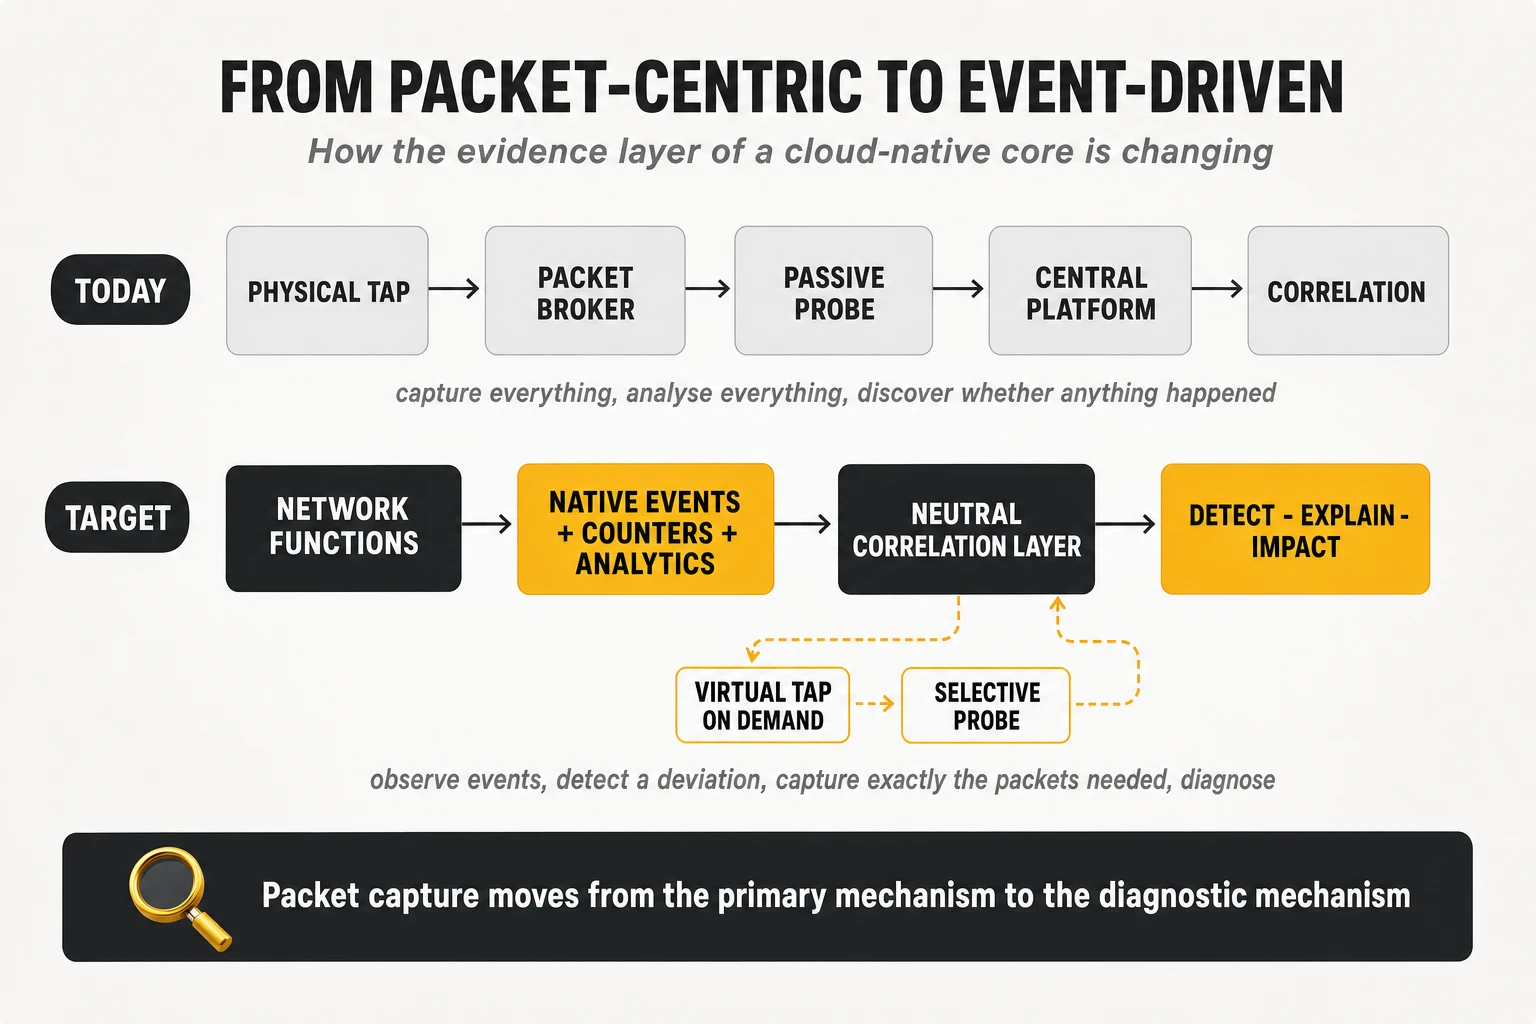
The instrumentation most large operators run was designed for a core made of physical functions on cables — tap, packet broker, passive probe, central platform — and the cloud-native core puts it under five pressures at once. Ericsson’s public account of why it built software probes describes tapping equipment not adapted to cloud orchestration as unsustainable to integrate. None of the five pressures makes probes impossible; together they make permanent capture of everything the wrong default. The table states each pressure, the alternative it points to and the limitation that remains.
| Architectural challenge | Why the traditional model struggles | What changes with cloud-native networks | Alternative instrumentation approach | Remaining limitation or trade-off |
|---|---|---|---|---|
| A. Cost proportional to traffic | Every packet is mirrored, so the tap, broker and probe estate scales with the gigabits per second, the number of user plane functions and edge sites, and every capacity step; the instrumentation bill grows with the traffic rather than with the questions the operator asks of it | Capacity steps are smaller and more frequent, user plane functions multiply towards the edge, and each new site repeats the whole chain; arithmetic that was tolerable for a few central gateways becomes a budget line of its own | Native events and telemetry exported by the functions and consumed by subscription, with packet inspection reserved for investigations and opened on demand. The unit of cost moves from the volume of traffic to the events a consumer has asked for and the processing behind them | Events are not free: the backbone that ingests them, resolves identities and stores them scales with event volume and retention; third-party functions may not export comparable events; and part of the estate remains, so its cost has to be modelled rather than assumed away |
| B. Dynamic infrastructure and elasticity | A tap assumes a stable point where traffic can be copied; functions now scale horizontally, move between nodes and are replaced by rolling upgrades, so a static capture point may be watching an instance that no longer serves traffic, and the probes acquire a second lifecycle that someone has to orchestrate | Kubernetes schedules instances dynamically, service discovery resolves them by name rather than by address, and the addresses are visible only inside the cluster; where the traffic is becomes a runtime decision | Export services embedded in the function, which follow its lifecycle with no orchestration of their own; virtual taps attached to the workload rather than to a port; runtime instrumentation deployed with the pod; and the platform’s own events and service discovery consumed as evidence of what exists now | Instrumentation that lives inside the function shares its fate, so when the function fails outright its export fails with it, which is why the independent-observer points of the three-tier target remain; and runtime instrumentation consumes resources in the pod that have to be budgeted |
| C. Encrypted interfaces | Passive capture reads what crosses the wire; with TLS mandatory on the service-based interfaces and encryption recommended on the user plane, the wire carries ciphertext and the keys live inside the functions | The content of a control plane exchange is observable only where it is decrypted, inside the function or at an authorised termination point; the traditional probe still sees metadata — endpoints, timing, volumes, handshake behaviour — but no longer the procedures and cause codes it used to parse | Three kinds of evidence used deliberately: evidence produced inside the function, where the content is in clear, as events with causes, counters and traces; observable metadata on the wire for timing, volume and reachability; and occasional capture or tracing at authorised points — the function’s own export service or a termination point with key access — under the packet on demand mechanism and its authorisation parameters | Decryption inside the function makes the observed the observer for that evidence; capture at authorised points needs key management and an audit trail; and the heuristics applied to encrypted user-plane traffic, for application identification or quality, are approximations whose coverage has to be validated class by class |
| D. East-west traffic inside Kubernetes | Microservices within a function, and functions within a cluster, exchange traffic over the cluster network that never reaches a physical port; a tap on the uplink sees duplicates of some flows and nothing of others, and dual-mode functions hide interfaces that used to be external | Most of the internal exchange of a cloud-native core is east-west by design, and the fraction of relevant behaviour visible from outside the cluster shrinks with every refactoring | Kernel-level observation with eBPF, which sees sockets and flows at the node without modifying the workload; service mesh telemetry, which records every call between services with latency and status; the platform’s own telemetry; and the function’s internal events exported with metadata | Each source sees a different layer — eBPF sees flows, the mesh sees calls, the function sees procedures — and none of them sees the subscriber unless identity resolution joins them in the backbone; mesh telemetry adds latency and operational complexity, and kernel-level tools need a level of platform access that operators do not always have on vendor-managed clusters |
| E. Vendor dependency and closed interfaces | A full-stack probe platform owns the parsers, the session records, the data model and often the only interface through which subscriber-level evidence leaves the system; the operator’s analytics, correlation and history then live on a format it does not control | The evidence sources multiply — functions, platform, mesh, probes — and an architecture in which each source is readable only through its own vendor’s platform turns the evidence layer into a second lock-in beside the network vendor’s | Open or documented event formats and schemas; export of events and session records to the operator’s own backbone; subscription and retrieval APIs usable by several consumers; standardised analytics as the direction of travel; and contractual control by the operator over its data, its models and the knowledge derived from them | Documented is not standard: every core vendor exports in its own format today, so the operator still owns the normalisation; and an open interface does not transfer the know-how inside the parsers, which remains the vendor’s |
Three distinctions keep the resulting debate honest.
- A virtual tap is not a probe. Whether port mirroring or an export service inside the function, it copies traffic and analyses nothing. A vendor that sells a virtual tap as the elimination of probes, when the result is virtual tap, virtual broker, virtual probe and analytics, has changed little apart from the invoices.
- The broker dematerialises, it does not disappear. Filtering, replication, load balancing, deduplication, masking and multi-consumer delivery remain; they migrate into software, into virtual visibility fabrics or into the function itself.
- The standards are a direction, not a dependency. Ericsson positions its event reporting as the road to NWDAF event exposure; Nokia positions a probeless, multi-vendor NWDAF with edge and central instances. Today every vendor exports in its own format, and the operator owns the normalisation (06.2).
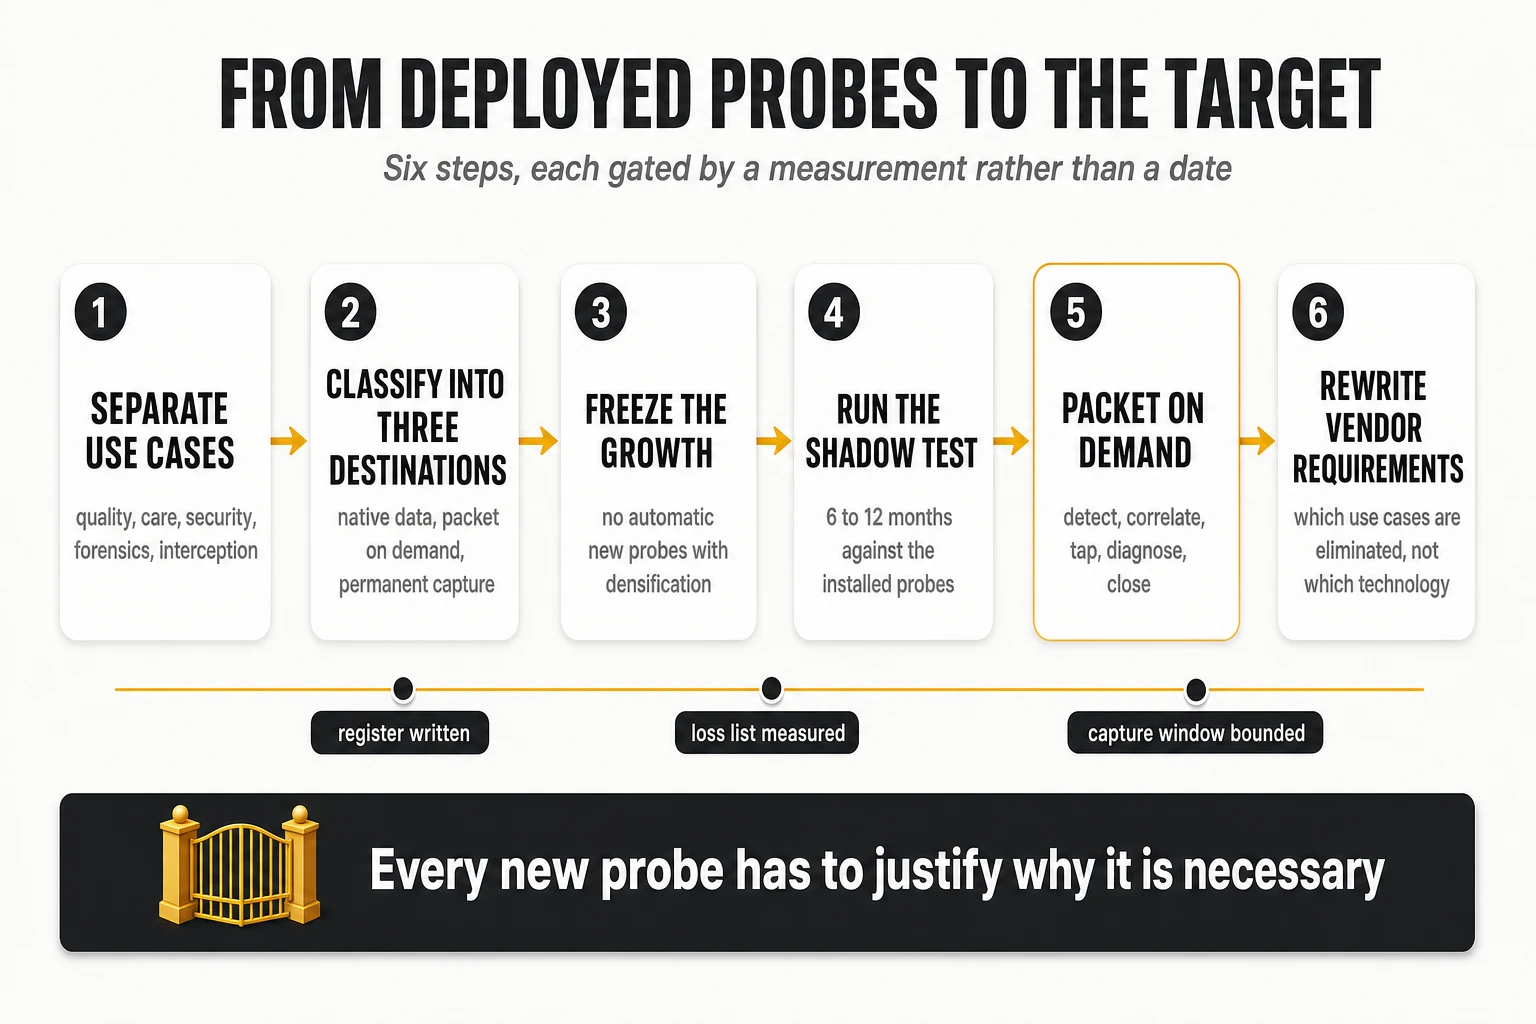
Six steps from an installed probe estate to the target
For an operator with probes already deployed, the evolution is a programme of its own, and it dismantles nothing on day one.
- Register the use cases that share one infrastructure: quality indicators, customer troubleshooting, service experience, capacity, security, forensics, regulatory retention and, where it was deployed that way, interception.
- Classify each into native data, event-triggered packet inspection or permanent visibility: tier one, two or three.
- Freeze the automatic growth of the traditional estate: no new taps, brokers and probes by default with every capacity step.
- Run a coexistence period of six to twelve months in which the candidate architecture runs beside the installed probes, treated as an operational reference baseline (not an infallible one: probes have blind spots too), measuring detection, affected-customer accuracy, root cause, what was lost and gained, multi-vendor behaviour, behaviour when a function fails outright, history and cost.
- Make packet on demand the technical target for assurance, with its parameters measured.
- Rewrite what is asked of vendors: which events with what granularity, context in every record, latency and loss under load, export-health monitoring, open data model, control-to-user-plane correlation, export to the operator’s backbone, a dynamic tap with an activation service level — and above all which current use cases each cannot resolve without a probe.
The deliverable that decides the transition is a matrix with one row per indicator or question that today comes out of a probe: its current source, its proposed future source, granularity and history, whether subscriber context survives, and the gap that remains, written as a fact. The gates are measurements — rows with a closed gap, indicator equivalence within tolerance, event latency and loss under load, affected-customer precision, the share of incidents resolved without a packet, tap activation latency and success under overload, third-party function coverage, cost per unit of traffic and per function — with thresholds set from the operator’s baseline rather than from a vendor presentation.
| Indicator or case today | Current source | Proposed future source | Granularity and history | Subscriber context | Gap to close |
|---|---|---|---|---|---|
| PDU session establishment success and failure causes | Probe on the session management interfaces | Session management function events with cause and sub-cause | Per procedure, streamed; history as retained by the backbone | Kept (subscriber, slice, location) | Third-party core functions have no equivalent event; keep probe or accept counters there |
| Registration and mobility failures by cause | Probe on the access-side control plane | Access and mobility management function events, by procedure and cause | Per procedure | Kept (identity and mobility procedure) | Cross-vendor handover: core events see only the consequence; needs the radio side’s view correlated by identity and time |
| PFCP health between session management and user plane | Probe on N4 | Counters from both functions plus peer cross-check; virtual tap on N4 on demand | Counters per minute; packets only during investigation | Counters lose it; tap restores it | Define the trigger that opens the tap |
| Voice call setup time and speech quality | Probes on IMS and border gateways | Border gateway events plus IMS counters; probe kept on interconnect | Per call for events; per-minute for counters | Kept for own subscribers; partial on interconnect | Interconnect stays in tier three |
| TCP throughput, round-trip time and loss per application | User-plane probe with classification | Gateway usage events with application identification | Flow-level transport metrics; one vendor’s material describes five-second metrics in one-minute reports — an advertised capability of that product, to be verified, not a property of every solution | Kept | Validate classification parity against the probe’s; check the heuristics used on encrypted traffic |
| Video quality (buffering, stalls, bitrate) | User-plane probe with video heuristics | Gateway inspection or classification reused from charging, with usage events and service-specific experience analytics where they exist | Per session or per flow, as actually supported by the source | Kept | Heuristic coverage is not equivalent between solutions: compare class by class; application identification, encryption and the availability of experience metrics bound the result |
| Roaming and interconnect signalling | Probes on the interconnect edge | Permanent capture retained | Unchanged | Unchanged | None: independent evidence at a boundary the operator does not control |
| DNS failures affecting browsing | Probe on the internet-facing interface | Resolver logs and counters, correlated with sessions; virtual tap on demand | Per query in logs, or time aggregates, depending on the source | Partial; needs the join to the session | Join resolver logs to subscriber sessions and services in the backbone: a DNS error without user context is an event, not an impact |
| Enterprise slice service level per customer | Probe KPIs filtered by slice | Function events and usage events filtered by slice and customer type | Per session, per five minutes | Kept | Customer-within-slice needs the service inventory join |
| Subscriber trace for a complaint | Probe session trace | Event trail across functions; virtual tap on the subscriber on demand | Event trail always; packets when opened | Kept | Activation latency and authorisation for per-subscriber taps |
| Security anomaly on the internet edge | Permanent capture and flow records | Permanent capture retained where the forensic case requires it; flow telemetry added for enrichment | As the forensic case and the source require | Not always required | None by design: tier three, because forensic evidence must exist before anyone knows it is needed; not a candidate for capture on demand |
| Loss of observability itself | Probe keeps seeing traffic when a function is silent | Export-health monitoring plus independent observation at aggregation points | Continuous | Not required | Define the points and the alarm for a silent export |
Four rows show how a future source can look equivalent on paper and fall short in practice. Registration and mobility: the core sees a cross-vendor handover failure only as its consequence; reconstructing it needs the radio side’s view, joined by identity and time in 06. Video quality: the gateway’s classification reports buffering, stalls and bitrate for some traffic classes and not others; application identification over encrypted traffic is a heuristic, and the comparison with the probe is made class by class. DNS: resolver logs show every failed query, but a DNS error without user context is an event, not an impact, until 06.2 joins it to the session. Security on the internet edge: forensic evidence must exist before anyone knows it will be needed, which is the one property capture on demand cannot provide, so the row stays in tier three.
The transport-metrics row carries the article’s general rule in miniature: a capability a vendor advertises is a hypothesis to test, not a property of the market. One vendor’s material describes per-flow TCP metrics at five-second granularity in one-minute reports from its gateway’s usage events. The figure is useful precisely because it is specific — it describes what that product is designed to do and nothing about any other — and it has to be verified against the installed probe’s classification before the probe is retired. A matrix filled in from vendor presentations is a wish list; a matrix filled in from the coexistence period is the deliverable.
Six strategic commitments for evolving the observability estate
Condensed for a management committee, the transformation of block 01 is six commitments and three conditions, and none of the commitments is to retire the probes. The strategic effect is that every new probe has to justify why it is necessary: where native data resolves the case, no probe; where packet data is occasionally needed, a virtual tap and packet on demand; where continuous capture is required, it is kept and written down. That position neither buys the vendors’ optimism unverified nor freezes the architecture because probes have always been there, and it avoids the meeting, five years from now, at which the operator has twice the traffic, twice the probes and no memory of how it happened. The general roadmap of section 10 sequences the whole operating model; this list concerns only the evidence layer.
| Commitment or condition | What it means in practice | What it does not mean |
|---|---|---|
| 1. Keep a neutral data and correlation backbone, controlled by the operator | Every source — probes, native events, telemetry, platform data — lands in a backbone the operator owns, with resolved identities and an open data model, so that analysis is not captive to any one producer | That the backbone is the brain: the platform that reasons and correlates is a separate decision (section 4.6) |
| 2. Prioritise native events, telemetry and standardised analytics as the predominant sources | New assurance use cases are designed on function events and telemetry first; the probe is the exception that a row of the matrix justifies | That native events are sufficient everywhere: third-party functions, boundaries and the independent-observer points are the written exceptions |
| 3. Convert packet inspection progressively into a selective, on-demand capability | Packet on demand defined as an operational mechanism with its parameters measured — activation, filters, concurrency, overload behaviour, authorisation, retention | That permanent capture disappears: it becomes the third tier, not nothing |
| 4. Keep permanent capture where it is really justified | A written list of the points that need continuous, independent evidence — interconnect and roaming, security and forensics, legacy and multi-vendor interfaces, observer points — reviewed when the architecture changes | That the list is the current probe map: it is what survives the case-by-case review |
| 5. Stop the automatic growth of taps, brokers and probes | No new tap, broker or probe by default with a capacity step or a new site; each addition is a decision against the matrix, not a line in the bill of materials | That no probe is ever bought again: a row with an unresolved gap buys one |
| 6. Validate case by case before retiring anything | Row by row, against the installed probes treated as an operational reference baseline during the coexistence period, with the gates expressed as measurements | That the migration waits for every row: rows close at different times, and retirements follow the rows |
| Condition A. Lawful interception follows a separate regulatory architecture | Interception has its own points of interception inside the functions and its own mediation under its own standards; it is never an argument for assurance instrumentation | That the two estates cannot share infrastructure where regulation allows it; only that they are decided separately |
| Condition B. Standardised analytics are a direction, not a precondition | The plan follows NWDAF, management data analytics and the exposure services as they mature, and consumes vendor events in their own formats meanwhile | That the operator waits for standardisation before migrating a single row |
| Condition C. The backbone and the reasoning platform are different decisions | The existing data platform’s candidacy to be the brain is decided on evidence — the backbone-versus-brain test — separately from its role as the backbone | That the platform already in place is automatically either |
4.2 — 02 UNDERSTAND: intelligence and diagnosis
Block 02 turns evidence into an understood situation, and it answers four questions that the market sells under one word: what deviates, what belongs together, what probably caused it, and whom it affects. Its five capabilities run continuously as the fast loop, on streams and in-memory state, with no language model per signal. What it hands to the agentic layer (08) is a structured situation with hypotheses and confidence, never raw data.
02.1 Anomaly detection
There are six ways to notice that a network has deviated. Adopt them in this order, and keep every layer working underneath the next.
- Static rules and thresholds catch hard binary failures perfectly and everything else badly. They never disappear and must never be the only layer.
- Statistical baselining compares a value with what this element normally does at this time: robust z-score against median and median absolute deviation over seasonal windows, exponentially weighted moving averages for dynamic bands, seasonal decomposition, and sequential change detection for the permanent forty-millisecond step that stays inside every threshold. The NIST engineering statistics handbook documents why cumulative-sum methods detect small sustained shifts a control chart misses. A user plane function that normally runs at 28% load at four on a Sunday morning, with a deviation of about five points, is seven deviations from normal at 62%, and no static threshold would notice.
- Complex event processing recognises a significant combination or sequence of native events as soon as the evidence arrives; codebook correlation matches the symptom vector against precomputed fault signatures.
- Multivariate and relational learning asks whether an entity behaves unusually given everything around it: joint-behaviour models, peer comparison across equivalent functions, graph neural networks that learn from the topology itself.
- Service-level burn-rate alerting defines the indicator the customer experiences, sets an objective and alerts on the rate at which the error budget is consumed, so that a silent degradation inside every threshold still surfaces. Developed under 02.2.
- Generative and agentic reasoning is not a detector. It interprets results, requests analyses and investigates (08). An architecture that leads with it produces excellent summaries of incidents it noticed late.
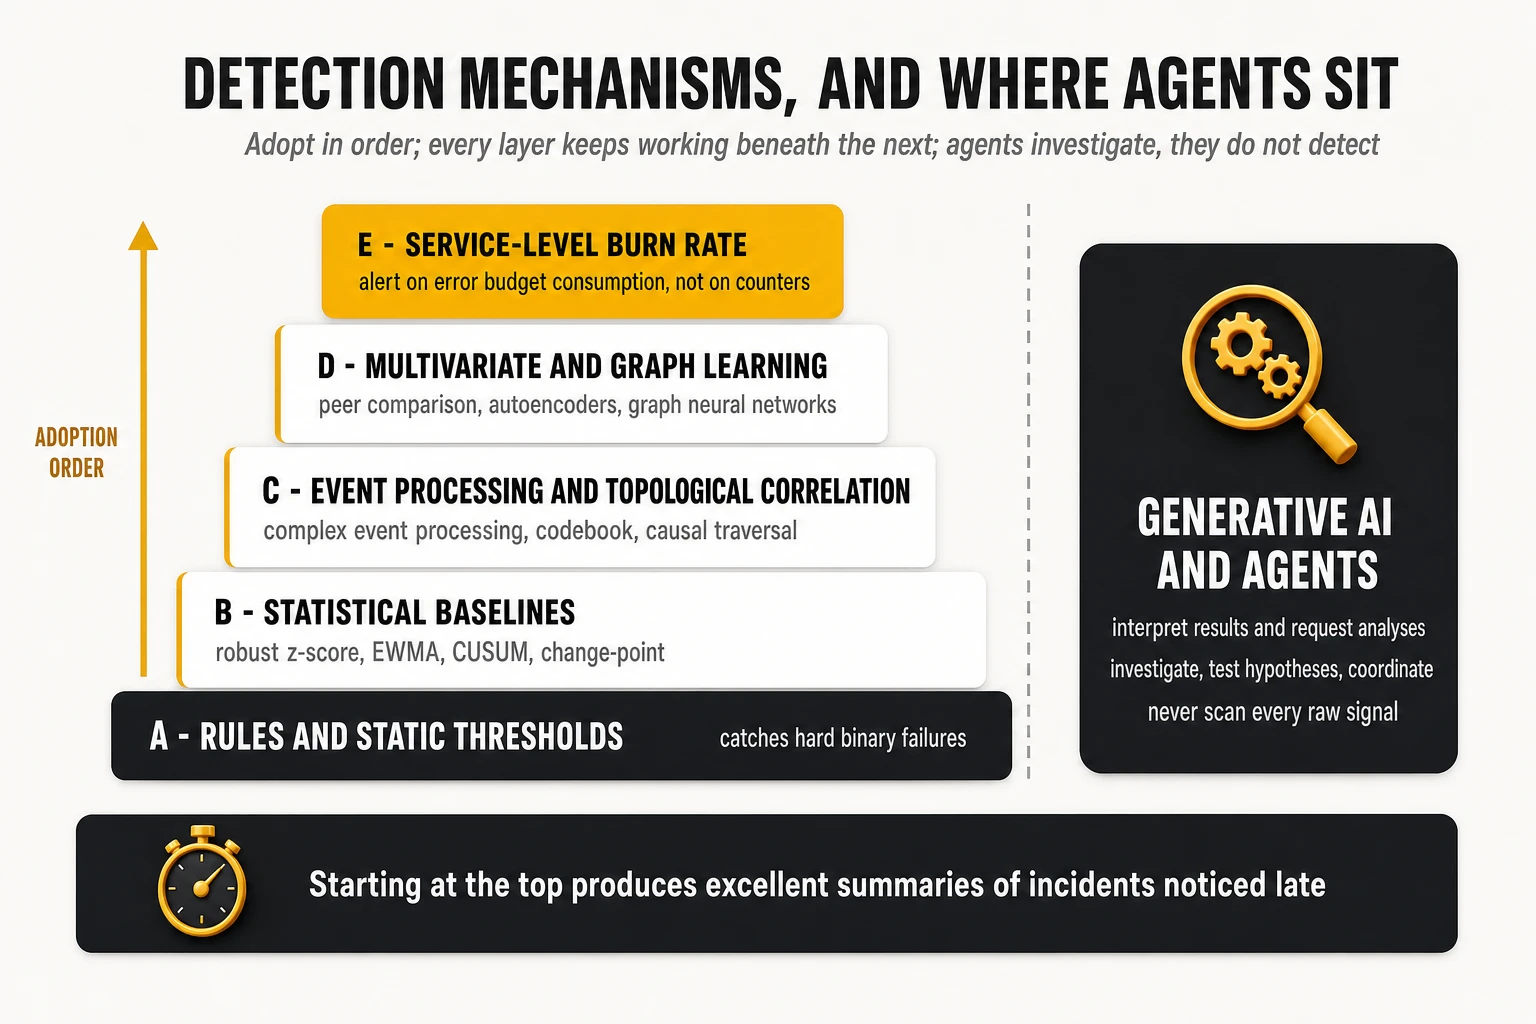
| Failure class | Typical example | Mechanism that catches it | Mechanism that misses it |
|---|---|---|---|
| Hard binary failure | Link down, card failure, process stopped | A — rules, in milliseconds | None, and nothing else is needed |
| Contextual anomaly | 62% CPU on a Sunday at 04:00 against a 28% baseline | B — seasonal robust z-score | A — the value is inside every threshold |
| Structural break | Permanent +40 ms after a reroute, still within limits | B — change-point detection | A and most baselines with long windows |
| Alarm storm from one cause | 5,000 events from one optical span cut | C — topological correlation | B — produces 5,000 anomalies instead |
| Joint-behaviour anomaly | Counter combination never seen, each counter normal | D — multivariate models | A, B and C |
| Peer deviation | One user plane function unlike its cluster | D — behavioural clustering | B — consistent with its own history |
| Propagating relational fault | Degradation explained by a two-hop neighbour | D — graph neural networks | B, and C when the path is not modelled |
| Silent service degradation | Enterprise slice missing latency target in business hours | E — burn-rate on the objective | A to D, which see nothing abnormal per element |
| Explanation and triage load | 40 minutes of evidence gathering per incident | F — grounded agents | All of the above, which detect but do not explain |
Three cautions stop this from being oversold as instant detection.
- Statistical confirmation replaces a fixed persistence timer, not the need for evidence: a sequential algorithm still needs enough observations to reach a reasonable confidence.
- Granularity bounds latency: if indicators arrive every fifteen minutes, no engine and no agent can see at ten seconds a deviation that is not observable until the next report. That is why 01 matters as much as the analytics above it.
- History stays essential for baselines, training and forensics, but it need not sit in the critical path, which runs on streams and in-memory state (06).
| Mechanism | What it allows the operator to detect | How it reduces the wait |
|---|---|---|
| Alarms and thresholds | Explicit failures, unavailability and operating limits | Immediate firing where the condition is unambiguous |
| Indicators with dynamic baselines | Deviations in latency, accessibility or quality from expected behaviour | No need to cross the traditional fixed threshold |
| Cumulative sum, EWMA and change-point detection | Small sustained changes or statistical breaks | Accumulates evidence progressively, without imposing a fixed persistence |
| Native events and complex event processing | Error patterns, session failures, sequences of events | Recognises a combination of events as they arrive |
| Multivariate analytics and peer comparison | Abnormal behaviour that no single indicator shows | Confirms the anomaly through relationships between signals |
| Service-level indicators and burn rate | Degradations perceptible to the customer | Adjusts the response to severity and to error-budget consumption |
| Graph analytics | Anomalies related through network or service dependencies | Identifies symptoms, common elements and probable causes at once |
02.2 Degradation prediction
Prediction asks when, not whether: when a trend exhausts a capacity, when a drift crosses a commitment, when an error budget runs out. Forecasting on counters and indicators handles the first two with standard time-series methods. The third is the one that changes operations, because it turns a technical deviation into a dated contractual risk, and it is worth a worked example.
Take a service committed to 99.9% availability over a rolling thirty days, measured on an indicator the customer experiences, such as the share of session establishments that succeed within the agreed time. The figures below are illustrative, not thresholds to adopt unexamined.
- Thirty days contain 43,200 minutes, so the error budget is 43.2 minutes of equivalent unavailability, or one failed session in every thousand across the month. The sustainable burn rate is one.
- The session success rate drifts from 99.95% to 99.4% on one slice, with the user plane function at 82% load and every resource indicator inside its threshold. The error rate is now 0.6%, six times the sustainable rate: the monthly budget is gone in five days.
- At 1.5% errors (fifteen times) the budget is gone in two days; at 0.2% (twice), a degradation most dashboards would not show, in fifteen days. Nothing in the resource layer has crossed a line; the contract is being consumed at a rate nobody has noticed.
Burn-rate alerting turns that arithmetic into detection, and the Google SRE workbook arrived at its design after trying the simpler alternatives. The indicator is one the customer experiences, not a resource counter. The alert fires on the rate of budget consumption, not on the level of the indicator, so one rule covers a brief severe failure and a long mild one. Several windows are combined: a fast-burn rule — illustrated in earlier versions of this analysis at fifteen times the sustainable rate over an hour — catches the degradation that will exhaust the month in two days and deserves a page; a slow-burn rule at twice the rate over a day or more catches the one that will exhaust it in two weeks and deserves a ticket and a place on the next change review. Each long window is paired with a short confirmation window so the alert clears when the burn stops. The workbook’s own table pairs windows and rates differently (roughly fourteen times over an hour, six over six hours, once over three days); the point is the method, not the values: thresholds derived from the objective and tuned on the operator’s own incidents.
Detecting a technical deviation and detecting a contractual degradation are not the same task, and the architecture does both. The baselines of 02.1 find the deviation in the function minutes before the burn rate moves; the burn rate then says whether it matters, to whom and how urgently, which is the priority input 03.1 needs and the customer list 02.5 refines. An operator that alerts only on burn rate learns late about causes; one that alerts only on deviations is told about every change and nothing about commitments.
02.3 Technical and topological correlation
Correlation decides that rising load on one function, retransmissions on its control interface, failures on the sessions it serves and complaints from the customers behind them are one situation rather than four. It uses time, context, configuration and above all topology, and its output is a situation with a set of related symptoms and candidate common elements. Two boundaries matter:
- Statistical correlation is not causality. That two indicators move together says that they move together. Only the dependency model (07), the chronology and the mechanism say that one causes the other. A correlation engine without a current topology correlates confidently against a network that has changed shape.
- Technical correlation (02.3) is not event intelligence (03.1). This capability determines which symptoms may share a cause. Event intelligence decides which alerts are consolidated, suppressed and turned into work. The causal engine’s output is one of the best inputs event intelligence can have, and the two are bought twice when the boundary is not drawn.
02.4 Root cause with hypotheses and confidence
Root cause analysis identifies the probable originating fault from evidence, relationships and models. It walks the dependency chain upward from the symptoms, weighs the chronology, the changes, the signalling evidence and the behaviour of related and peer components, and produces not a name but a ranked set of hypotheses, each with the evidence for it, the evidence against it and a confidence that is updated as the investigation proceeds. Root cause is not binary: an engine that outputs a single cause with no confidence and no alternatives is hiding the state of its own reasoning, and the response it triggers will be wrong exactly as often as the engine is. Causal engines that traverse a discovered topology against the event timeline are explainable, and their quality is entirely dependent on the model in 07.
02.5 Service, customer and SLA impact
Impact analysis walks the chain downward, from the candidate element to sessions, services, customers and commitments, and expresses the result in the terms the response needs: these slices, these enterprise customers, this service-level agreement. It runs in parallel with 02.4, not after it, because it serves a different consumer at a different moment: the response (03) needs the impact immediately to prioritise, route and inform, and can work with a provisional cause; the action (04) needs the cause confirmed and can wait for the investigation. An architecture that serialises them has built the sequence the wrong way round. The list of affected customers that this capability produces is also the list that 05.2 must confirm as recovered.
4.3 — 03 RESPOND: operational management and coordination
Block 03 is where a diagnosed situation becomes work that somebody owns, and it is the block most assurance architectures leave to the operations centre’s own devices. It has three capabilities that must not be confused: event intelligence manages and enriches signals; incident response mobilises, escalates and coordinates; ITSM holds the master record. Their absence is why operations centres still drown in alerts after buying excellent analytics.
03.1 Event intelligence
Event intelligence receives alerts from every engine, monitor and domain and makes them manageable. It deduplicates, suppresses, reduces noise, groups related alerts into one incident candidate, enriches the candidate with service, customer, owner, change, runbook and history, prioritises by real impact and commitments rather than by the originating monitor’s severity field, and routes to the team that owns the affected service. The table names its ten functions and what each needs from the other categories.
| Function | What it does | What it needs from other blocks | Failure mode when it is missing |
|---|---|---|---|
| Deduplication | One condition reported by several monitors becomes one alert | Entity identity from the backbone | The same problem worked three times by three teams |
| Suppression | Expected, downstream or already-known conditions do not reach a human | Maintenance calendar; incident state; topology | Engineers paged for consequences of an incident already in hand |
| Noise reduction | Flapping and never-actioned patterns are collapsed or learned away | History of alerts and outcomes | Alert fatigue; real signals ignored |
| Grouping | Related alerts form one incident candidate | Correlation results; dependency model; time windows | Forty tickets for one fault |
| Enrichment | Service, customer, owner, change, runbook and history attached | Service model; ITSM; change management; knowledge base | The responder spends the first hour finding context |
| Prioritisation | Ordering by impact and commitments, not by monitor severity | Impact analysis; service levels | A critical enterprise degradation queued behind a lab alarm |
| Service-aware routing and on-call | The incident reaches the owner of the affected service, now | Service ownership; rotations | Routed to the element’s team, who are not the service’s team |
| Escalation policies | Timers and conditions that widen the response | Priority; acknowledgement state; impact growth | An unacknowledged incident ages silently |
| Response workflows | The steps the incident class requires, executed consistently | Incident class; policy | Every incident handled differently; no audit |
| Supplier and partner coordination | Engagement through agreed interfaces, with identifiers and context | Supplier contracts; integration | Phone calls and emails as the escalation mechanism |
Two kinds of AIOps live on either side of this capability, and a platform excellent at one is not thereby competent at the other. Alert-management AIOps (03.1) learns which alerts belong together, which are noise and where they should go; its intelligence is statistical and behavioural, over whatever topology it was given. Causal AIOps (02.3 and 02.4) reasons over a dependency model to name an originating element with evidence and confidence; its model has to be current and traversable. They are complementary, and the overlap between them is where operators most often buy two tools for one job (section 5).
03.2 Incident response
Incident response is the live minutes of an incident: the owner, the on-call rotation, the page, the bridge, the escalation, the communication and the coordination across teams and suppliers. Its functions are concrete:
- Opening and assignment: the incident is opened on a grouped and enriched situation, before the cause is confirmed, and assigned to the owner of the affected service.
- On-call and escalation: who is responsible at this hour; what happens when nobody acknowledges within a timer or when the impact grows; technical escalation to a specialist team and functional escalation to management.
- Communication: status to stakeholders, the enterprise desk and customer care, drafted from the record and, increasingly, by agents (08.4).
- Coordination across teams, suppliers and partners: an incident on a managed component or a wholesale service reaches the supplier through an agreed interface, with the operator’s identifier and context attached, and its progress comes back.
- Response workflows: the steps an incident class requires — notify, assemble, bridge, inform — executed consistently and audited.
The incident response system does not have to be the master ITSM system, and in many operators it should not be. The response platform is optimised for the live minutes; the ITSM platform for the authoritative life cycle, the service levels, the relationships to problems and changes, and the reporting. Either can be the master. What cannot happen is that both believe they are: the architecture names the master, defines which fields each system owns, and synchronises identifier, state, priority and assignment within seconds, with a rule for who wins when they disagree.
03.3 ITSM and the master record
The incident record is the one artefact every block, every team and every supplier must agree on, and the capability that owns it is IT service management, whether on a commercial platform or on the operator’s own system. It holds the unique identifier that every other system mirrors — the alert group in 03.1, the situation in 02.3, the capture in 01.5, the change in 04.2, the automation run in 04.4, the problem record that may follow. It manages states and the service-level clocks attached to them. It holds the relationships between events, incidents, problems and changes, which is where the transitions of section 2 are implemented. It records resolution, closure code, confirmed cause and actions, with the traceability that audit and problem management require. And it synchronises with the other platforms in both directions, because an incident whose state differs between two systems is an incident nobody owns.
| What the master incident record must hold | Where it comes from | Why it matters downstream |
|---|---|---|
| Unique identifier, mirrored in every other system | ITSM, at creation | Traceability from alert to closure; cross-system correlation |
| Affected services, customers and commitments | Impact analysis over the service model | Priority, routing, customer communication, service-level clocks |
| Probable cause with confidence and alternatives | Correlation and root cause engines; agents | What the responder should trust and what to test next |
| Evidence references | Backbone, captures, dashboards | The engineer and the agent start from the evidence, not from a summary |
| Related changes | Change management | The most likely cause of a degradation that began an hour ago |
| Assignment, state and timestamps | ITSM and incident response, synchronised | Service levels; escalation; who owns it now |
| Actions taken and their results | Automation and execution systems | Rollback; audit; learning |
| Verification results | Assurance and observability engines | The only legitimate basis for closure |
| Closure code, confirmed cause, problem link | Responder and ITSM | Problem management; recurrence analysis; model updates |
The operator’s own operational systems belong here according to the functions they verifiably perform. Internal tools that hold service information, customer context and work management in many large operators should be represented by what they actually do, not assumed to hold a complete resource-to-service-to-customer chain because they are called a configuration management database. It is better to keep an internal system as master and synchronise the modern platforms to it than to run two masters, provided the identifiers, states and relationships above can be mirrored.
4.4 — 04 ACT: automation and remediation
Block 04 converts an authorised decision into a safe change in the network or the platform, and it has to separate three things the market bundles: deciding what to do, coordinating who does it, and technically executing it. Deciding is the output of 02, 08 and the humans: a selected action with its expected effect, its risk class and its rollback. Coordinating is 03’s job: the ticket, the owner, the approval, the communication, the supplier. Executing is this block: turning the decision into a change through the systems that actually hold the interfaces. Every execution is a change, recorded as such, even when it ran in seconds.
04.1 Action selection and risk evaluation
An action is chosen from runbooks, recommendations or expert judgement, and classified by risk before anything else happens. The risk assessment considers the blast radius from the dependency model (07.5), the moment — a change window, a peak hour, a major event — and the measured history of the action. Five classes cover almost everything, and autonomy is extended class by class as the measured success rate justifies it, never for the platform as a whole.
| Action class | Examples | Authorisation | Execution controls |
|---|---|---|---|
| Diagnostic | Collect logs, run a test, open a bounded capture, compare with peers | Automatic within policy | Read-only or bounded; overhead limits; audit |
| Low-risk mitigation | Move sessions away from a degraded instance; restart a stateless function; clear a queue | Pre-approved per incident class once precision is measured | Pre-checks; post-checks; automatic rollback; blast-radius limit |
| Configuration change | Adjust a parameter, a routing policy, a capacity limit | Named approver, or pre-approved for a narrow set | Change record; window check; rollback plan; post-check against service indicators |
| Structural change | Failover of a site; reconfiguration across domains; vendor software action | Human decision; incident commander; possibly supplier | Coordinated execution; staged; verification at each stage |
| Forbidden to automation | Actions on lawful-interception, billing or safety-critical elements; actions during defined events | Human only | Automation refuses and escalates |
04.2 Approvals and change management
Authorisation is a gate, and it lives outside the agent and outside the executor. The policy that decides whether an action of this class, on this element, at this moment, may run now is held and evaluated in 09.2; the approval, where a human is required, is recorded in the change record of 03.3; and the executor refuses, throttles or escalates when the policy says so. Some actions are pre-approved for a defined incident class once their precision is measured; others need a named approver; others are forbidden to automation altogether. The change record is also where a remediation meets the deliberate changes of the network, so that a degradation that began shortly after a change can be related to it automatically.
04.3 End-to-end orchestration
Orchestration chains steps across systems — a pre-check on one, a change on another, a verification on a third — and respects that the systems differ by domain. Runbook automation executes documented procedures as versioned, auditable workflows triggered from an incident or by a rule. Workflow engines chain steps across tools. Network automation and domain orchestrators hold the controlled interfaces into specific domains — the mobile core’s orchestration layer, the IP controllers, the transport controllers, the cloud platform’s APIs — and general-purpose automation tools do not replace them, because the domain orchestrator is where the model of the domain, the safety checks and the vendor interfaces live. An enterprise service may need three domain orchestrators in sequence; the end-to-end orchestrator is what sequences them.
04.4 Execution with pre-checks, post-checks and rollback
Every execution follows the same fixed sequence.
- Pre-checks confirm that the target is in the expected state and that the action’s preconditions hold: peer capacity, path health, no concurrent change on the same elements.
- The change itself, through the authorised interface and nothing else.
- Post-checks confirm that the change took effect as intended, at the component level.
- Rollback or fallback, prepared before the change and executed automatically when the post-checks fail.
- The record: every step written to the incident and change records with its result, so that 05 can verify and 09.3 can audit.
Post-checks confirm that the action executed. They do not confirm that the service recovered; that is block 05, and the difference is the subject of the next subsection.
4.5 — 05 VERIFY AND LEARN: verification and improvement
A technical action that executed correctly proves nothing about the service, and block 05 is the capability that establishes the difference — the one most often left to a human glance at a dashboard. The incident closes on six checks or on none; when a check fails, the block triggers rollback where the action caused harm, reopens the investigation where it merely failed to help, and hands control to a human when the policy says so.
05.1 Technical and QoE recovery verification
Three of the six checks are technical and experiential. The intervened component is in the state the action intended. The service indicators and objectives — session establishment, latency, loss, the service-level indicators — are back within their expected bands, judged by the same baselines that detected the degradation rather than by a static threshold. And the customer-facing measurements of quality of service and experience have recovered, not only the resource counters.
05.2 Affected-customer validation and side effects
The other three checks are about scope. The services and customers that 02.5 named are confirmed recovered, slice by slice and customer by customer where commitments require it. The detection engines, asked explicitly after the action, report no new side effects elsewhere. And the action’s own stated goal is fulfilled: an action that moved sessions away from an instance has succeeded only if the sessions are now served well elsewhere.
| Verification check | Source of truth | What a failure triggers |
|---|---|---|
| Component state matches the action’s intent | Post-checks from the executing system; platform telemetry | Rollback; investigation reopened |
| Service indicators and objectives within expected bands | The same baselines that detected the degradation | Investigation reopened with the action’s evidence |
| Quality of service and experience recovered | Customer-facing measurements; active tests | Investigation reopened; customer communication held |
| Affected services and customers confirmed recovered | The impact list, item by item | Partial closure refused; remaining items reassigned |
| No new side effects | Detection engines, asked explicitly after the action | Rollback; new incident if needed |
| Action goal fulfilled | The action’s own stated success criteria | Alternative action or human takeover |
05.3 Validated closure and post-incident analysis
Closure is a rule in the record, not a button. The ITSM closure rule refuses closure until the six checks are recorded, completes the record with the confirmed cause, the timeline, the actions and the verification, and links a problem record when the cause is structural or recurrent. The post-incident analysis, run with the engineers and increasingly drafted by agents from the record, asks one question above all: what did the system know, and when? That is the question that shortens the next detection.
05.4 Learning: models, baselines, runbooks
Learning has concrete outputs, and an operator that does not produce them has a system that resolves incidents and never improves.
- The knowledge base (08.2) receives the pattern, the runbook that worked and the one that did not, in a form the agents can retrieve next time.
- The detection models (02.1) receive the incident as a labelled example: the baselines that should have caught it earlier, the rules that fired falsely, the persistence that delayed it.
- The correlation and grouping rules (02.3, 03.1) receive the groupings that were right and wrong.
- The runbooks (04.3) are updated and their pre-approval status (09.2) is reviewed against the measured success rate of the class.
- Problem management (03.3) takes structural causes forward into changes with the normal controls.
Three measurements tell whether the block works: recurrence per cause, time from closure to model update, and the share of incidents with a completed record. This is where most of the long-term reduction in degradation comes from.
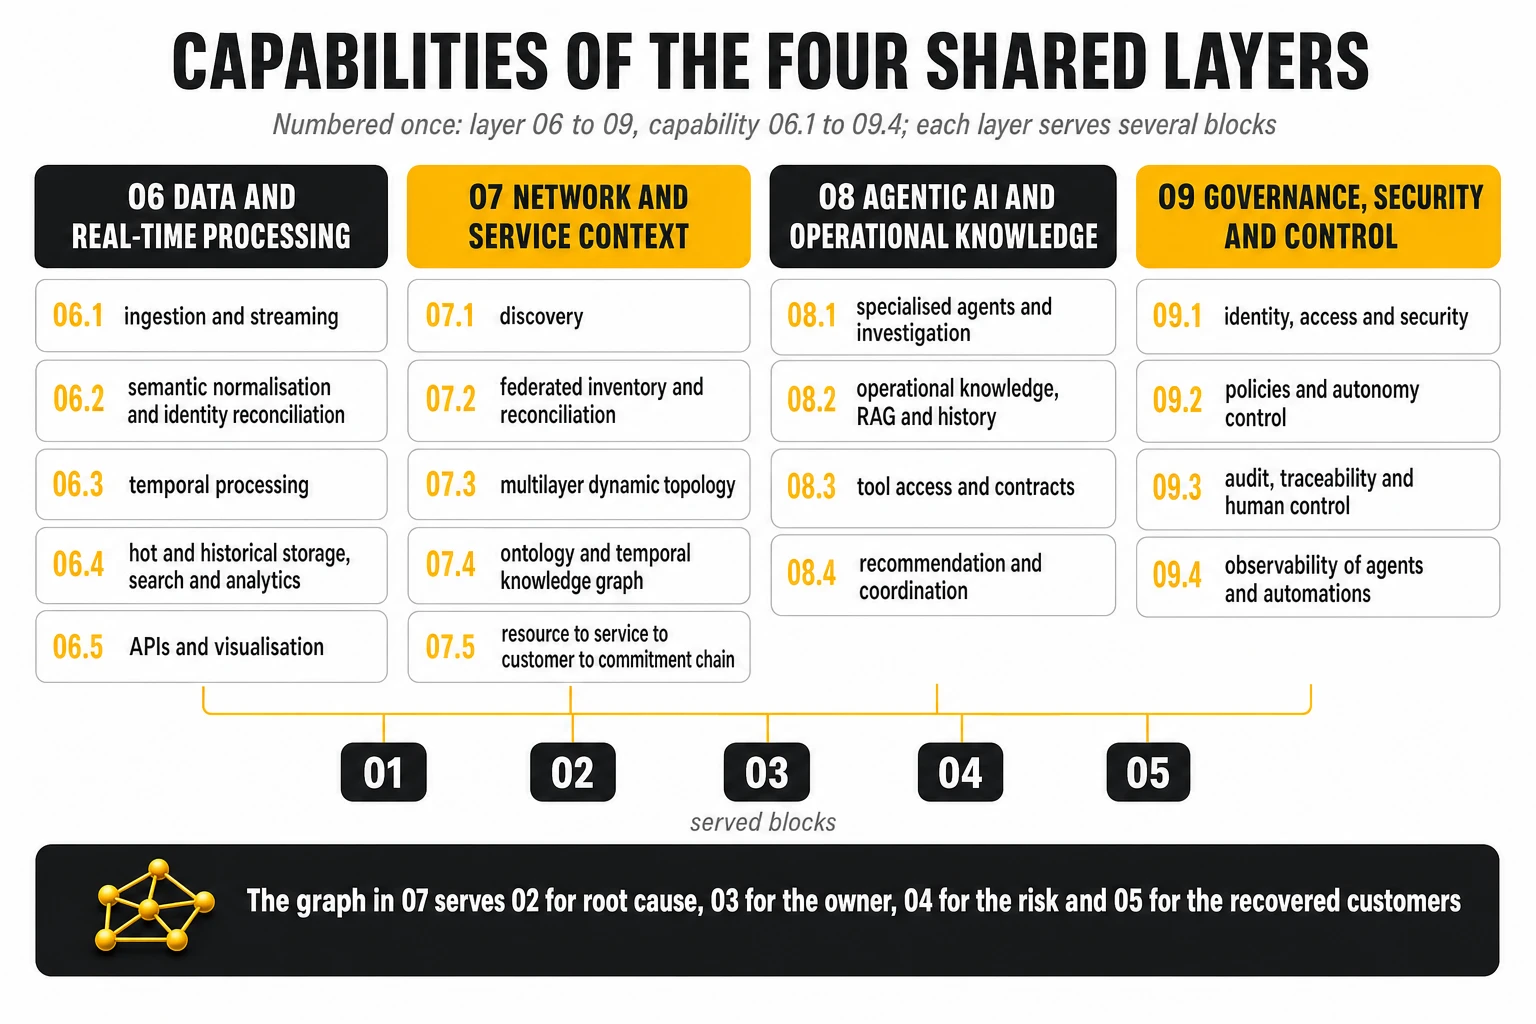
4.6 — 06 DATA AND REAL-TIME PROCESSING
Layer 06 is the one most operators already own in some form and most under-specify, because the word “observability” is allowed to cover five functions that have different physics. It is a layer, not a sub-function of 01: blocks 01, 02 and 05 write to it and read from it directly, and 03, 04 and 08 reach the evidence through its interfaces. Two properties of the layer bound everything above it: the quality, granularity and latency of the data, and the stability of the interfaces through which engines, agents and incident platforms access it.
06.1 Ingestion and streaming
Ingestion moves events, counters, logs, telemetry and session records from their sources into a common pipeline as they occur, with buffering that survives bursts and ordering that preserves time. The design questions are throughput at peak, loss during incidents — which is the failure mode that matters, because the signals are lost exactly when they are wanted — and the ability to replay. Streaming is a function first and a product second, and it should be specified by throughput, loss and ordering rather than by brand.
06.2 Semantic normalisation and identity reconciliation
Normalisation maps each source’s format onto common schemas, and it must normalise semantics as well as fields: “session establishment failure” has to mean the same thing across vendors after it. Identity reconciliation is the function organisations discover late: the same user plane function arrives from the orchestrator, the repository function, the cluster and the inventory under four keys, and nothing downstream works until the layer knows they are one entity, carries that identity through, and reconciles it when the sources disagree. Every join the article relies on — subscriber to session, session to function, function to slice, slice to customer — is made here.
06.3 Temporal processing
Temporal processing aligns clocks and windows so that events from different sources can be related by time without false coincidences, and it runs the windowed computations the fast loop needs: aggregations per minute, sequences of events, joins within a time bound. It is the infrastructure under 02.1 and 02.3, and it decides whether detection runs on streams and in-memory state or waits for a batch.
06.4 Hot and historical storage, search and analytics
Storage splits in two, and so does exploitation. An operational store holds recent state at the granularity the fast loop needs, frequently in memory; a historical store holds the depth that baselines, forensics, problem management and model training need. The critical detection path runs on the former and never waits for the latter. Search over text-heavy data — logs, traces, event text — and aggregation-heavy analytics over structured telemetry are different workloads served well by different engines, and an operator that forces both onto one engine pays in latency or in cost.
06.5 APIs and visualisation
The interfaces are the part of the layer the rest of the architecture is built against. Engines, agents (08.3), incident platforms (03) and humans reach the evidence through documented, stable APIs, and an agent or an incident platform that needs bespoke code to reach the evidence is a sign the layer is incomplete. Visualisation — dashboards, diagnostic views, reporting — sits on top and is not the backbone, however central it becomes to the operations centre’s screens.
The backbone is not the brain
Most operators with an instrumentation estate already have this layer, because the central event and log platform to which probe outputs, alarms and other feeds are exported today is it. The right design is for that platform to evolve from the place probe results are sent into the place where every signal converges — native events from each vendor, standardised analytics, counters, logs, radio and transport telemetry, cloud and IT observability, customer and service context — because without a neutral layer the operator ends up with one analytics silo per vendor.
What must not be inferred from that role is the step organisations take by reflex: that because everything arrives at the platform, the platform can be the brain. Receiving every signal is necessary and nowhere near sufficient. A brain (02 over 07) has to resolve identities, join sessions and subscribers to entities, hold a traversable topology, carry multi-vendor telco semantics, keep a temporal history, and reason from correlation to probable cause and from cause to impact with a stated confidence. A log platform can be extended toward each of those, and some operators will decide that extending it is the right strategy; the decision is taken separately, on the evidence of a validation, not assumed. The table is the test.
| Capability | Backbone role (must have today) | Brain role (to be evaluated separately) | Question to answer in the validation |
|---|---|---|---|
| Ingestion and retention | Every signal type, from every vendor, at the required rate and retention | Same | Can it take native events from two cores and a probe feed at peak without loss? |
| Normalisation | Common schema for events, counters, alarms and metadata | Common semantics, not only common fields | Does “session establishment failure” mean the same thing across vendors after normalisation? |
| Entity identity | Consistent identifiers carried through | Resolution of the same function, pod, slice or customer across five sources | How many of the incident’s entities were merged correctly without manual mapping? |
| Session and customer join | Subscriber and session keys preserved | Every anomaly attributable to sessions, subscribers and contracts | Can it name the affected enterprise customers of the slice, not only the slice? |
| Topology and dependencies | Not required | A traversable model from function to service to customer, kept fresh | Where does the topology come from, and how stale was it during the replay? |
| Temporal history | Time-series and log history | Point-in-time topology: what depended on what an hour before | Can it show what changed before the degradation began? |
| Correlation and root cause | Rule-based and statistical correlation of events | Causal reasoning over topology with a justified confidence | On the replayed incidents, how often was the proposed cause the confirmed cause? |
| Impact | Not required | Blast radius in contractual terms | Were the affected services and customers the right ones? |
| Interfaces | Documented access for engines, agents and incident platforms | Same, plus tool contracts for agents | Can an agent and the incident platform reach the evidence without bespoke code? |
| Independence and neutrality | Operator-controlled, vendor-agnostic | Same, plus the ability to be replaced without losing the data | What does the operator keep if the platform is changed: data, model, or both? |
4.7 — 07 NETWORK AND SERVICE CONTEXT
Layer 07 is the model every answer in the architecture is computed over: 02 walks it for cause and impact, 03 routes by it, 04 checks the blast radius against it, 05 reads it to know which customers to confirm, and 08 queries it constantly. Five capabilities build it, and four distinctions keep them apart: discovery is not inventory, inventory is not an ontology, an ontology is not a knowledge graph, and a knowledge graph is not automatically a digital twin.
07.1 Discovery
There are seven ways to find out what is in a network, and each reaches some planes and never the others.
- Credentialed crawl walks neighbour tables with read-only credentials: a snapshot of the IP estate in days, blind to optical, radio and containers.
- Configuration and state modelling builds a mathematical model of forwarding behaviour; it can prove reachability and evaluate a change before it is made, for the packet-handling estate only.
- Controller and management-system federation consumes north-bound interfaces — TAPI and OpenROADM in optical, gNMI and BGP-LS on routers, the management layer in mobile — and is the only route to the optical layer and to cross-layer relationships.
- OSS federation with reconciliation federates legacy inventories under one model, arbitrates when they disagree and, uniquely, carries the chain from resource to service to customer.
- Intent-first source of truth declares what the network should be and treats every difference as drift.
- Platform-native runtime discovery asks the Kubernetes API, the core’s repository function (3GPP TS 29.510), the service mesh and kernel-level observation what is running right now, with second-level freshness and a hard boundary at the cluster edge. It is the only mechanism that keeps pace with a cloud-native core, because it tracks workload identity separately from the ephemeral addresses containers discard on every scaling event.
- Traffic-derived discovery infers behaviour from flow, routing and naming data: demand and dependency, never inventory.
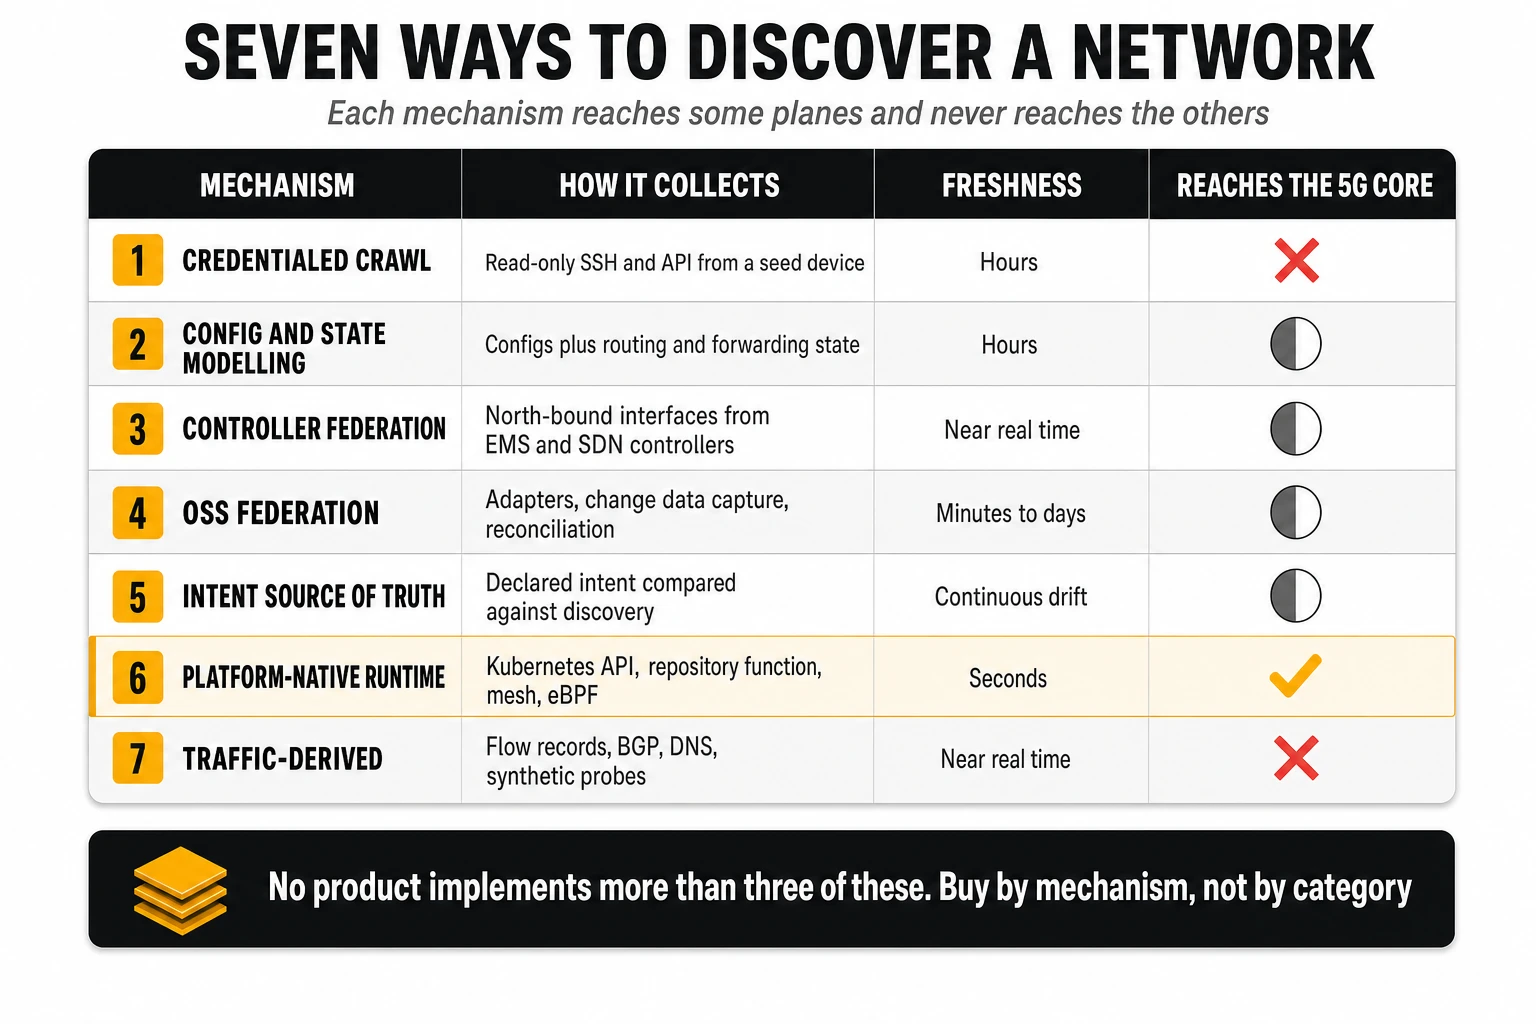
| Mechanism | How it collects | Freshness | Reaches the 5G core? | Structural blind spot | Best use |
|---|---|---|---|---|---|
| 1. Credentialed crawl (snapshot) | Read-only SSH/API from a seed, neighbour walk | Hours (per snapshot) | No — no device to log into | Optical, radio, containerised functions, runtime state | Fastest credible IP topology and audit baseline |
| 2. Config and state formal modelling | Configs plus RIB/FIB/ARP/ACL state, mathematical model | Hours (per collection) | Partially — the underlay only | Optical, radio, subscriber sessions, anything not config-determined | Change verification, segmentation and policy proof |
| 3. Controller and EMS federation | North-bound interfaces: TAPI, OpenROADM, gNMI, BGP-LS, PCEP | Near real time | Indirectly, via the mobile SMO | Fidelity capped by each vendor north-bound implementation | Multi-layer IP-optical topology and shared-risk analysis |
| 4. OSS federation and reconciliation | Adapters to legacy inventories, CDC, discrepancy workflows | Minutes to days | As a consumer of other feeds | No telemetry rate, no signalling decode | Resource-to-service-to-customer chain and governance |
| 5. Intent-first source of truth | Declared intent plus discovery agents, drift comparison | Continuous against intent | Only what you build | No telecom domain model out of the box | Enforcing an explicit data model at low licence cost |
| 6. Platform-native runtime | Kubernetes API, repository function, service mesh, eBPF | Seconds | Yes — the only mechanism that does | Everything outside the cluster; data volume cost | Cloud-native core inventory and call-graph truth |
| 7. Traffic-derived | Flow records, BGP, DNS, synthetic probes | Near real time | Flows only, no inventory | No physical or logical inventory, inference breaks on tunnels | Peering economics, demand forecasting, DDoS |
The mechanism that fits each plane is different, and one discovery decision taken across all planes at once is the most common way to over-buy and under-cover simultaneously. The cloud-native core is served by runtime discovery, with inventory staleness under a minute as the proof metric; the IP and data-centre fabric by the crawl and by configuration modelling; optical transport and radio access by controller federation; the enterprise service layer by OSS federation. The order of decision is the plane, then the mechanism, then the product.
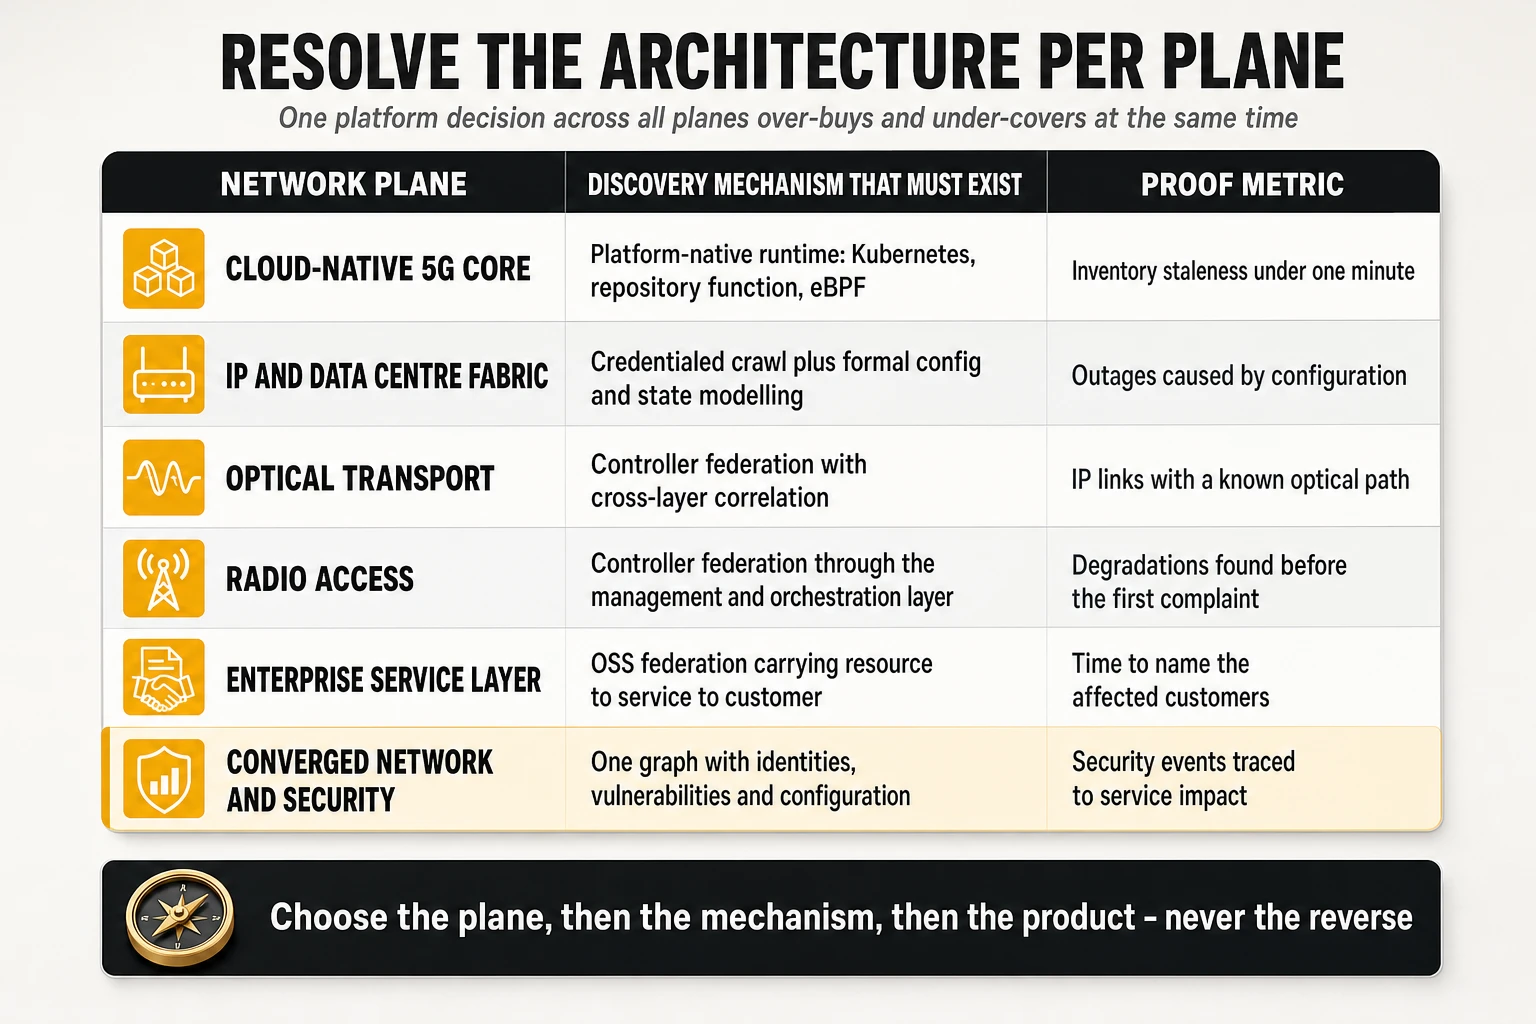
07.2 Federated inventory and reconciliation
The inventory records that something exists; the federation reconciles the several inventories an operator always has; and keeping the result accurate in a dynamic network is a discipline rather than a project. It has four parts:
- The sources that keep pace — runtime discovery, controllers, the repository function, change records — feed the model continuously, not nightly.
- Every relationship carries a validity interval and every attribute a confidence and a source, so the model can be queried as it was at the moment of an incident and disagreements between sources are visible rather than silently resolved.
- Reconciliation runs as a measured process with an accuracy metric per plane — the share of discovered entities that match the declared ones — reported, trended and gated.
- The chain is extended upward deliberately, because the service and customer links rarely exist in any discovered source; they come from the service inventory and the order and contract systems.
07.3 Multilayer dynamic topology, and why cloud-native 5G makes it different
Topology is the set of relationships between layers as they are now and as they were when the incident began, and a cloud-native 5G core makes it harder than any other domain for six architectural reasons. Each one changes what the model has to represent.
- Service-based architecture. Control plane functions call one another as services over HTTP/2 and discover one another at runtime. There is no static interface map; there is a call graph in the traffic and in the registry. The model must represent functions, instances, exposed services and the dependencies observed while they run.
- The Network Repository Function. Every instance registers its profile, the services it offers, the slices it supports and its reported load, as specified in 3GPP TS 29.510: authoritative, current and standardised, the best real-time source for the control plane. It is deliberately not an inventory: no physical topology, no history, no commercial chain, little user plane. It is a feed into the model, and a platform that does not consume it is reconstructing what the network already publishes about itself.
- Control and user plane separation. The session management function controls user plane functions over PFCP on N4 (3GPP TS 29.244). Which user plane instance serves which session, under which rules, is protocol state, not configuration. For root cause the path from symptom to instance runs through session state; for impact, the customers served by an instance are a fact of the last few minutes, and an impact computed from the inventory alone names the wrong ones.
- Kubernetes and ephemeral identities. Pods have ephemeral addresses, autoscaling and rolling upgrades. An inventory keyed on IP address is wrong minutes after a scaling event. The stable identities are the service and the instance as the platform and the repository name them; the model carries their temporary addresses as a time series, so it can answer which instance, on which node, served which sessions when the deviation began.
- Network slicing. A slice is a logical, commercial object realised across radio, transport and core, and increasingly the object a contract is written against. Detection must be per slice; impact must reach the contract behind it; no crawl discovers it.
- Coexistence of generations. The evolved packet core, IMS and interworking functions stay for years with different identifiers and relationship semantics. The model is a federation across generations with resolved identities and aligned time bases, not a migration from one to the other.
| Architectural characteristic | Why traditional discovery is insufficient | Runtime or management data sources | Required model relationship | Consequence for root cause and service impact |
|---|---|---|---|---|
| Service-based architecture | No static interface map: dependencies exist as a call graph at runtime | Service-based interface traffic and traces; the repository function; service mesh telemetry | Function → instance → exposed service → observed dependency, with timestamps | Cause must be traced through calls that happened, not interfaces that were designed; impact follows the consumers of a service, not the neighbours of a node |
| Network Repository Function | Authoritative for what is registered now; holds no physical topology, no history, no commercial chain, little user plane | Repository profiles, registration and deregistration events, reported load (3GPP TS 29.510) | Registered instance → profile → physical placement (from the platform) → service and customer (from the inventory) | Real-time discovery of the control plane; impact and history still need the master model and the backbone |
| Control and user plane separation | The session-to-user-plane binding is protocol state, not configuration | Session and user plane function events and counters; the PFCP exchange on N4 (3GPP TS 29.244); virtual tap on demand | Session → user plane instance → forwarding rules → data network, as a fact of the last minutes | Cause runs through session state; impact from the inventory alone names the wrong customers |
| Kubernetes and ephemeral identities | Addresses change in minutes; nightly refreshes describe a vanished network | Kubernetes API, scheduling and scaling events, deployment records, platform telemetry | Stable service identity → instance → temporary address → node, kept as a time series | An incident is analysed after it happened; the model must answer what served what when the deviation began |
| Network slicing | A logical, commercial object that no crawl discovers | Slice selection and management data; function events carrying the slice identifier; the service inventory | Slice → functions and resources that realise it → services → customers → commitments | Detection must be per slice; impact must reach the contract behind the slice |
| Coexistence of generations | Different models, identifiers and relationship semantics on each side of the boundary | Evolved packet core and IMS counters and events; interworking function data; subscriber identity mappings | Federated model with resolved identities and aligned time bases across generations | A procedure that crosses the boundary has one cause and two sets of symptoms; impact must be computed once, not per generation |
Three of the six are specific to the core; three are the core’s version of problems every domain has. The service-based architecture, the repository function and the control-user plane separation are the 5G core’s own ways of making dependencies dynamic; a software-defined transport controller’s path computation plays a similar role for optical and IP paths, but there is no exact equivalent. Ephemeral identities are the condition of every containerised platform; a slice is the same kind of object as an enterprise VPN, a wavelength service or a cloud tenant; and coexistence of generations is the permanent state of every operator’s estate — copper and fibre, legacy and segment-routed transport, virtual machines and containers. The model is general; the core is only its hardest case.
07.4 Ontology and temporal knowledge graph
Four artefacts are routinely treated as synonyms and are not. The inventory records that something exists; a list has no relationships and correlates nothing. The ontology declares which entity types exist and which relationships between them are legitimate — the TM Forum information model, the 3GPP resource models and YANG schemas are the industry’s written versions — and skipping it produces the identity collision in which one function arrives under four keys. The knowledge graph applies the ontology to real entities — this wavelength carries this IP link carries this path anchors this user plane function serves this slice sold to these customers — and its value is traversal, with time: a temporal graph knows what the network looked like an hour ago. The semantic model defines what the metrics mean and how they join, which decides whether two teams quoting the same indicator are quoting the same number.
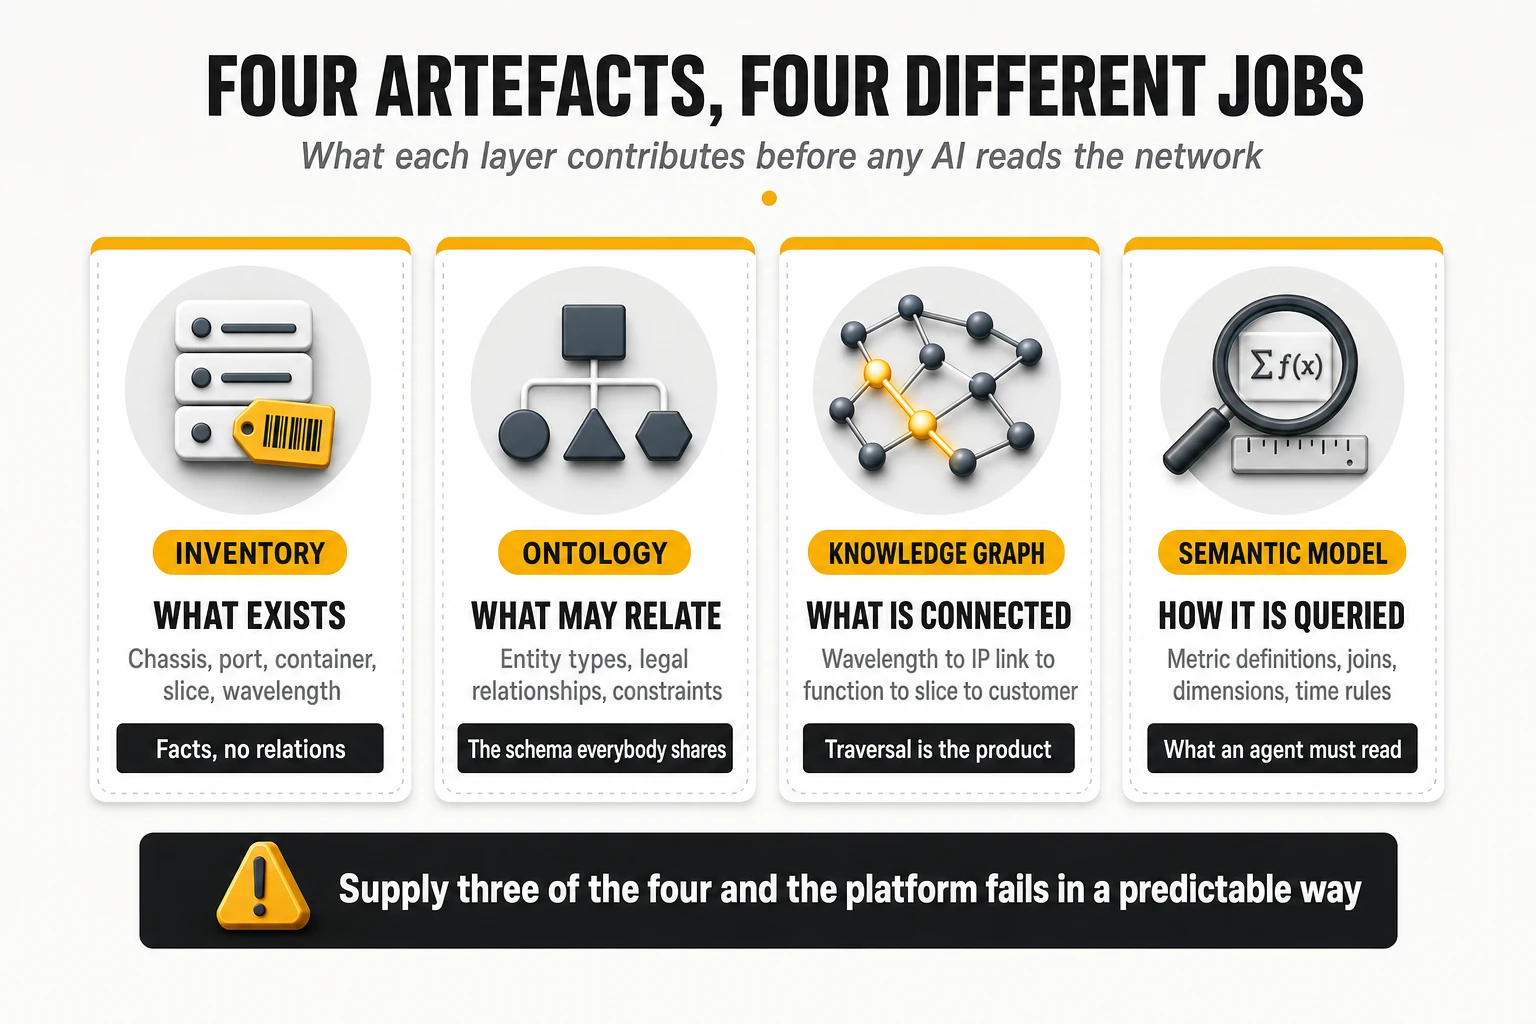
A related ladder deserves the same precision. A digital model is a static representation of topology; a digital shadow adds live state, with the network driving the replica one way; a digital twin adds simulation. Almost every “twin” in telecom assurance is a shadow, and a complete, current shadow is worth more in daily operations than an aspirational twin — but a procurement should insist on knowing which rung is being sold.
07.5 The chain from resource to commitment, changes and dependencies
In practice the model is one chain — resource, dependency, service, customer, commitment — and every block reads it differently. Resources are ports, links, pods, nodes, wavelengths; components are the functions, instances and paths built on them; dependencies say what relies on what; services are the slices, connectivity products, voice services and enterprise VPNs; customers are the segments, enterprises and wholesale partners; commitments are the objectives, agreements and contractual terms attached to each. Changes are attached to the elements they touched, with timestamps, because the first question of any investigation is what changed.
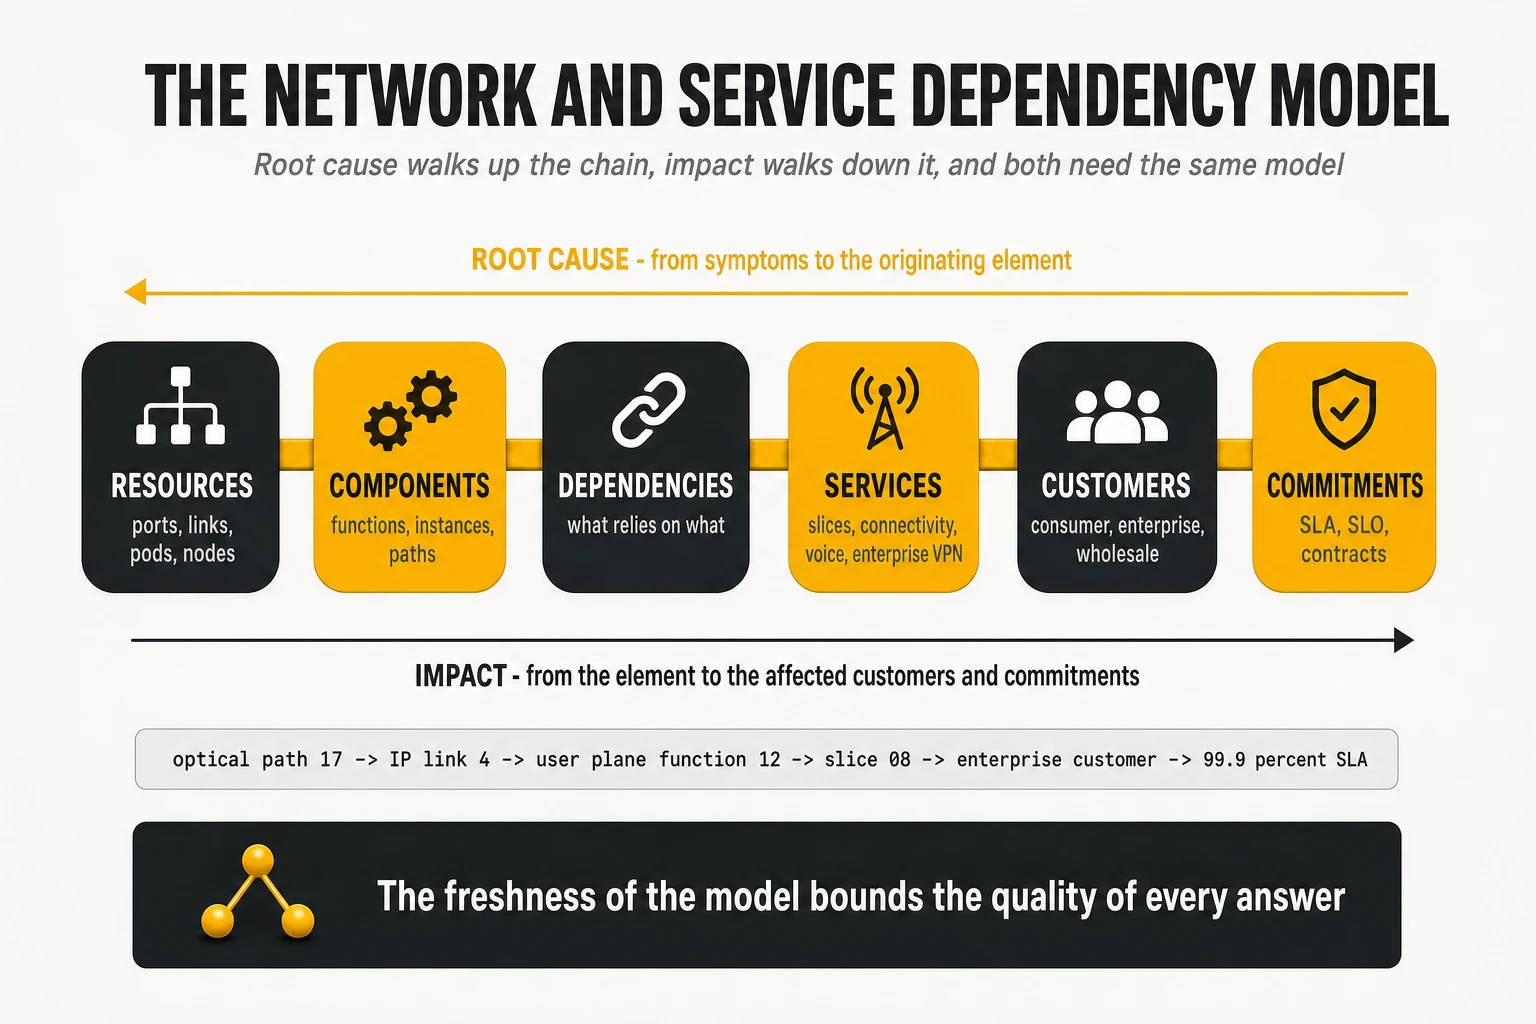
- 02.3 uses the chain to decide that symptoms on three functions belong to one event because they share a dependency.
- 02.4 walks it upward, from symptoms toward the originating element.
- 02.5 walks it downward, from the element toward customers and commitments.
- 03.2 routes by it, because the owner of a service is known from the chain.
- 04.1 checks it before acting, because the blast radius of a change is a downstream walk.
- 05.2 reads it to know which customers must be confirmed as recovered.
The same chain works for a fixed broadband service — port, line card, access node, aggregation ring, broadband gateway, service profile, subscriber, contract — and for an enterprise product spanning access, transport, edge and cloud. That is why the model is a shared layer and not a mobile-core feature.
4.8 — 08 AGENTIC AI AND OPERATIONAL KNOWLEDGE
Layer 08 uses every other category through defined interfaces, and the most useful way to specify it is by what its agents are connected to rather than by the models inside them. It is transversal: it investigates for 02, enriches and drafts for 03, recommends for 04 and analyses for 05. It is not a replacement for 02, and the fast loop never runs through it.
08.1 Specialised agents and investigation
Specialised agents hold the expertise of a domain — the mobile core, the IP network, the cloud platform, service assurance, customer impact — and investigate within it. Skills are the packaged procedures an agent can follow: check whether a function’s degradation is caused by its infrastructure, compare an instance with its peers, assemble an impact statement. Agent orchestration runs several agents on one incident in parallel where the investigation allows — one checking network against platform, one computing impact, one examining the changes of the last hour — and assembles their findings. The investigation tests hypotheses against evidence and requests more when it needs it, such as a bounded packet capture under 01.5’s policy.
08.2 Operational knowledge, RAG and history
Knowledge retrieval over the operator’s own material — runbooks, architecture documents, past incidents, vendor documentation, the service catalogue — gives the agents the context an engineer carries in memory. It is done through retrieval-augmented generation rather than through a context window of documents, and it is only as good as what 05.4 writes into it: the pattern, the runbook that worked, the precedent. Historical incidents are the most valuable knowledge the operator has and the least often made retrievable.
08.3 Tool access and contracts
Tool interfaces — conventional APIs and, where convenient, protocols designed for agents such as the Model Context Protocol — give agents controlled access to the backbone, the model, the engines, the change records, the incident platforms and the diagnostic systems. The protocol makes capabilities easier for an agent to reach; it does not replace the engines or the data behind them, a point worth stating because a market that has learnt a new acronym tends to promote it to an architecture. Every connection is a contract, and the table states what each must guarantee.
| Where the agent connects | Its real function in the investigation | What the contract must guarantee |
|---|---|---|
| Streaming and detection engines | Receives the structured situation that triggers the investigation, with its initial hypotheses | Structured input, never raw telemetry at volume |
| Correlation and root cause engines | Queries candidate causes and the evidence for and against each; requests further analyses | Confidence and alternatives exposed, not a single name |
| Knowledge graph or digital shadow | Walks dependencies, verifies topology, bounds impact, asks what changed | Point-in-time queries; freshness stated |
| Indicators, events, traces and sessions | Obtains additional proof and tests hypotheses against live data | Read access through the backbone’s interfaces |
| Service, customer and commitment inventory | Translates a technical anomaly into operational and commercial impact | The resource-to-commitment chain, not only the inventory |
| Change and deployment management | Relates the start of the degradation to potentially causal changes | Change records with timestamps and scope |
| Historical incidents and knowledge base | Finds precedents, applicable runbooks and known patterns | Retrieval over the operator’s own material |
| Probes and capture on demand | Requests additional instrumentation when native evidence is insufficient | Scope, window and authorisation enforced by the mechanism, not by the agent |
| Incident response and ITSM | Updates the record, proposes priority, drafts communications | Writes are attributed, versioned and reviewable |
| Orchestrator and automation | Proposes or, under policy, triggers actions with pre-checks | Authorisation gate outside the agent; execution logged |
08.4 Recommendation and coordination
The outputs of the layer are specific.
- An evidence-backed assessment: the observed degradation, the most probable cause, the competing hypotheses, the estimated impact, the confidence and the recommended next actions, with their risk class.
- A request for additional evidence, such as a bounded packet capture, under the mechanism’s own authorisation.
- A draft of the incident update, the customer communication or the post-incident report, written into the record and attributed.
- Under policy, a proposal to 04, which passes through 09.2 like everyone else’s.
The limits are as explicit as the connections, because the value of the layer depends on them.
- Agents do not detect. The fast loop does. An agent asked to watch millions of signals through a language model is slow, expensive and unreliable at exactly the task deterministic engines do well.
- Agents do not own the truth. They reason over the model, the evidence and the engines’ conclusions; when those are wrong, the agent is wrong with more fluency.
- Agents do not authorise. The decision that an action may run belongs to 09 and, where the policy says so, to a human. An agent that can both decide and execute has removed the gate.
- Agents do not replace the systems beneath them. 03.3 still owns the record, 04 still owns the execution, 06 still owns the data.
4.9 — 09 GOVERNANCE, SECURITY AND CONTROL
Layer 09 decides what may run alone, what needs approval and what is forbidden, by incident class, by element and by moment; it secures the whole system and keeps humans in control of it. It is drawn as a band across all five blocks because it applies at every one of them, most visibly at the two gates of the operating model. Autonomous operations does not mean removing human controls; it means placing them precisely.
09.1 Identity, access and security
Humans, automations and agents are all identities, and each gets the least privilege its function needs. Role-based access and identity management cover who may read which evidence and write to which record; privileged access management covers the credentials that touch the network; secrets never live in a prompt or a playbook. Data residency and privacy apply with particular force to subscriber-level evidence and to captures (01.5): masking, retention, access control and the legal basis for a per-subscriber tap are controls of this layer, as is the strict separation between the assurance estate and lawful interception.
09.2 Policies and autonomy control
Policy is the written answer to who may decide what, and it is evaluated by a policy engine rather than remembered by people. A policy evaluates the action class (04.1), the element and its blast radius (07.5), the moment — change window, peak, major event — and the measured history of the class, and returns one of three answers: run, ask a named approver, refuse. The same engine holds the autonomy level per incident class and per risk level, extends it when the measured precision justifies it and reverses it when the precision falls. Policy as code, with the same review and versioning as any other code, is the practical form.
09.3 Audit, traceability and human control
Every decision is logged with its evidence, its identity and its authorisation, from the first grouping in 03.1 to the closure in 05.3, and the log is readable by someone who was not there. Human control has three forms: the approval a policy requires, the override an engineer can always exercise, and the stop that halts a class of automation when something is wrong. The incident commander of a major incident is an explicit role in the record, not an informal one on a bridge. Approvals are recorded in the change record of 03.3, where the audit of a human decision and of an automated one look the same.
09.4 Observability of agents and automations
The agents and the automations are themselves systems to be observed. Every agent run is traced — inputs, tools called, outputs, cost — and evaluated against a set of known incidents before it touches production; precision per incident class is measured continuously and drift is detected when it falls. Every automation run reports success, rollback and the time it took. Without this capability, autonomy is extended on the strength of a demonstration rather than a record, which is the failure mode the roadmap of section 10 is built to prevent.
| Control of layer 09 | Applies to | What it guarantees |
|---|---|---|
| Least-privilege identities for humans, automations and agents (09.1) | 01 to 08, every read and write | An agent reads what it needs and writes where it is attributed; a playbook holds no credential it does not need |
| Privacy and retention of subscriber evidence and captures (09.1) | 01.5, 06.4, 08.3 | Masking, retention and access are enforced by the mechanism, not by the requester |
| Policy evaluation per action, element and moment (09.2) | 04.2, triggered by 04.1 and 08.4 | Run, ask or refuse, decided the same way whoever proposed the action |
| Autonomy level per incident class and risk level (09.2) | Scenarios of section 2; 04.1 | Autonomy extended and reversed on measurement, never for the platform as a whole |
| Decision log with evidence and identity (09.3) | 03.1 to 05.3 | Every grouping, hypothesis, approval, execution and closure is reconstructible |
| Override and stop (09.3) | 04, 08 | An engineer can always take over; a class of automation can always be halted |
| Agent and automation telemetry (09.4) | 08, 04 | Precision per class, drift, cost, rollback rate and run time are measured, not assumed |
5. The technology ecosystem: which suppliers serve each block and layer
With the capabilities defined, the market can be read as a map rather than a ranking, in the same nine categories and the same order as section 4. The first thing the map shows is that no supplier covers the cycle from evidence to verified recovery; the second is that an operator typically already owns more of it than its procurement assumes. Three cautions apply to every row of every table in this section:
- A supplier in a row is a hypothesis of classification that a validation must confirm, not a guarantee of capability.
- For each entry, distinguish whether the function is native to a specific product, obtained through integration, or obtained only through development; and what public evidence of deployment exists.
- The lists are illustrative of a pattern, not exhaustive; generic monitoring, data, incident-response and automation tools appear beside the telecom-specific platforms because the pattern applies to every domain.
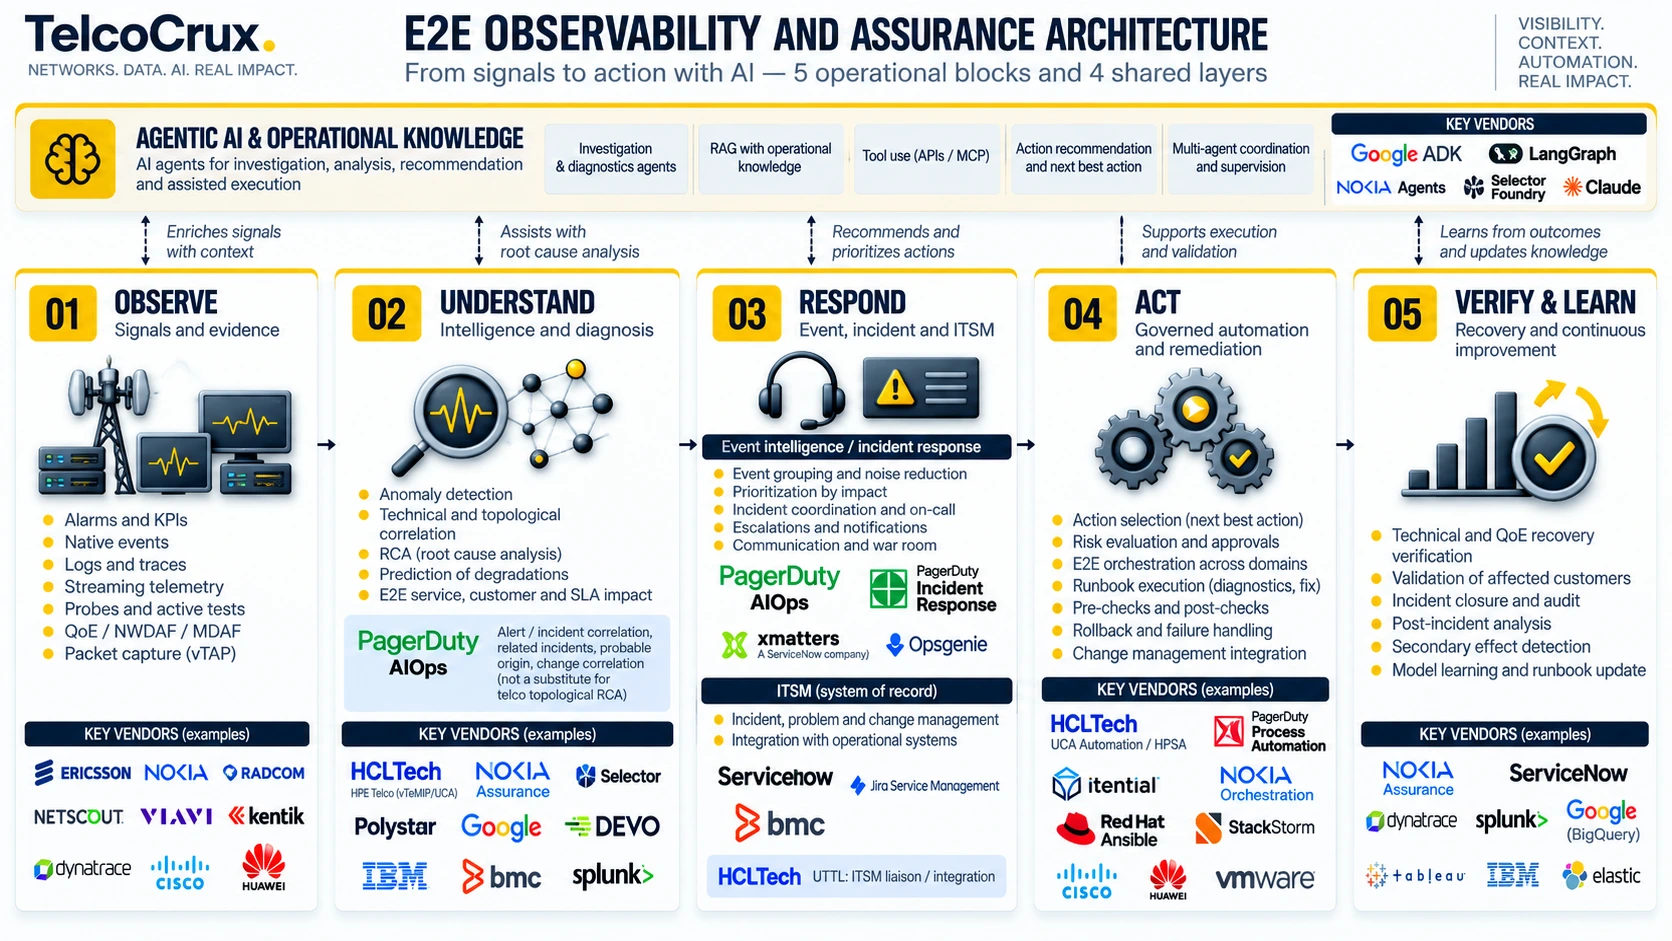
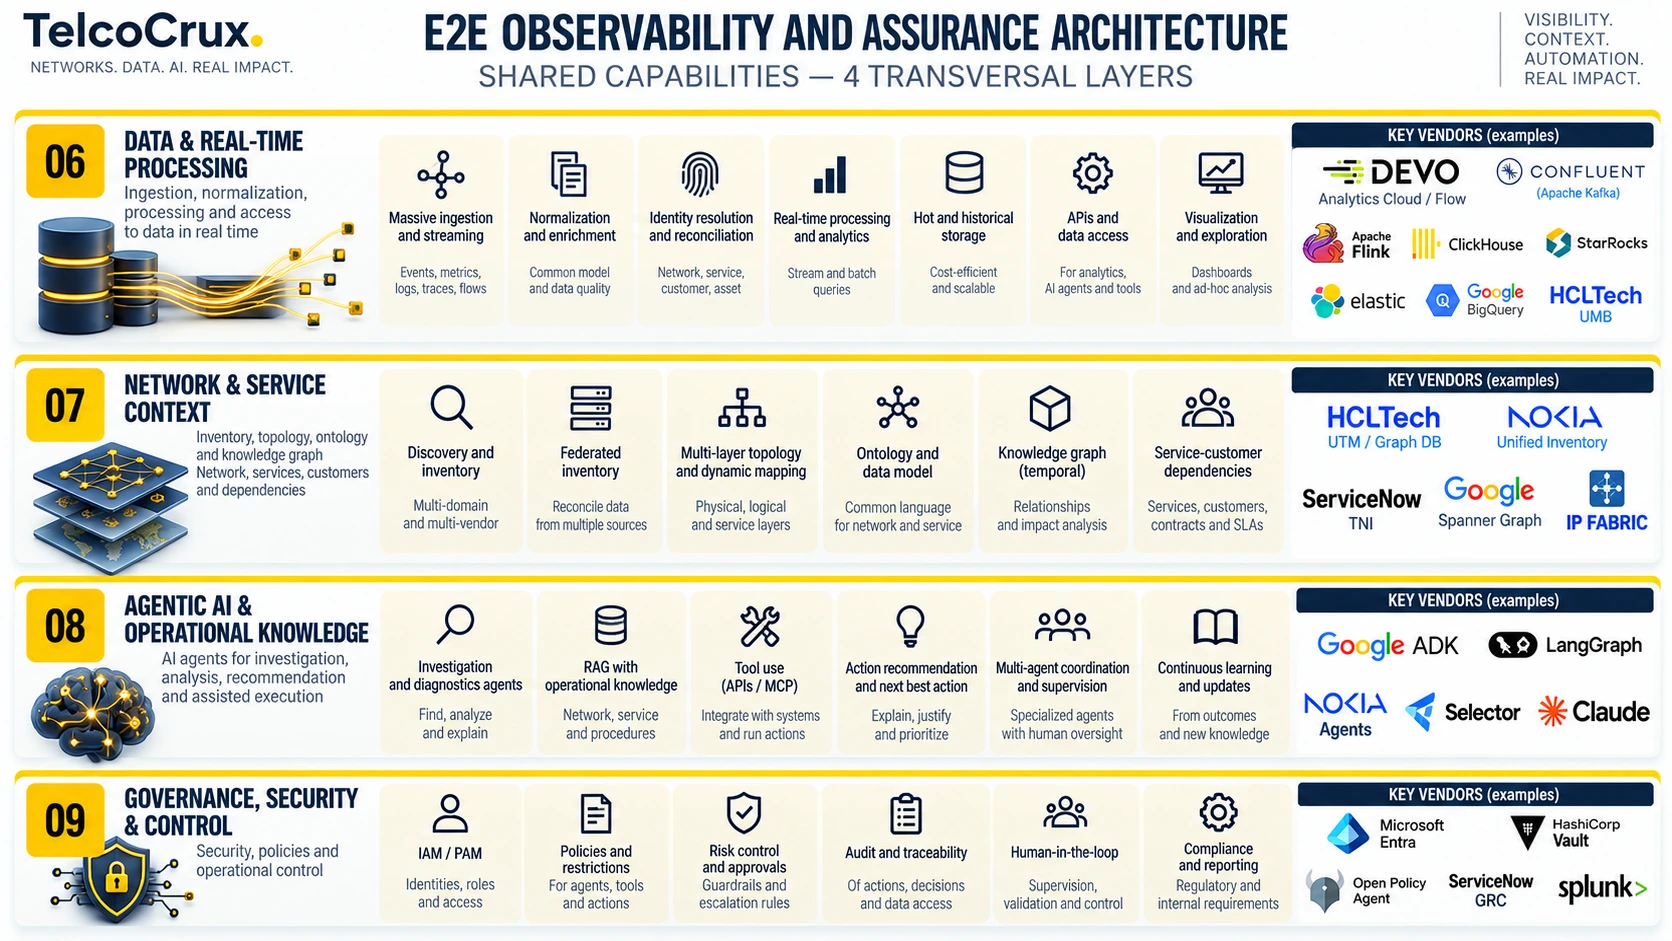
5.1 — 01 OBSERVE: the suppliers that see the sessions
| Capability | Representative suppliers and tools | Native, integrated or developed | What to verify |
|---|---|---|---|
| 01.1 Alarms, counters and KPIs | Element managers and mediation of each vendor; infrastructure monitors such as Zabbix | Native | Cadence of the reports; completeness of counters for third-party functions |
| 01.2 Native function events | Ericsson embedded software probes (event reporting); the event exports of other core vendors in their own formats | Native per vendor; normalisation developed in 06.2 | Context in every record (subscriber, slice, cause); latency and loss under load; export-health monitoring |
| 01.3 Logs, traces and streaming telemetry | OpenTelemetry collectors; Dynatrace for the platform layer; service mesh and eBPF-based tooling; Kubernetes telemetry | Native on the platform; joined to sessions by development | Whether the subscriber can be reached from the platform signal |
| 01.4 NWDAF and MDA feeds | Nokia probeless NWDAF; Ericsson event exposure as the road to NWDAF; management analytics of each vendor | Native, maturing | What the feed actually exposes today, against the standard it cites |
| 01.5 Probes and selective packet capture | RADCOM ACE; NETSCOUT nGeniusONE; Polystar Osix; Ericsson virtual tap; Gigamon visibility fabric | Native | Independence at critical points; activation latency and overload behaviour of the on-demand tier; open northbound interface |
| 01.6 QoS, QoE and active tests | User-plane classification in gateways and probes; service-specific experience analytics such as NPAW for video; active test platforms | Native per service | Coverage of heuristics class by class; parity between sources |
Ericsson supplies the clearest example of evidence produced by the function itself. Its embedded software probe gives each function of the dual-mode packet core two export services — event reporting with cause and sub-cause codes, and a virtual tap that mirrors interface packets with the service-based interfaces already decrypted — governed by a probe controller that delivers to each consumer what it subscribed to, with per-consumer certificates and masking, and with no lifecycle of its own. The gateway reuses its charging classification to emit per-flow usage events with application identification and transport metrics. The vendor’s guidance of up to 60% lower capital and up to 90% lower operating cost against external probes is a vendor claim without independent validation; the verifiable claims are architectural. What it is not: a neutral backbone for other vendors’ cores, or an independent observer of its own functions’ failure.
Three evidence platforms are specialised in session-level evidence, and each has a different centre. RADCOM’s ACE observes control and user plane across generations in multi-vendor environments and runs as containerised workloads beside the functions it monitors, which makes it the natural consumer of a virtual tap for the on-demand tier; its published customers include AT&T, DISH and Rakuten Mobile and, from August 2026, CETIN Networks in Slovakia. NETSCOUT’s nGeniusONE turns traffic into session metadata across 3G to 5G standalone, its February 2026 AI-ready data offer positions it as the sensor other engines run on, and the October 2022 announcement with Swisscom and Ericsson showed its virtual instrumentation consuming a cloud-native core’s virtual tap with no physical tap in the chain. Polystar’s Osix is the probe and tracing layer of a platform that also covers 06 and 02. Gigamon’s cloud suite is the representative visibility fabric: the dematerialised broker as a product. None of the four is the end-to-end model (07).
5.2 — 02 UNDERSTAND: detection, correlation, root cause and impact engines
| Capability | Representative suppliers and tools | Native, integrated or developed | What to verify |
|---|---|---|---|
| 02.1 Anomaly detection | Nokia Assurance Center; Polystar Kalix Analytics; Selector; Ericsson Expert Analytics; Dynatrace (platform layer); Splunk ITSI; operator-built models | Native; models often developed per indicator | Detection latency at the operator’s granularity; dependence on persistence; false positives |
| 02.2 Degradation prediction | Nokia anomaly forecasting; Polystar adaptive thresholds; burn-rate rules built on the backbone | Native or developed | Whether the prediction is tied to a commitment, not only to a counter |
| 02.3 Technical and topological correlation | Selector; Nokia dynamic topology correlation; Polystar cross-domain correlation; ServiceNow event management over the CMDB; Dynatrace for the platform layer | Native; quality bounded by the model supplied | Whether it reasons over a current topology |
| 02.4 Root cause with hypotheses and confidence | Selector causal model; Dynatrace causal engine; Nokia; graph and causal models on Google’s framework; ServiceNow probable-cause scoring | Native; developed on platforms | Confidence and alternatives exposed, not a single name |
| 02.5 Service, customer and SLA impact | Nokia Service Impact Analysis; ServiceNow Telecom Service Operations Management; Polystar customer-first impact; Ericsson Expert Analytics per subscriber | Native where the chain is held; otherwise developed | Whether impact starts before the cause is confirmed; whether it reaches the contract |
The engines differ mainly in what they reason over, and each has a defensible specialism. Nokia’s Assurance Center combines indicator knowledge with anomaly forecasting, alarm pattern recognition and causality detection over the unified inventory; its Service Impact Analysis is probably the strongest out of the box, expressing an incident as one function, seventeen thousand sessions, three slices, two business services and forty-seven enterprise customers. Polystar’s Kalix Analytics learns expected patterns and converts “alarm below 98%” into “the expected value on a Tuesday at 10:30 is 99.72%, the observed value is 99.13%, and the deviation is significant”, with a cross-domain correlation use case between core, transport, radio and site. Selector is the purest correlator: hundreds of sources without agents, entity resolution so that one function is one entity whichever feed named it, anomalies grouped into episodes, and a causal model that separates cause from effect. Ericsson’s Expert Analytics detects and computes impact at the level of the individual subscriber, device and area. Dynatrace’s causal engine names a cause deterministically for the cloud beneath the network and is no engine at all for the network itself. Google’s framework trains graph neural networks on topology, history and events for relational anomalies and root cause: the highest ceiling for complex causality and the longest road to it. ServiceNow’s Telecom Service Operations Management adds correlation, impact and discrepancy handling over the chain its inventory holds, with confidence scores for the most probable cause.
5.3 — 03 RESPOND: event intelligence, incident response and ITSM platforms
| Capability | Representative suppliers and tools | Native, integrated or developed | What to verify |
|---|---|---|---|
| 03.1 Event intelligence | PagerDuty AIOps and Event Orchestration; ServiceNow Event Management; BMC Helix Operations Management; Splunk ITSI | Native | Grouping accuracy against real incidents; enrichment sources; service-aware routing |
| 03.2 Incident response | PagerDuty Incident Response; ServiceNow; BMC Helix; the operator’s coordination systems | Native | On-call, escalation, supplier interfaces, synchronisation with the master record |
| 03.3 ITSM and the master record | ServiceNow ITSM; BMC Helix ITSM; Jira Service Management; the operator’s internal incident and work-management systems | Native | Which system is master; identifier mirroring; relationships to problems and changes |
PagerDuty is the representative specialist, and its own documentation describes three pillars: AIOps, which routes and enriches through event orchestration, collapses related alerts through alert grouping and reduces noise with machine learning (03.1); Incident Response, the on-call, escalation, bridge and status machinery of the live incident (03.2); and Automation, which runs diagnostics and remediation through runbook automation with runners behind the operator’s firewall (04.3). Its claims of faster resolution are vendor figures. What PagerDuty is not: a causal model of the network, or the master record; it groups and routes what the engines and the model give it.
ServiceNow and BMC supply event management and the master record from one vendor, which is their structural advantage and their structural risk. ServiceNow’s Event Management turns events into alerts tied to configuration items, deduplicates and correlates them in a fixed order — rule-based, by node, manual, then through the CMDB’s relationships — and feeds incidents into the platform that owns the ITSM record: everything in one place, and one place that must then be the master. BMC Helix pairs Operations Management, with vendor-stated reductions of up to 90% in event noise, with Helix ITSM, linked through a proactive resolution flow; tickets are also routable to other ITSM tools. Jira Service Management is the lighter-weight platform where the engineering teams already run their work in the same tool family, with telecom-specific service modelling to be added rather than assumed. Splunk ITSI sits between 06 and 03.1 with service-level views and event correlation over the Splunk data platform. The operator’s internal coordination and work-management systems belong in these rows according to the functions they verifiably perform, and it is often better to keep an internal system as master and synchronise the modern platforms to it than to run two masters.
5.4 — 04 ACT: orchestration and automation suppliers
| Capability | Representative suppliers and tools | Native, integrated or developed | What to verify |
|---|---|---|---|
| 04.1 Action selection and risk evaluation | Recommendations from the engines of 02 and the agents of 08; risk classes evaluated by the policy engine of 09.2 | Developed as policy; recommendations native in suites and overlays | Whether the class, the blast radius and the moment are evaluated before any execution |
| 04.2 Approvals and change management | ServiceNow, BMC Helix and Jira change workflows; approval kept in the ITSM when an orchestrator executes | Native | That every automated action is a change record, even when it ran in seconds |
| 04.3 End-to-end orchestration | Itential; Nokia Orchestration Center; Ericsson intent-based operations and rApps; StackStorm and workflow engines; PagerDuty Process Automation | Native per domain; cross-domain by orchestration | Interfaces to the domain orchestrators; how execution is recorded in the incident and change records |
| 04.4 Execution with pre-checks, post-checks and rollback | Domain controllers and the cloud platform’s APIs; Ansible; Jenkins and pipeline engines; Microsoft Power Automate for the business side | Native per tool; pre-checks and rollback developed unless the orchestrator supplies them | Pre-checks, authorisation classes, rollback and audit for each action class |
Itential is the representative network orchestration platform, and the clearest published example of coordinating and executing as separate functions. It runs pre-checks that capture configuration, routing and interface state into the ticket’s work notes, executes the change across network, cloud and security domains, runs post-checks, rolls back to the last known-good state when a change fails mid-window, and keeps the ServiceNow record updated at every step, with the approval workflow and ticket life cycle left in ServiceNow; its service-provider offer adds TM Forum interfaces. Its customer examples are company claims. StackStorm is the representative open-source event-driven platform — sensors, triggers, rules and workflows, with runs logged and content as versioned code — suited to institutionalising runbooks and not a substitute for the orchestrator’s model and checks. Ansible, Jenkins and Power Automate are the engines that are usually already present; Nokia’s Orchestration Center and Ericsson’s intent-based operations are the native executors inside their suites; and the domain controllers are where every one of the above ultimately has to act.
5.5 — 05 VERIFY AND LEARN: a capability without a supplier of its own
| Capability | Representative suppliers and tools | Native, integrated or developed | What to verify |
|---|---|---|---|
| 05.1 Technical and QoE recovery verification | The same assurance and observability engines as 02, asked explicitly after the action; the evidence of 01.6 | Integrated | Recovery judged by the baselines that detected the degradation, not by a static threshold |
| 05.2 Affected-customer validation and side effects | Impact engines of 02.5 re-run on the impact list; detection engines of 02.1 for side effects | Integrated | The impact list confirmed item by item |
| 05.3 Validated closure and post-incident analysis | ITSM closure rules (ServiceNow, BMC Helix, Jira); agents of 08 drafting the analysis | Native rules, developed content | Closure refused until the six checks are recorded |
| 05.4 Learning: models, baselines, runbooks | Analytics platforms and the backbone for retraining; knowledge repositories; runbook repositories; custom-build specialists | Developed as an integration across the others | Recurrence per cause; time from closure to model update |
A platform vendor will reasonably say that its product supports verification and learning; what it cannot say is that the integration exists in the operator’s estate, and the validation of section 8 exists to find out. The custom-build specialists — software houses and integrators with telecom data engineering, graph analytics or automation frameworks — are the suppliers most often engaged for exactly that integration, and for the identity resolution, ontology and models of 06 and 07. Their result belongs to the operator and is shaped by the operator’s data; their maturity depends on the engagement rather than on a roadmap. The questions to put to them are concrete: can they model the chain from service to slice to function to container to host to transport; resolve that four identifiers refer to one function; keep the topology as it was before an incident; learn baselines by node, hour, day, service, release and region; collapse hundreds of alarms into one episode; distinguish correlation from probable cause; walk the graph backwards to the affected customers; justify why an element was named as root; let the operator correct the result; and work at millions of entities and billions of observations.
5.6 — 06 DATA AND REAL-TIME PROCESSING: backbone, analytics and visualisation
| Capability | Representative suppliers and tools | Native, integrated or developed | What to verify |
|---|---|---|---|
| 06.1 Ingestion and streaming | Kafka and managed streaming services; Flink and stream processors; the operator’s central event and log platform | Native | Loss at peak; ordering; replay |
| 06.2 Semantic normalisation and identity reconciliation | Polystar Kalix DataOps for telecom data; entity resolution inside overlays such as Selector; operator-built pipelines | Usually developed | How many of an incident’s entities are merged correctly without manual mapping |
| 06.3 Temporal processing | Flink and stream processors; complex event processing engines; in-memory state stores | Native | Whether detection runs on streams or waits for a batch |
| 06.4 Hot and historical storage, search and analytics | Elastic for text search; StarRocks and ClickHouse for aggregation-heavy analytics; Splunk; Google BigQuery for history | Native | Search and analytics workloads separated; the critical path never waits for the historical store |
| 06.5 APIs and visualisation | Documented APIs of the backbone; Grafana, Superset and Power BI for dashboards | Native | Whether agents and incident platforms reach the evidence without bespoke code |
The suppliers in this layer serve different workloads that should not be confused. Streaming is specified by throughput, loss and ordering rather than by brand. Elastic is specialised in search over text-heavy data and the exploratory investigation search enables; StarRocks and ClickHouse in aggregation-heavy analytics over structured telemetry with fresh data and high concurrency; the two patterns are complements. Splunk serves both log analytics and, through ITSI, service-level views. Polystar’s Kalix DataOps is the telecom-specific backbone — ingestion, normalisation and correlation of network and OSS data, with more than 150 connectors by the vendor’s figures — and it is the join between sessions and counters that most operators have both halves of and cannot make. BigQuery is the historical and analytical store under Google’s graph platform. Grafana, Superset and Power BI are visualisation and nothing else, however central they become to the operations centre’s screens.
5.7 — 07 NETWORK AND SERVICE CONTEXT: discovery, inventory, graph and service models
| Capability | Representative suppliers and tools | Native, integrated or developed | What to verify |
|---|---|---|---|
| 07.1 Discovery | IP Fabric, Forward Networks, NetBox for IP; Cisco Crosswork for transport; Kubernetes API and the repository function for runtime; Kentik and Nokia Deepfield for traffic-derived dependencies | Native per plane | Freshness in cloud-native domains; which planes each one reaches |
| 07.2 Federated inventory and reconciliation | Nokia Unified Inventory; ServiceNow Telecom Network Inventory and CMDB; Blue Planet, Netcracker, Amdocs | Native; reconciliation configured per source | Accuracy per plane, measured and trended |
| 07.3 Multilayer dynamic topology | Controller federation (TAPI, OpenROADM, gNMI, BGP-LS); Selector’s operational twin; Dynatrace’s discovered topology for the platform layer | Native for each layer; cross-layer by integration | Point-in-time history; cross-layer links actually present |
| 07.4 Ontology and temporal knowledge graph | Google Spanner Graph; Nokia’s unified model; graph databases with an operator ontology; ServiceNow service mapping | Native in suites; developed on platforms | Traversability; temporal queries; who owns the ontology |
| 07.5 Resource to commitment chain, changes and dependencies | Service inventories and order and contract systems; ServiceNow change and service mapping; OSS federation | By integration with service and order systems | Whether the service and customer links exist, link by link |
The context layer is supplied in four quite different ways, and the choice between them is the strategic decision of the whole programme. The integrated suite ships it: Nokia’s Unified Inventory is the common model under its Digital Operations Center, with the chain from function to slice to service to customer carried. The service-management platform models it from the customer side: ServiceNow’s Telecom Network Inventory, CMDB and service mapping, with the OSS inventories — Blue Planet, Netcracker, Amdocs — federating and reconciling legacy sources. The platform lets the operator build it: Google describes Spanner Graph as the basis for a traversable, temporal chain of devices, dependencies, processes and services; Selector builds an operational twin from telemetry, routing and configuration, oriented to operation rather than to being the strategic model; Dynatrace discovers the software layer beneath the network completely and nothing above it. And the discovery and verification tools own the model of the IP and transport estate — IP Fabric, Forward Networks, NetBox, Kentik, Deepfield, Crosswork — and an assembly without them has a transport layer it cannot explain.
5.8 — 08 AGENTIC AI: products and frameworks
| Capability | Representative suppliers and tools | Native, integrated or developed | What to verify |
|---|---|---|---|
| 08.1 Specialised agents and investigation | Nokia’s agents on Gemini; Google’s autonomous network operations domain agents; Selector Rosetta and Foundry; Polystar’s assurance agents; RADCOM Neura; Ericsson AI intent-based operations | Native in products, within the product’s reach | What the agents are connected to; whether causality comes from engines |
| 08.2 Operational knowledge, RAG and history | Retrieval over the operator’s documentation, runbooks and incident history; the knowledge repositories 05.4 writes to | Developed | Whether historical incidents are retrievable at all |
| 08.3 Tool access and contracts | Conventional APIs; Model Context Protocol servers over the backbone, the model, the ITSM and the orchestrator | Developed per system | Each connection’s contract: structured input, attributed writes, authorisation outside the agent |
| 08.4 Recommendation and coordination (frameworks) | Google Agent Development Kit; LangGraph and LangChain; Gemini, Claude and Azure-hosted models; Microsoft Azure AI | Developed on the framework | Governance of writes and actions; precision measured per incident class before autonomy is extended |
The row divides into agents embedded in products and agents built on frameworks, and the question for both is what they are connected to. Nokia’s June 2026 partnership with Google Cloud embeds six specialised agents on Gemini in the Assurance Center — event triage, anomaly detection, performance monitoring and remediation recommendation among them — under transparent reasoning chains, autonomous action only for low-risk classes and human sign-off for anything that changes the core; they are connected to the suite’s own inventory, model and orchestration. Google’s framework places Gemini and an agent platform above the graph, with domain agents including a core voice-quality agent that One NZ has deployed and a radio agent that Deutsche Telekom runs in production in Germany; here the agents are connected to a graph the operator built. Selector’s Rosetta interface and Foundry framework follow the discipline that the language model explains and coordinates while causality comes from the engines, and its Lumen case study shows the division of labour: Selector consolidates and proposes (02), Itential executes under policy (04), ServiceNow brings the work to engineers and customers (03). Ericsson’s AI intent-based operations is the supplier with the strongest independent validation of a complete loop — TM Forum Level 4 validations with DNB, True Corporation, TDC NET and NBN Co — within its own domains. On the framework side an operator uses a frontier model behind an orchestration framework such as Google’s Agent Development Kit or LangGraph, with retrieval over its own documentation and tool access through APIs or the Model Context Protocol; the framework supplies the reasoning and coordination, and the operator supplies everything in the table of 08.3, which is the larger part of the work.
5.9 — 09 GOVERNANCE, SECURITY AND CONTROL: bought from several places, specified once
| Capability | Representative suppliers and tools | Native, integrated or developed | What to verify |
|---|---|---|---|
| 09.1 Identity, access and security | The operator’s identity and privileged-access platforms; cloud IAM; secrets management; masking and retention controls of the evidence platforms | Native, applied to automations and agents by configuration | Least privilege for every automation and agent identity; privacy of captures enforced by the mechanism |
| 09.2 Policies and autonomy control | Policy engines such as Open Policy Agent; the orchestrator’s policy layer (Itential, suite orchestration); ITSM approval workflows | Developed as policy as code | Run, ask or refuse evaluated per action class, element and moment; autonomy per incident class |
| 09.3 Audit, traceability and human control | ITSM records; orchestrator and automation logs; the decision log of the response platform | Native, integrated into one trail | Every decision reconstructible with evidence and identity; override and stop exist and are tested |
| 09.4 Observability of agents and automations | Tracing and evaluation tooling of the agent platforms (Google, Azure, framework tooling); automation run telemetry; the backbone for the metrics | Native in platforms, measured by the operator | Precision per incident class, drift, cost and rollback rate reported continuously |
Governance is the layer every supplier claims to support and none supplies whole. The identity platform knows the humans and has to be taught the automations and the agents; the policy engine evaluates what the operator wrote; the ITSM holds the approvals; the orchestrator refuses or throttles; the agent platform traces the runs. The operator’s job is to specify the controls of 4.9 once and to map each to the system that enforces it, so that an action proposed by a suite’s agent, a framework agent or an engineer passes through the same gate.
The market in families, mapped to the nine categories
Five coarse families are the usual way the market sorts itself, and three operational families complete them. Packet and session intelligence, integrated telco assurance suites, IT observability, multi-domain correlation and build-your-own platforms cover 01, 02, 06 and 07; event intelligence and incident response, ITSM and service management, and automation and orchestration cover 03 and 04. Verification (05) has no family of its own: it is performed by the evidence and assurance families reading the service indicators after an action, with the ITSM’s closure rules enforcing the result. Families are orientative groupings, not exclusive categories: a supplier can span several, and a family can contain technically very different solutions.
| Family | What it contributes to the cycle | Categories it mostly serves (01 to 09) | Representative examples in this article | What it needs from other families |
|---|---|---|---|---|
| Packet and session intelligence | Evidence at session and procedure depth: failing sessions, cause codes, protocol exchanges, subscriber context | 01; evidence for 02 and 05 | Ericsson embedded probes, Polystar Osix, RADCOM ACE, NETSCOUT, Gigamon as visibility fabric | Context to compute impact beyond the session; a backbone that joins it to everything else; a response layer to turn findings into work |
| Integrated telco assurance suites | A network and service model with engines on top: detection, correlation, impact, often orchestration and agents, within the vendor’s domains | 02 and 04; the model in 07; parts of 01 and 05 | Nokia Assurance Center and Unified Inventory; Ericsson Expert Analytics and intent-based operations in Ericsson domains | Evidence at session depth for other vendors’ functions; the ITSM as master record; domains outside the suite’s reach |
| IT observability | Discovery and causal diagnosis of the software and platform layer beneath the functions; logs, traces and metrics at scale | 01 and 02, for the platform layer | Dynatrace; Elastic and Splunk as search and analytics platforms; Zabbix as infrastructure monitor | Telco semantics — slices, sessions, functions — from a model it does not have; a causal layer where it is only a store |
| Multi-domain correlation | Episodes built from feeds it does not own: topology-aware grouping, probable cause with confidence, an operational twin derived from the operator’s data | 02; a derived model in 07 | Selector; the correlation functions of ServiceNow event management and BMC Helix at the IT layer | The feeds themselves; a model it did not derive, when the derived one is incomplete; an owner for the model it ends up holding |
| Build-your-own platforms | An operator-owned graph, detectors, causal models and agents, built on a cloud or data platform with or without a specialist | 02, 07 and 08 by construction; 05; parts of 04 through agents | Google Cloud framework with Spanner Graph; custom-build specialists; agentic frameworks | Everything, at the start: evidence, inventory, engineering, and time; later, the same response and execution families as everyone else |
| Event intelligence and incident response | Noise collapsed into incidents, enriched, prioritised, routed to an owner and coordinated across teams and suppliers until resolution | 03 | PagerDuty; ServiceNow event management; BMC Helix Operations Management; Splunk ITSI for service-based alerting | Structured diagnoses and impact from the understand families; the ITSM as master record; executors for its response workflows |
| ITSM and service management | The master record, states, relations between incident, problem and change, the service-customer chain and the audit | 03; closure in 05 | ServiceNow ITSM with TNI and TSOM; BMC Helix ITSM; Jira Service Management | Detection and diagnosis it does not perform; synchronised identifiers from the response layer; verification results from the assurance families |
| Automation and technical orchestration | Pre-checks, authorisation by action class, execution across controllers and pipelines, post-checks and rollback | 04 | Itential; Nokia and Ericsson orchestration in their domains; StackStorm, Ansible, Jenkins and low-code platforms as engines | Authorised decisions with explicit success criteria; the model, to know what an action touches; verification by someone other than itself |
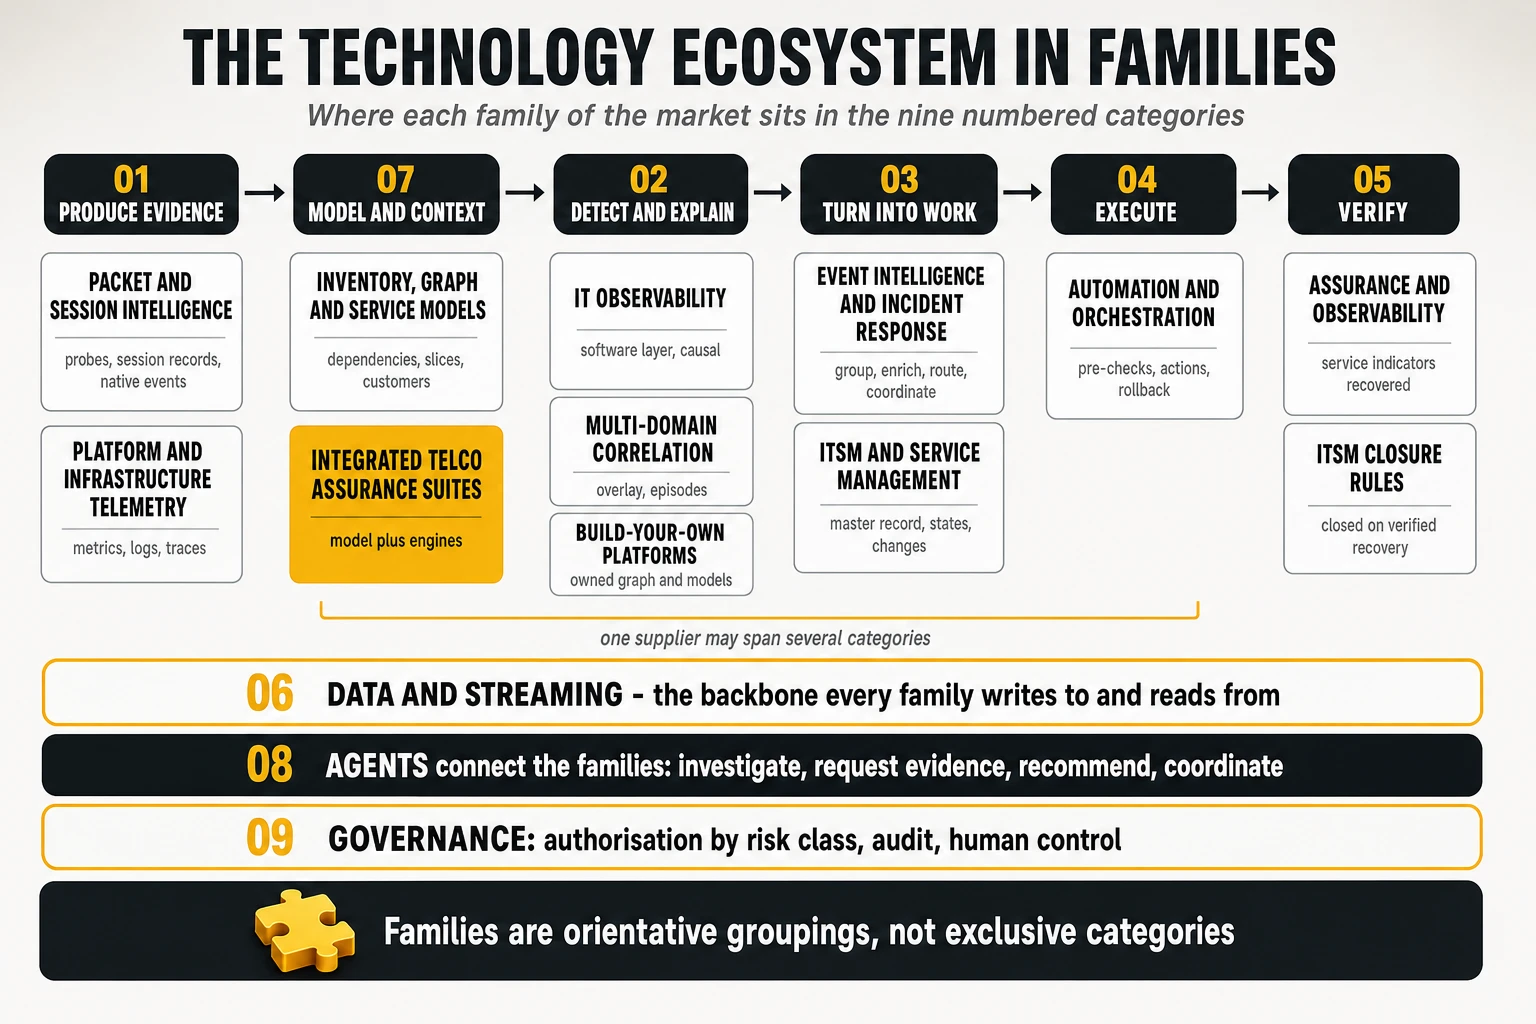
The map is useful for one reason: it makes the dependencies between families explicit, and those are what a procurement that buys one family at a time discovers afterwards.
- An evidence platform (01) needs context (07) to compute impact: the session says nothing about the contract behind the slice.
- A root cause engine (02) needs an updated topology (07) and the relevant signals (01, 06): its explanations are exactly as good as the model it traverses.
- An ITSM (03.3) needs structured diagnoses and operational states (02, 03.1): a record filled in by hand after the investigation describes the ticket, not the incident.
- An agent (08) needs tools, knowledge and controlled permissions (08.3, 08.2, 09): without the first it summarises, without the second it guesses, without the third it is a risk.
- An orchestrator (04) needs authorised decisions (09.2) and explicit verification criteria (05): executing is the easy part.
- An integrated platform can cover many categories and still needs to interoperate with the domains and processes outside it: no estate ends where a suite’s model ends.
Supplier positioning: core strengths, boundaries and ownership of operational intelligence
The tables above say who provides what, capability by capability; this one answers a different question for each supplier: what is it built around, what else does it provide, what should not be expected of it, where does the model and the accumulated knowledge end up, and what dependency does it create. The first column gives the supplier’s primary categories. Entries are TelcoCrux assessments; capabilities that exist only in commercial material are marked as described; the “what it does not replace” column states boundaries, not criticisms, most of which the suppliers would draw themselves. It is not a ranking.
| Primary categories | Supplier or platform | Core capability or centre of gravity | Additional capabilities provided | What it does not replace | Where the network model and operational knowledge reside | Main integration dependency or lock-in consideration |
|---|---|---|---|---|---|---|
| 07 / 02 / 04 | Nokia (Assurance Center, Unified Inventory, Orchestration Center, agents) | The network and service model, and a closed loop computed over it, across the domains the suite covers | Native: detection, correlation, service impact analysis, orchestration; agents described on the suite’s own tools; inventory as the model’s spine | A neutral backbone for other vendors’ cores; an evidence producer at session depth for functions it does not supply; the ITSM master record | In Nokia’s platform: model, correlation logic, root cause and automations; the operator keeps the data, the vendor keeps the intelligence unless contracted otherwise | Suite-wide coupling: changing any engine means re-hosting the model; the highest exit cost of the table, and the shortest integration path inside its domains |
| 01 / 02 | Ericsson (embedded software probes, Expert Analytics, AI intent-based operations) | Evidence produced from inside its own functions, and subscriber-level analytics on it | Native: detection and impact in its domains; a framework-validated intent-based closed loop for defined assurance scenarios; radio and core traces | A transversal model for a heterogeneous estate; event intelligence, incident response or ITSM; evidence for other vendors’ functions | Inside Ericsson platforms, within Ericsson domains; event formats are the vendor’s and the parsers’ know-how stays with it | Domain-bound: strongest where the network is Ericsson’s, dependent on export to the operator’s backbone to be more than that |
| 01 / 06 / 02 | Polystar (Osix monitoring, Kalix analytics and data layer) | Session evidence plus the data layer that joins it to counters and other feeds | Native: detection, cross-domain correlation, customer-first impact; agents and natural-language assistance as described in vendor material | A master inventory or knowledge graph; the ITSM; an orchestrator | Distributed across the operator’s systems and consolidated for analysis in the platform; data exportable, analytics logic platform-bound | Moderate: the data layer is an asset if its schema is open and a dependency if it becomes the only place the joins exist |
| 01 / 02 | RADCOM (ACE, Neura) | Cloud-native session evidence for the packet core and voice | Native: detection within the core; guided remediation and agent-assisted troubleshooting as described by the vendor | The end-to-end service model; incident response; impact beyond the sessions it sees | Session records and analytics in the vendor platform — a sensor with intelligence, not the brain | Evidence format and retention in the platform; moderate, provided session records can be exported to the backbone |
| 01 | NETSCOUT (nGeniusONE, Omnis) | Session evidence across every network generation, and the installed estate that produces it | Native: service monitoring and troubleshooting; curated, AI-ready data as the current positioning; virtual instrumentation for cloud cores | Inventory, graph, statistical correlation or autonomous root cause; the response and execution layers | Session records in the vendor platform; the model of the network stays with the operator | Installed-base inertia and evidence format; low architectural lock-in, high operational dependence where it is the only source of sessions |
| 02 / 07 | Selector | Correlation and root cause over feeds it does not own, expressed as episodes with probable cause | Native: an operational twin derived from the feeds; detection; natural-language access; agents and decision support; published as the understanding lane in a three-vendor assembly | A probe; a master inventory; telco depth at session and procedure level; the ITSM; execution | A derived model in the overlay, above the operator’s systems; the knowledge of how episodes are formed is the platform’s | The derived twin becomes the de facto model if nobody owns the reference one; moderate, and governable by keeping the inventory authoritative |
| 07 / 02 / 08 | Google Cloud (Autonomous Network Operations framework, Spanner Graph, agents) | A model the operator owns, and the analytics and agents trained on it | Once built: detection, correlation, impact, agentic investigation and action, with published operator outcomes | A product; a probe; a telco-semantic suite on day one; the response and ITSM layers | In a graph the operator owns, on Google infrastructure; the ontology, the models and the agents are the operator’s | Cloud platform dependence and the operator’s own engineering capacity; the lowest supplier lock-in and the highest build obligation |
| 03 / 07 | ServiceNow (ITSM, ITOM event management, TNI, TSOM) | The master record, the service-customer chain and the workflow that moves work between people and systems | Native: event deduplication, correlation and probable cause at the event layer; service mapping; telecom inventory; service operations impact; incident, problem and change | A deep sensor of the core; a statistical detection engine on function events; a network orchestrator | In the operator’s instance: data portable, workflows and logic platform-bound | Platform-bound workflows accumulate; the record is the operator’s, the way it moves is the vendor’s |
| 01 / 02 (platform layer) | Dynatrace | The software and platform layer beneath the functions, discovered automatically and causally modelled | Native: detection and root cause for that layer; logs, traces and metrics at scale; topology of the platform | Anything that understands a slice, a session or a network function as telco objects; the ITSM; execution | In the vendor platform, for the platform layer only | Proprietary data model; moderate, bounded by the layer it covers |
| 03 / 04 | PagerDuty (incident response, event orchestration, runbook automation) | Incident response: on-call, routing, escalation, response workflows and coordination across teams | Documented: event orchestration and alert grouping for noise reduction; runbook automation through runners; bidirectional ITSM integrations | Causal root cause over sessions and protocols; the ITSM master record; the network model; verification of experience | Incident and response history, routing rules and workflows in the platform; the diagnosis comes from elsewhere | Integration quality is the value; moderate, with exportable records and a risk of duplicated tickets if the master is not decided |
| 03 | BMC Helix (Operations Management, ITSM) | Event management with AIOps and ITSM from one vendor | Native: noise reduction (up to 90%, a vendor claim), service models, proactive ticketing, automation hooks | Telco-session evidence; statistical detection on function events without feeds; the network model of a core | Service models, correlation rules and records in the Helix platform | Suite-style coupling between operations management and ITSM; exit cost concentrated in workflows and rules |
| 04 | Itential | Network automation orchestration: pre-checks, approvals, execution across controllers and APIs, post-checks and rollback, with results written to the ITSM record | Documented: ServiceNow-integrated workflows; standards-aligned service interfaces; published as the acting lane in a three-vendor assembly | The decision about what to fix; verification of experience; the ITSM; the network model, which stays in controllers and inventories | Workflows and integrations in the platform; the network knowledge in the systems it orchestrates | Workflow portability; moderate, with low coupling to any single controller |
| 04 | General-purpose automation engines (StackStorm, Ansible, Jenkins, low-code platforms) | Executing tasks and workflows, often event-driven, over anything with an API | Native: sensors, triggers and rules; configuration pipelines; integration packs; wide community coverage | Authorisation by action class, pre-checks and rollback governance unless the operator builds them; the decision; the verification | Playbooks and workflows as code, owned by the operator | Low lock-in, high maintenance burden; needs an orchestration and governance layer above it to be safe in operations |
| 06 | Data platforms (Elastic, Splunk, StarRocks, Kafka) | The backbone: streaming, search, analytics and storage at scale | Native: dashboards, rule-based alerting, some statistical detection; service-based alerting in Splunk ITSI | The brain: causal root cause, the telco model, service impact; a probe | Data and schemas in the operator’s platform, owned by the operator | Volume-based cost and operational effort; moderate, with the risk of being declared the brain because the data is already there |
| 08 | Agentic frameworks and model providers (LangGraph and LangChain, Azure AI, Claude) | Building agents with tool access, retrieval and orchestration of reasoning; protocols for tool connection | Native: investigation, summarisation, coordination, natural-language interfaces; evaluation and tracing of agent runs | Detection engines; the model of the network; authorisation; the systems the agents call | Skills, prompts, knowledge and contracts in the operator’s repositories; the model weights are the provider’s | Low for the framework, provider-dependent for model quality; portable if the skills are code and the contracts are explicit |
| 07 / 02 / 08 | Custom-build specialists | The operator’s own ontology, models, detectors and workflows, built to its estate | As built: any of the understanding and learning capabilities, and the integration glue the others need | A product with a roadmap; a supplier that maintains the result when the engagement ends | With the operator, if the contract was written that way; with the specialist’s people otherwise | Dependence on knowledge transfer and on the operator’s capacity to maintain what was built |
Where the accumulated knowledge resides has to be answered artefact by artefact, because the answer differs for each and the contract usually covers only one.
- Inventory and data (07.2, 06): almost always the operator’s in law and usually exportable in practice.
- Ontology (07.4): the operator’s if it wrote it, the suite’s if the suite shipped it, nobody’s if it emerged inside a derived model.
- Knowledge graph (07.4): the content is the operator’s; the structure and the queries belong to whoever designed them.
- Correlation rules and diagnostic models (02.3, 02.4): the least portable artefacts in the system; a decade of tuning can be lost at a renewal.
- Runbooks (04.3): portable as documents or code, not as workflows in a platform’s proprietary format.
- History and context (03.3, 08.2): portable as records, worthless without the schema that gives them meaning.
- Skills and agents (08): code when the operator wrote them on an open framework, features when a product supplied them.
Three questions separate cases that look alike: who owns the artefact legally, who controls it operationally day to day, and what it would cost to move it. A supplier that answers the first generously may still hold the operator by the second and the third.
Where the capabilities overlap, and how to avoid buying one job twice
Six overlaps account for most duplicated purchases, and the test is the same for all: two tools are complementary when they serve different numbered capabilities over the same incident, and duplicated when they serve the same capability with different models.
- PagerDuty against ServiceNow and BMC (03.1 to 03.3). All three group, route, escalate and can hold an incident. Complementary when one is the live response layer (03.2) and the other the master record (03.3) with synchronisation in place; duplicated when both run alert grouping (03.1) over the same monitors with different rules.
- Selector against the engines inside assurance suites (02.3, 02.4). Complementary when the suite’s engine works within its own model and Selector correlates across everything the suite does not see; duplicated when both are asked to be the cross-domain brain, which produces two probable causes.
- Nokia and Ericsson against independent components (02, 04, 07, 08). A suite includes inventory, engines, impact, agents and orchestration; adding an independent correlator, impact engine and orchestrator buys each twice, unless they cover domains the suite does not.
- Itential against general automation tools (04.3, 04.4). Complementary when the general tool triggers and chains while the network orchestrator executes the domain-specific change with its checks; duplicated when both hold network procedures with different pre-checks.
- Agentic platforms against agents inside products (08). Complementary when the framework agent coordinates across suites and the embedded agents investigate inside them; duplicated when both own the investigation of the same incident.
- Data platforms against correlation engines (06 against 02). Resolved by the backbone-versus-brain test of 4.6: the backbone is kept as the neutral layer, and its candidacy as the engine is decided on the same evidence as the engines’.
In every case the architecture document names, for each of the numbered capabilities 01.1 to 09.4, exactly one system of record and lists the others as feeders or consumers.
Where the model lives, and who controls the operational knowledge
The dimension procurement committees most consistently under-weight is the one that matters most over ten years: where the model (07), the operational knowledge (08.2), the automations (04) and the agents’ accumulated reasoning live, and therefore who controls the chain from data to model to intelligence to action. Positioned on two axes — how much telco knowledge the supplier brings on day one, and how much of the resulting model the operator ends up owning — the suppliers spread out as the map below shows. The question to ask in every meeting is what the operator keeps if the contract ends: the data, the model, the runbooks, the knowledge, or all of them.
| Supplier type | Where the model and knowledge live | What the operator keeps if the contract ends | Realistic exit cost |
|---|---|---|---|
| Integrated telco suite (Nokia, Ericsson in its domains) | The vendor’s inventory, assurance model, agents and orchestration | Raw data; little of the model or logic | High — conceptual lock-in in proportion to success |
| Evidence platform (Polystar, RADCOM, NETSCOUT) | Session records and analytics in the vendor platform | Data and indicators; not the analytics | Moderate — replacing a sensor, not a brain |
| Correlation overlay (Selector) | Operator systems, with an operational knowledge layer above | Sources unchanged; correlation logic lost | Low to moderate |
| Graph platform (Google) | A graph the operator owns, on the platform’s infrastructure | Schema, models and history | Moderate — portable data, cloud dependence |
| Incident response and ITSM (PagerDuty, ServiceNow, BMC, Jira) | Records in the operator’s instance; workflows platform-bound | Records and history; workflows rebuilt | Moderate — process re-implementation |
| Automation platforms (Itential, PagerDuty, StackStorm, Ansible) | Runbooks and workflows as code, where the contract allows | The code, if written that way | Low to moderate |
| Agent frameworks (LangGraph and a frontier model) | Prompts, skills, tool contracts and knowledge in the operator’s repositories | Everything but the model weights | Low — models are interchangeable behind the framework |
| Custom-build specialists | Whatever the engagement built, in the operator’s estate | All of it, if the contract was written that way | Low, provided code and ontology are the operator’s |
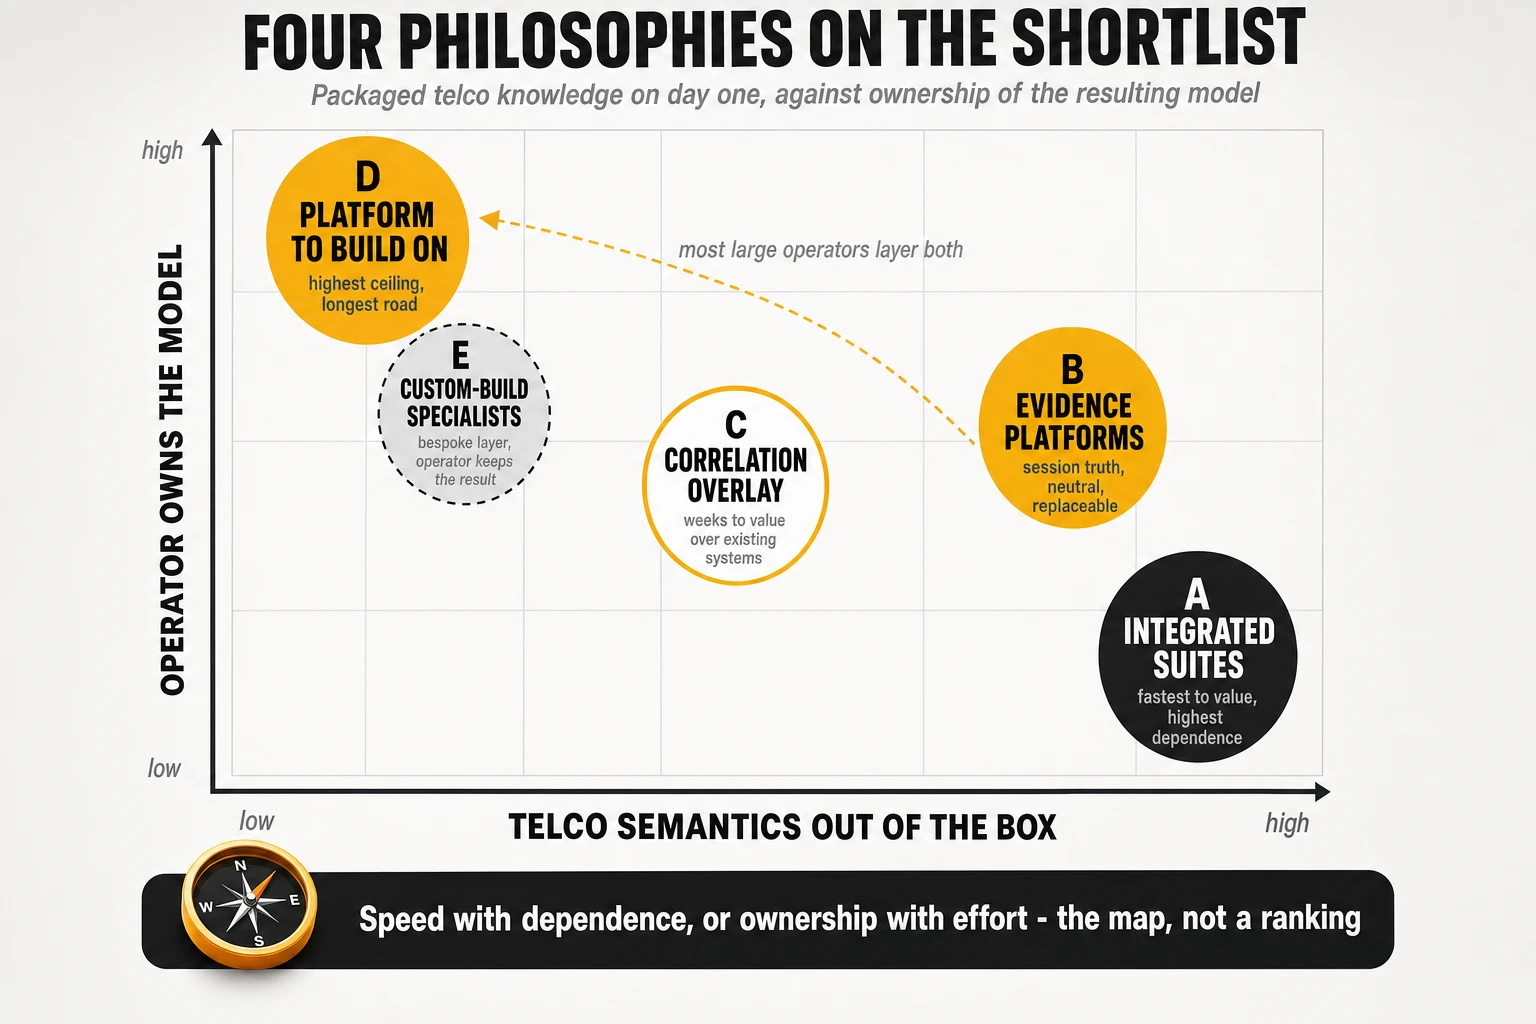
6. Four ways to assemble the architecture
The categories of section 4 and the suppliers of section 5 assemble into four architectures that hold together, and the operators that have published results did not treat the choice as a vendor selection: they decided, category by category, who would own each of the nine. The same functional structure runs through all four. What changes is who owns each category and, above all, two things: who holds the model (07) and who holds the master incident (03.3). Those two decide the exit cost and the integrity of the operating model, and they deserve to be settled before any product is shortlisted.
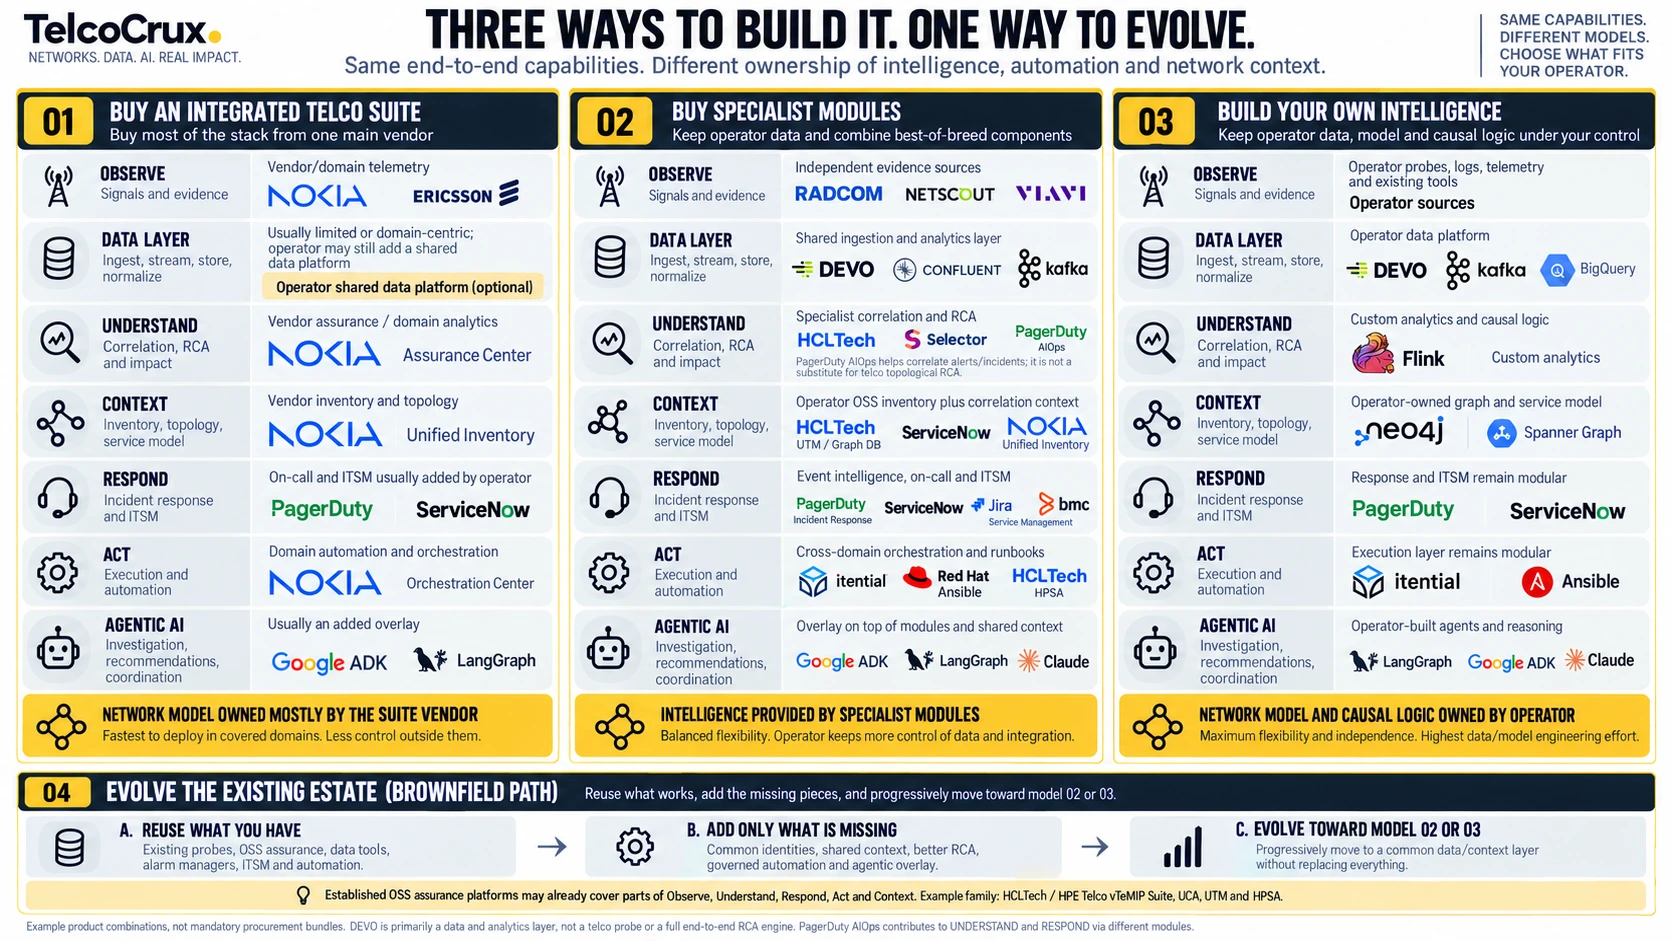
| Category | Integrated telco suite | Evidence platform plus AIOps overlay | Evidence platform plus operator-owned graph | Existing estate plus integration and agentic overlay |
|---|---|---|---|---|
| 01 OBSERVE | Suite mediation and the suite vendor’s probes or embedded events in its domains | Independent evidence platform: session records, native events, selective capture | Independent evidence platform, feeding the operator’s backbone directly | Existing element managers, monitors, logs and any probes already deployed |
| 02 UNDERSTAND | Suite assurance engine and service impact over the suite model | Overlay engine for detection, correlation and root cause; impact via the derived model reconciled with the ITSM service map | Operator-built detectors and causal models over the owned graph; impact walked from element to commitment | Existing monitoring with statistical baselines added; existing event-management correlation with a causal layer added; impact from the ITSM service model extended with the chain |
| 03 RESPOND | Suite alarm and event management handing over to the operator’s ITSM, which stays master | Incident response platform or ITSM event management; operator’s ITSM master | Incident response platform or ITSM event management; operator’s ITSM master | Existing event management or response platform; existing ITSM master |
| 04 ACT | Suite orchestration plus domain controllers | Network orchestrator and automation engines under the orchestrator’s policy | Network orchestrator and automation engines, invoked by agents through contracts | Existing automation tools placed under one orchestrator’s authorisation and pre-checks |
| 05 VERIFY AND LEARN | Suite assurance engine against service indicators; ITSM closure rule | Overlay plus evidence platform indicators; ITSM closure rule | Owned graph plus evidence indicators; ITSM closure rule | Existing assurance and monitoring, with ITSM closure rules enforcing the checks |
| 06 DATA | Suite data layer, with the operator’s backbone receiving a copy | Evidence platform store plus the operator’s backbone for everything else | Operator backbone: streaming, operational and historical stores, analytics store | Existing data platform, extended where identity resolution and latency fall short |
| 07 CONTEXT | Suite inventory and service model | Operator’s inventory plus the overlay’s derived model | Operator-owned knowledge graph with its own ontology | Existing CMDB and inventories, reconciled into one chain |
| 08 AGENTS | Suite agents within the suite’s reach; framework agents beyond it | Overlay agents plus framework agents connected through the model and the tools | Operator agents on an agentic framework, with tool access through protocol servers | Framework agents over the existing tools; product agents where a product has them |
| 09 GOVERNANCE | ITSM approvals plus the suite’s own policy for its domains | Orchestrator policy plus ITSM approvals | Operator policy engine, ITSM approvals, agent platform tracing | Existing identity and ITSM approvals plus a new policy layer over the orchestrator |
Integrated telco suite
One telecom vendor supplies 01, 02, 04, 07 and 08 for the domains it covers; the operator attaches 03, the remaining domains and its own 09. It fits an operator whose network is dominated by that vendor’s domains, whose operations team is small relative to the estate and who values the shortest integration path over independence. Reused: the ITSM, the CMDB, the response platform. Acquired: the suite, module by module. Developed: the federation of the domains the suite does not reach, which always exist. The integrations that cannot be skipped are the master record with identifiers mirrored both ways and an orchestrator path for the domains outside the suite.
The model (07) lives with the suite vendor, which is the assembly’s defining property rather than a defect. The master incident must still be the ITSM, because the suite’s reach ends at its domains and the incident does not. The authorisation policy (09.2) has to be expressed once and enforced in two places. Supplier dependency is the highest of the four, and the operator pays for it at the first renewal: anything the suite learned about the network is the suite’s unless the contract says otherwise.
Evidence platform plus AIOps overlay
An independent evidence platform observes (01), a correlation overlay understands (02), and the operator’s response platform, ITSM and orchestrator complete 03, 04 and 05. It fits a multi-vendor operator that already has, or is about to buy, a session-level evidence platform and wants a correlation engine that belongs to no network vendor. Reused: the evidence platform, the ITSM, the response platform, the automation tools. Acquired: the overlay and usually an orchestrator with pre-checks and rollback. Developed: the feeds into the overlay and the contract between its recommendations and the record.
The model (07) lives in the overlay, derived from the operator’s inventory, and the operator has to decide early whether that derived model is the reference or a working copy. If the overlay’s model becomes the only place where dependencies are complete, the operator has recreated the suite’s exit cost with a different logo. The overlay recommends and must not execute, even when it can; the agentic loop connects at the overlay’s model and at the record, with tool access through the orchestrator rather than around it.
Evidence platform plus operator-owned graph
The evidence platform stays (01); the overlay is replaced by a knowledge graph, detectors and agents the operator owns (02, 07, 08), usually built with a cloud provider’s framework or a custom-build specialist. It fits an operator with a data engineering organisation, a strategy of owning its operational knowledge and the patience to build the model before anything on it. Reused: the evidence platform, the ITSM, the response platform, the automation tools. Acquired: the data platform, the graph store, the agentic framework. Developed: almost everything that makes it work — the ontology, identity resolution, detectors, causal models, skills, contracts.
The model lives with the operator, which is the point, and the price is that the operator owns its accuracy. The agentic loop connects more deeply here than anywhere else, because the agents and the graph share an owner, and that is why 09 matters most here: an operator that can build agents that execute will be tempted to let them, and the authorisation gate has to be designed before the first agent is written. Supplier dependency is the lowest of the four; the dependency on the operator’s own engineering is the highest, and that is a cost to estimate honestly.
Existing estate plus integration and agentic overlay
A mature operator already owns most of the nine categories, and its problem is rarely the absence of a platform. It has alarm management, monitors, a data platform with years of logs, a CMDB, an ITSM with thousands of records, automation that has run for years, and often an AI platform with agents in pilot. What it typically lacks is four things no product supplies on its own: a common model with resolved identities (07, 06.2), the integration that makes an incident one object rather than six (03.3), the coordination that moves it across teams without losing evidence (03.2), and the statistical detection most legacy monitoring never had (02.1). Assembling the cycle on the existing estate is an integration programme first, a modelling programme second and a procurement exercise last.
| Category | What a mature operator usually has | Typical gap | What the overlay adds |
|---|---|---|---|
| 01 OBSERVE | Element managers, telemetry collectors, syslog, probes in parts of the network, application logs | Native function events not collected; sessions and flows not joined; evidence latency never measured | Event collection from the functions; latency measured per source (4.1) |
| 02 UNDERSTAND | Threshold alarms, some anomaly detection in application monitoring, rule-based correlation in the event console | Nothing detects slow drift; correlation by time and text, not topology; no probable cause with confidence; no burn rate | Statistical baselines and change-point detection in shadow mode; topological correlation; a causal layer with confidence (4.2) |
| 03 RESPOND | An event console, an on-call rota, escalation by phone and chat, a bridge for major incidents, a full ITSM, often several after mergers | Noise collapse and enrichment by people; routing by team not by service; tickets created late and by hand; identifiers not mirrored | Grouping, enrichment, service-aware routing and response workflows; one master record with synchronised identifiers (4.3) |
| 04 ACT | Configuration pipelines, scripts, workflow automation, a low-code platform | Actions without pre-checks or rollback; no action classes; authorisation implicit in who runs the script | One orchestrator that owns pre-checks, authorisation by class, execution and rollback over the existing tools (4.4) |
| 05 VERIFY AND LEARN | Closure by the engineer’s judgement; recovery assumed from the absence of alarms | Execution success taken as recovery; no reopen metric; nothing feeds baselines or runbooks | The six checks enforced as closure rules; reopen and learning outputs recorded (4.5) |
| 06 DATA | A log platform or data lake with years of history, dashboards, ad hoc queries | Search and analytics mixed; no streaming path; no operational store with sub-minute freshness; identities unresolved | A streaming layer and an operational store beside the historical one; identity reconciliation; the backbone-versus-brain test applied (4.6) |
| 07 CONTEXT | A CMDB, a network inventory, service catalogues, spreadsheets that fill the gaps | Inconsistent identifiers; dependencies missing between layers; accuracy unknown; no service and customer links | Reconciliation into one chain, a measured accuracy figure and the discipline to keep it (4.7) |
| 08 AGENTS | An enterprise AI platform, chat assistants in pilot, perhaps retrieval over documentation | Agents without tool access, without the model and without a contract; investigation not attached to the record | Agents connected to the model, the evidence, the changes and the tools through contracts, writing into the record (4.8) |
| 09 GOVERNANCE | Identity management for people; change approvals in the ITSM; audit scattered across tools | No identities for automations and agents; no policy engine; autonomy undefined per class; no agent telemetry | Identities for automations and agents; policy as code; a single decision log; agent and automation observability (4.9) |
The order of work follows the dependencies between the gaps, and the agents come last for a reason.
- First, 06.2 and 07: identity resolution and the dependency chain, because every category above them is bounded by their quality.
- Second, 03.3: the master record and its synchronisation, which turn the incident into one object every other system can enrich.
- Third, 02 in shadow mode: statistical detection and topological correlation, so that their precision is known before anything acts on them.
- Fourth, 04 and 09: the orchestrator’s authorisation and pre-check layer over the existing automation, not replacing it.
- Only then, 08: agents add value when there is a model to read, a record to write into, evidence to request and tools to call under contract.
Two risks are specific to this assembly, and both are organisational before they are technical. The integration overlay, which begins as glue, quietly becomes the brain: once correlation, enrichment and recommendations run in one place, that place owns the model whether anyone decided it or not, so the operator names the owner of 07 explicitly, in a system it controls. And the owners of the existing systems each measure success in their own terms; the cycle only improves if all of them are measured on the end-to-end metrics of section 8. Where the operator has the right people, this is the assembly with the lowest supplier dependency and the best use of sunk cost; where it does not, it is the one most likely to produce an elegant design that never closes an incident.
What all four assemblies have in common
Four properties hold in every assembly that works. An assembly in which any of them is missing is not a variant but a mistake.
- The ITSM is the master record (03.3), whatever platform coordinates the response, because that is where incident, problem and change meet and where the audit lives.
- Event intelligence and incident response (03.1, 03.2) coordinate but do not become the master and do not decide causes.
- Agents (08) investigate, recommend and coordinate but do not own the model, do not own the truth and do not authorise; their execution requests pass through 09.2 like everyone else’s.
- Verification (05) is performed against service indicators and the affected customers’ recovery, with execution success as one of six checks and never as the closure criterion.
Everything else — which vendor supplies which engine, where the graph is stored, which framework the agents are written in — is a legitimate difference between operators. These four are not.
Comparing the four assemblies: time to value, complexity, dependency and fit
The nine-category table says who does what; the comparison below says what each assembly costs in time, complexity, capability and dependency, and it is the table on which the choice is made. Every time reference is an orientation conditioned on the starting point — an operator with a clean inventory and resolved identities is months ahead of one without, whatever it buys — and none is a guarantee. Time to initial value is measured to the first operational outcome that changes how a team works, not to the first dashboard; time to end-to-end maturity to the point at which all nine categories run with one master record, governed execution and verified closure.
| Criterion | Integrated telco suite | Evidence platform plus AIOps overlay | Evidence platform plus operator-owned graph | Existing estate plus integration and agentic overlay |
|---|---|---|---|---|
| Time to initial value | Months inside the suite’s domains, if the inventory it inherits is clean; longer wherever the data has to be cleaned first | Months, once the evidence platform and the feeds exist; the overlay’s first episodes arrive quickly | Quarters to a year before the first outcome, because the model and the identity resolution come before any analysis | Months for the first integrated use case, provided identity resolution and the master record are done first |
| Time to end-to-end operational maturity | Quarters within the suite’s domains; the boundaries with other domains and the ITSM integration set the real date | Quarters, paced by the ITSM contract and the orchestrator’s governance layer | Years, in which the model, the detectors, the agents and the governance are built in sequence | Quarters to years, dominated by integration effort and by aligning the owners of the existing systems |
| Integration complexity | Low inside the suite, high at its edges: the ITSM, the orchestrator for other domains, the evidence for other vendors’ functions | Moderate: feeds into the overlay, the overlay’s contract with the ITSM, the orchestrator | High: every connection is a contract the operator writes and maintains | Highest: many existing systems, each with an owner, a data model and a history |
| Required internal engineering capability | Low to moderate: configuration and integration at the edges | Moderate: data engineering for the feeds, integration, model governance | High: data engineering, graph and ontology design, machine learning, agent development, platform operations | Moderate to high: integration engineering, identity resolution, modelling, and the organisational work of aligning owners |
| Vendor dependency | Highest, concentrated in one supplier | Moderate and distributed across several suppliers | Lowest on suppliers; high on the cloud platform and on the operator’s own team | Low on any single supplier; the dependency moves to the integration layer and its owner |
| Ownership of operational knowledge | The suite’s, unless contracted otherwise | Shared: the derived model and the episodes are the overlay’s, the inventory is the operator’s | The operator’s, in full, including the obligation to keep it accurate | The operator’s, if the integration layer is governed; the overlay’s, if it is allowed to become the brain |
| Potential to reuse the existing estate | Low to moderate: the suite replaces what it overlaps and keeps the ITSM | Moderate to high: the evidence platform, the ITSM, the response platform and the automation tools remain | Moderate: the evidence platform and the operational systems remain, the understanding layer is rebuilt | Highest by design: the point of the assembly is to add what is missing and nothing else |
| Multi-vendor and multi-domain adaptability | Limited to the suite’s domains; federation for the rest | High, because the overlay is indifferent to the source of the feeds | High, because the ontology is the operator’s and can describe any domain | High but uneven, inheriting the coverage gaps of the existing tools |
| Ability to evolve towards closed-loop operations | High within the suite’s domains, where framework-validated loops already exist; dependent on federation outside them | Moderate: the overlay recommends, and the loop depends on the orchestrator’s governance and the ITSM integration | High once built: agents, graph and orchestrator under one owner; the governance band has to precede the first loop | Moderate: the loop is only as governed as the orchestration layer placed over the existing automation |
Five trade-offs run through the table, and naming them is more useful than scoring them.
- Initial speed against technological dependency: the suite is the fastest road inside its domains and the hardest to leave.
- Integrated product against flexibility: the suite’s model is coherent and bounded; the assembled architectures are adaptable and have seams.
- Building against the engineering it demands: the owned graph gives the operator everything and asks it to become, in part, a software company.
- Reusing the estate against integration complexity: the fourth assembly spends least on licences and most on connecting systems whose owners have never had to agree on an identifier.
- Autonomy against investment in models, tests and governance: in every column the closed loop arrives only after the model is accurate, the detectors are measured and 09 exists; the assembly that promises it sooner has skipped one of the three.
Read against the operator’s own maturity, assets and capability, the table resolves into a short set of fits. A network dominated by one vendor’s domains, a small operations team and a priority of a working loop within the year fits the integrated suite; negotiate the ownership of the model and the ITSM boundary. A multi-vendor estate with a session-level evidence platform and a modest data team fits the overlay; decide before signing whether the derived model is a working copy or the reference. A data engineering organisation with a strategy of owning its knowledge fits the owned graph; budget the people honestly. And an operator that already owns most of the categories — most large operators — fits the fourth assembly; begin with the gap analysis, not with a request for proposals. The most sophisticated assembly is not the best one for most operators.
The same incident, six complementary technology perspectives
The most revealing way to see why the families are complements is to take one incident and follow it through each technology perspective rather than through the process. The incident is the silent user plane degradation the article keeps returning to, as an illustrative scenario and not a measured case: the load on one instance climbs from 60% to 82% over two hours, PFCP retransmissions rise, session establishment success drifts from 99.7% to 99.1%, the degradation is concentrated in certain slices, and no conventional threshold produces a relevant alarm. This subsection answers what each technology contributes and what it cannot establish alone. Section 7.1 answers a different question — how the complete incident traverses the sixteen steps — and both are needed: an operator that knows the process but not what each technology contributes buys the wrong pieces; one that knows the pieces but not the process connects them in the wrong order.
- Evidence and session intelligence (01, parts of 02) probably sees it first: within minutes it has a significant deviation, the failing sessions with their cause codes, the common element, the affected slices and the subscribers behind each session. What it lacks is everything on the far side of the slice — the contracts, the change of the previous evening, the platform’s state — and therefore both the complete cause and the contractual impact.
- The AIOps and correlation overlay (02, derived 07) probably correlates the noise best: cluster metrics, PFCP counters, platform events, latency and session statistics become one episode with a probable cause — overload after the deployment — and a confidence. It cannot show the rejected sessions, because it is not the probe, or name the customers unless the topology it was given reaches that far.
- The integrated telco suite (02.5 over its own 07) probably computes the impact best and most directly: function to slice to service to customer to commitment, as a query rather than a project, with a mitigation proposed through its own orchestration. The walk is only as complete as the model the suite holds, which ends at its vendor’s domains.
- Subscriber-level analytics (02.5 per subscriber) says who, where and on what: the subscribers, devices, areas and customer groups affected — the difference between “the slice is degraded” and “these four hundred corporate devices in two cities are failing to attach” — and in its own domains it can execute a validated mitigation with rollback. Outside those domains it has no subscribers to name.
- Packet and signalling probes (01.5) show the PFCP exchange and the procedures at the deepest level of any perspective, and are the proof the others cite: whether the instance rejects sessions under memory pressure, a transport fault or a misbehaving peer is a question the exchange answers. They do not compute impact, correlate the change or rank the customers; and here a capture opened on demand for ten minutes with the right filters would have provided the proof.
- The operator-owned knowledge graph and models (07, 02, 08) could produce the most sophisticated analysis of all — the instance against its peers and its history, the deployment as a change on an adjacent node, a trained model concluding that this instance best explains the pattern — provided the whole of 4.7 has been built beforehand. That “provided” is measured in quarters of engineering, which is why it is the last perspective most operators acquire and the one they value most once they have it.
| Technology perspective | What it detects or explains | Evidence or model it uses | What it contributes to the incident | What it cannot establish alone | Complementary capability it needs |
|---|---|---|---|---|---|
| Evidence and session intelligence | A statistically significant deviation in session success on one instance, minutes after it begins | Session records, PFCP exchange, per-instance indicators, subscriber context | The failing sessions with cause codes, the common element, the affected slices and subscribers | The contracts behind the slices, the change that preceded the symptom, the platform’s state | Service context and change records; a correlation layer |
| AIOps and correlation overlay | One episode with a probable cause and a confidence | Cluster metrics, counters, alarms, platform events, latency and session statistics, a derived model | Structure: forty alerts become one incident with a hypothesis, alternatives and evidence | The rejected sessions themselves; the customers, unless its topology reaches them | The original evidence source; an authoritative inventory |
| Integrated telco assurance suite | The impact, walked from function to slice to service to customer to commitment | Its own network and service model | The incident expressed in business terms, ranked by contractual exposure, with a proposed mitigation | Anything outside its model and its vendor’s domains; session depth for other vendors’ functions | External evidence producers; the ITSM as master; federation for other domains |
| Subscriber-level analytics | Which subscribers, devices, areas and customer groups are affected | Subscriber-level events and traces in its domains | The view customer care and the account team need; a validated mitigation with rollback in its domains | The cause, beyond its evidence; anything outside its domains | Cross-domain correlation; the service model for commitments |
| Packet and signalling probes | What is really happening in the procedures and messages | The PFCP exchange and the session signalling, permanent or on demand | Proof: confirmation or refutation of the hypothesis at protocol level | Impact, the related change, the ranking of customers | A trigger and filters from the detection and investigation layers; the dependency model |
| Operator-owned knowledge graph and models | The instance against its peers and its history, the adjacent change, the cross-domain dependencies | The owned graph with resolved identities and time series; trained detectors | The most complete explanation, across domains, and the knowledge that stays with the operator | Anything, before the model, the identities and the history have been built | Evidence producers; engineering time; the same response and execution layers as everyone else |
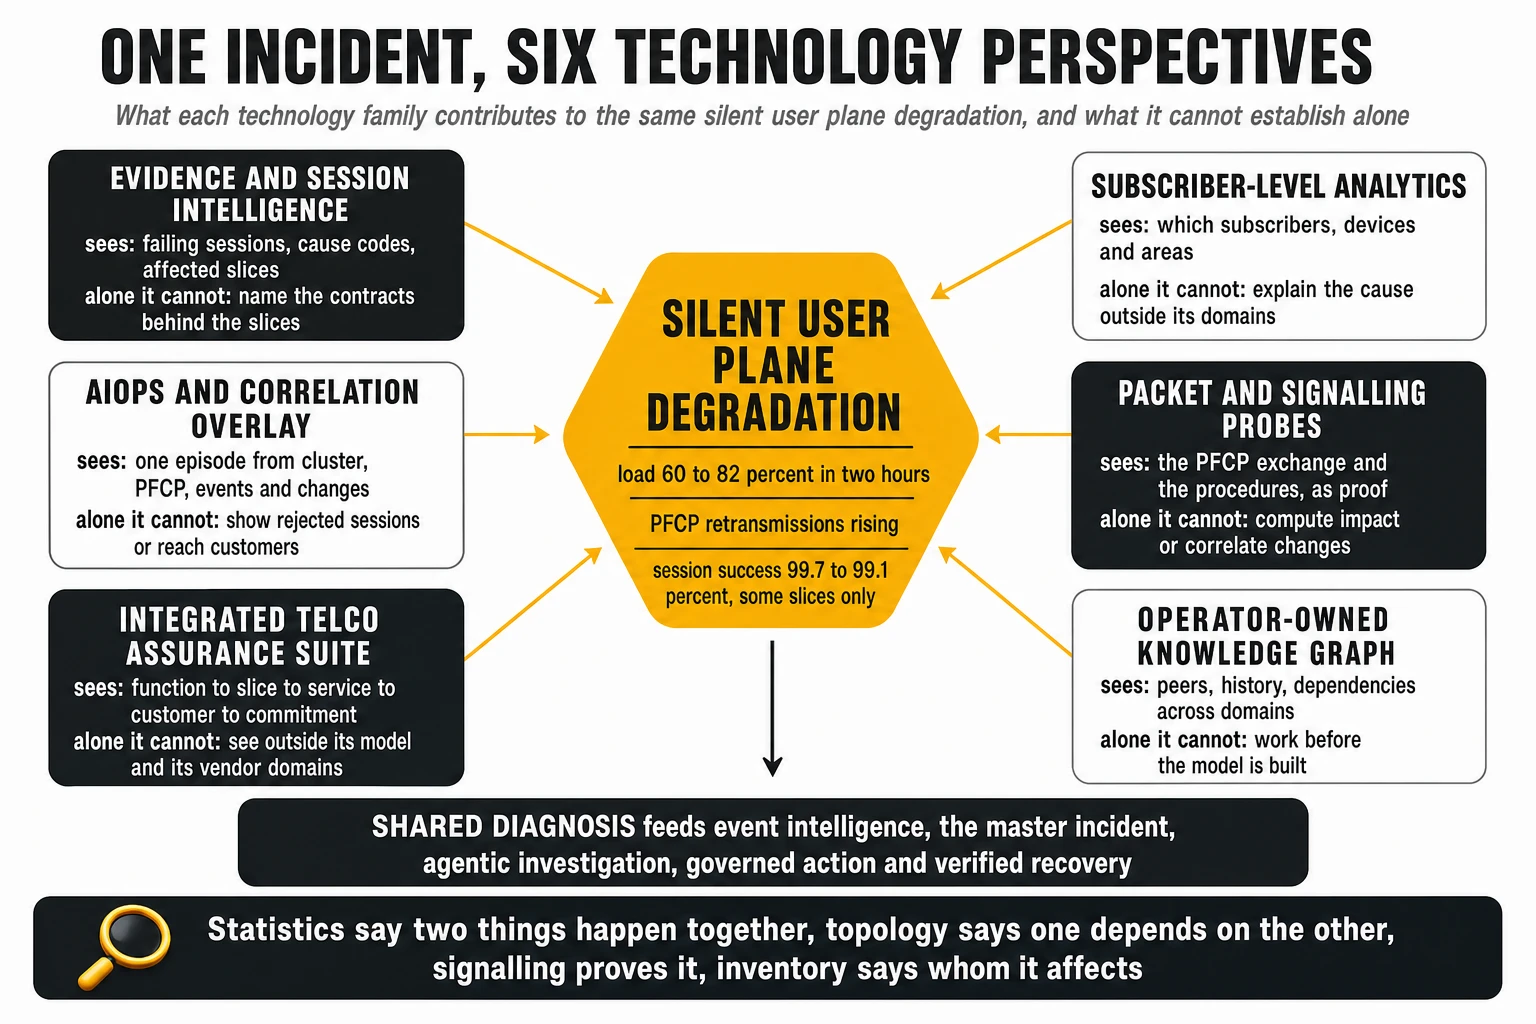
None of the six perspectives is the incident; the end-to-end architecture is what turns their partial views into one managed and verified recovery. The evidence platform’s deviation and the overlay’s episode enter 03.1 as the signals that are collapsed, enriched with the suite’s impact and the overlay’s probable cause, prioritised by the commitments at risk and routed to the core on-call. 03.2 opens the master record in 03.3 with the subscriber analytics’ list of customers attached, so the ticket exists before the cause is confirmed. 08 reads the record, queries the graph for the deployment and the instance’s history, tests the overlay’s hypotheses against the probe’s evidence — requesting a capture on demand where proof is needed — and attaches its conclusion with its confidence. 04 executes the authorised action through the orchestrator with pre-checks, under the policy 09.2 applies to its class, with rollback armed. 05 reads the evidence platform’s session success, the recovered customers and the suite’s service indicators before anyone may close the ticket. Statistical correlation says that two things happen together, topology says that one depends on the other, signalling proves it, and the service inventory says whom it affects; serious root cause begins when the four are joined, and the right architecture is the one in which these perspectives feed each other, and feed the operation, rather than compete.
7. From detection to resolution: two practical scenarios
An architecture described in blocks becomes real only when one incident is followed through it, and the two scenarios below are chosen to show that the operating model stays the same while everything underneath it changes. The first is the silent degradation of a user plane function in a 5G core, which exercises every category at once. The second is a multi-layer degradation of an enterprise service over fixed access and optical transport, kept brief, whose purpose is to show that the sources, the domain model and the tools of action are all different while the sequence, the gates and the owners are identical. Each step names the block or capability that performs it.
7.1 A silent user plane degradation in a 5G core, step by step
The starting condition is the one that defeats conventional monitoring: nothing is down, no threshold is crossed, and a user plane function instance has begun to fail a small but growing fraction of session establishments after a routine deployment the previous evening. The evidence exists from the first minute — PFCP retransmissions rising, the session success rate for the instance drifting below its own recent behaviour, the enterprise slice consuming its error budget faster than usual — but it exists as events and indicators, not as alarms. In the conventional chain it would be noticed when a customer called.
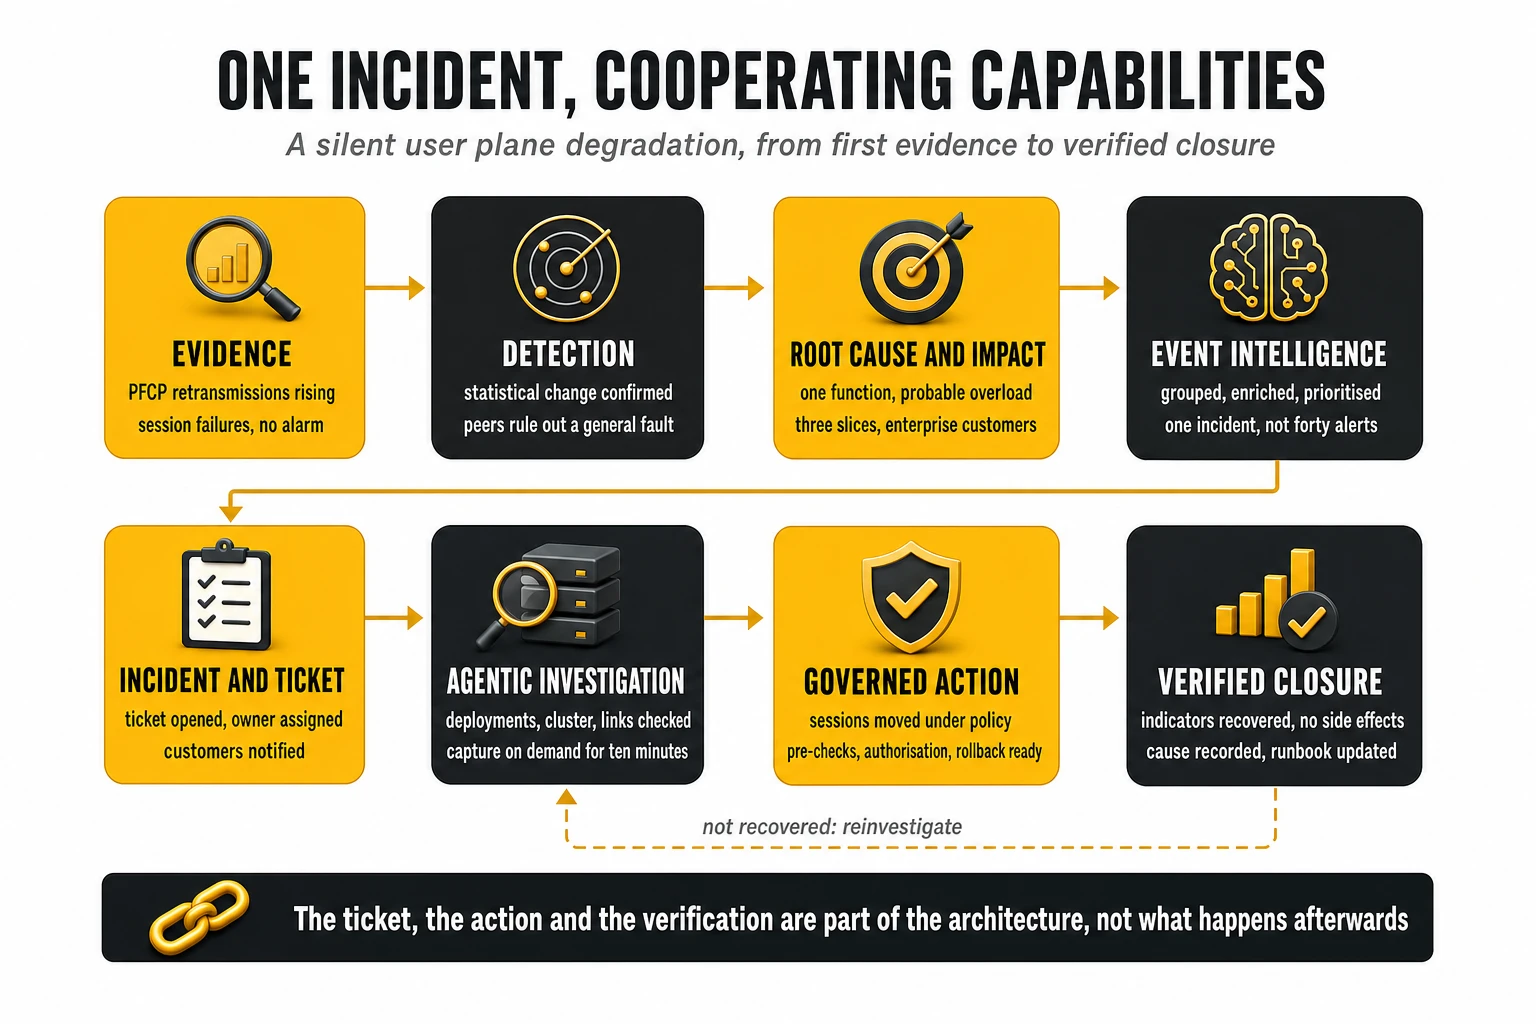
| Step | Function | What happens | Block or capability | Result |
|---|---|---|---|---|
| 1 | Observation | Native events from the control and user plane and per-instance indicators arrive through the backbone; PFCP retransmissions and session failures for one instance rise; no alarm | 01.2, 01.1 on 06.1 and 06.2 | Evidence with resolved identities and measured latency |
| 2 | Detection | A change-point detector on the instance’s session success rate confirms a sustained shift; peer comparison across the other instances rules out a general fault; the slice’s burn rate crosses its fast-window threshold | 02.1, 02.2 | A deviation confirmed for one instance, minutes after it began |
| 3 | Correlation | Event processing groups the detection with the retransmission events, the change record of the previous evening’s deployment and a rising memory indicator on the pod; topological correlation over the chain restricts the scope to the instance and its transport paths | 02.3 over 07.5 | One candidate incident with its scope and its related change |
| 4 | Root cause hypothesis | The causal engine proposes a probable cause — the instance is degrading after the deployment — with a confidence and two alternatives: transport path degradation and an upstream resolver problem | 02.4 | A ranked hypothesis set, not a verdict |
| 5 | Impact | In parallel with step 4, the chain is walked downward from the instance: three slices, the enterprise customers on one of them, two commitments at risk within the hour | 02.5 over 07.5 | Affected services, customers and commitments, before the cause is confirmed |
| 6 | Event intelligence | The forty related alerts across monitoring tools are collapsed into one incident; enriched with impact, probable cause, change and runbook; priority raised because enterprise commitments are at risk; routed to the core on-call | 03.1 | One prioritised, enriched incident with an owner |
| 7 | Incident management | The master record is created with the identifier mirrored in the response platform; state, priority, impact and hypothesis written in; affected enterprise customers notified; supplier escalation prepared and held | 03.3, synchronised with 03.2 | A traceable record that exists before the cause is confirmed |
| 8 | Agentic investigation | An agent reads the record, queries the graph for the deployment’s contents, the pod’s resource history and the paths’ health, consults the runbook and the last similar incident, tests the three hypotheses, and requests a packet capture on demand filtered to the instance and the slice, bounded to ten minutes; the capture confirms the instance is rejecting sessions under memory pressure introduced by the deployment | 08.1, 08.2, 08.3; evidence from 01.5 | A confirmed cause with the evidence attached to the record |
| 9 | Decision | The agent recommends two actions with their classes: steer new sessions to peer instances (low-risk mitigation, pre-approved) and roll back the deployment parameter (configuration change, human approval); the on-call engineer reviews the evidence and approves the rollback through the change record | 08.4 recommends; 04.1 classifies; 09.2 decides; 04.2 records | Two authorised actions, each with its authorisation recorded |
| 10 | Automation | The orchestrator runs the pre-checks — peer capacity, path health, no concurrent change — executes the steering through the domain controller and the rollback through the deployment pipeline, runs the post-checks and writes the results into the record; the rollback plan stays armed | 04.3, 04.4 | Actions executed under policy, with evidence of execution |
| 11 | Verification | The six checks run: instance state matches the rollback’s intent; session success back within its band; slice experience indicators recovered; enterprise customers confirmed restored; peers show no side effects; the actions’ own success criteria met | 05.1, 05.2 | Recovery verified, or the incident reopened to step 8 |
| 12 | Closure and learning | Closure code and confirmed cause recorded; a problem record opened for the deployment process; the runbook updated with the capture filter that worked; the detectors’ baselines retrained excluding the incident window; the incident counted in the autonomy metrics for its class | 05.3, 05.4, written into 03.3 and 08.2 | A closed incident that has made the next one shorter |
The time saved is distributed across the whole cycle, which is why measuring only detection latency or only root cause precision would miss most of it. In the conventional chain the same incident would have been noticed from a complaint, confirmed by a persistence rule, investigated by an engineer assembling evidence from five consoles, ticketed after the investigation, fixed by a script run from a terminal, and closed when the alarms stopped. Here the impact is known before the cause, the ticket exists before the investigation, the investigation obtains deep evidence for ten minutes instead of relying on a permanent capture of everything, the two actions have different authorisation paths because they have different risk classes, and closure is refused until the service indicators say the customers have recovered.
7.2 A multi-layer degradation in an enterprise service over fixed and transport networks
The second scenario removes everything specific to the mobile core and keeps the operating model. An enterprise connectivity service, carried over aggregation and IP routers that ride an optical path, begins to lose packets at several customer sites, and the originating fault is two layers below the service that shows the symptom: an optical path’s pre-correction bit error rate has been rising for hours, uncorrected errors begin to appear, the IP link drops and flaps, the aggregation routers reroute over a longer path, and the enterprise VPNs see latency and loss their customers notice before any alarm names the optical path. The sources, the domain model and the tools of action are different; the sequence, the gates and the owners are the same.
| Layer | Evidence that exists | What the architecture does with it |
|---|---|---|
| Optical transport | Pre-correction bit error rate, corrected and uncorrected error counts, optical power per path | A statistical baseline on the error rate detects the drift hours before the first uncorrected error; a change-point confirms the acceleration |
| IP and MPLS | Link errors, interface flaps, rerouting events, flow records showing traffic moving to the longer path | Event processing groups the link symptoms; topological correlation over the dependency chain links the IP link to the optical path beneath it, and the probable cause moves two layers down |
| Aggregation and service layer | Per-service latency and loss from edge probes, service-level objective burn rates for the enterprise products | The impact walk from the optical path reaches the affected virtual private networks, the customer sites behind them and the commitments at risk, in parallel with the root cause analysis |
| Event intelligence and incident response | Transport alarms, IP alerts, customer complaints and the service-level burn-rate alerts arriving in different tools | All of them collapse into one incident, enriched with the impact and the probable cause, prioritised by the commitments at risk and routed to the transport on-call, with the enterprise service desk informed through the service-aware path |
| ITSM and investigation | The master record, the change calendar, the maintenance windows, the previous incidents on the same path | The record is opened before the cause is confirmed; the investigation agent checks for planned maintenance and recent fibre work, confirms the path as the cause from the optical history and recommends the action with its class |
| Action and verification | Transport controller with a validated protection path; IP controller for traffic engineering | A protection switch to the validated path is a low-risk mitigation and runs under policy with pre-checks on the protection path’s health; the repair of the fibre is a structural change that goes to a field work order through the ITSM; verification is performed at the service layer, on the enterprise sites’ latency and loss, not on the optical counters |
What stays the same between the two scenarios is the invariant an operator can build on.
- Detection is statistical in both and precedes any alarm (02.1).
- Correlation is topological in both and depends on a chain that spans layers (02.3 over 07).
- Impact is computed in parallel with the cause in both (02.5).
- The incident is one object with one master record in both (03.3).
- The investigation is performed by agents with tool access in both (08).
- The action is classified by risk and gated by policy or a human in both (04, 09).
- Closure is verified at the service layer in both, never at the layer where the fix was applied (05).
What differs — evidence sources, domain ontology, detector parameters, controllers, teams — is configuration of the same model. An operator that has built the cycle once for one domain has built most of it for the next, provided the chain (07.5) and the master record (03.3) were designed to span domains from the start.
8. How to validate the architecture using real incidents
A proof of concept that replays a vendor’s demonstration data measures the vendor’s demonstration; the only validation that tells an operator anything replays its own incidents, end to end, through the assembly it intends to run. Select ten real incidents with known causes and outcomes, covering the failure classes of 02.1 and the risk classes of 04.1; replay their evidence through 06 with identities resolved; score what each candidate did with it. Ten questions are asked: the first four test block 02, a detection engine; the remaining six test 03, 08, 04 and 05, the operational system around it. A candidate that passes the first four and fails the last six is a good engine in a bad operation, which is the most common outcome of an unmeasured deployment. The operator selects the incidents, not the vendor.
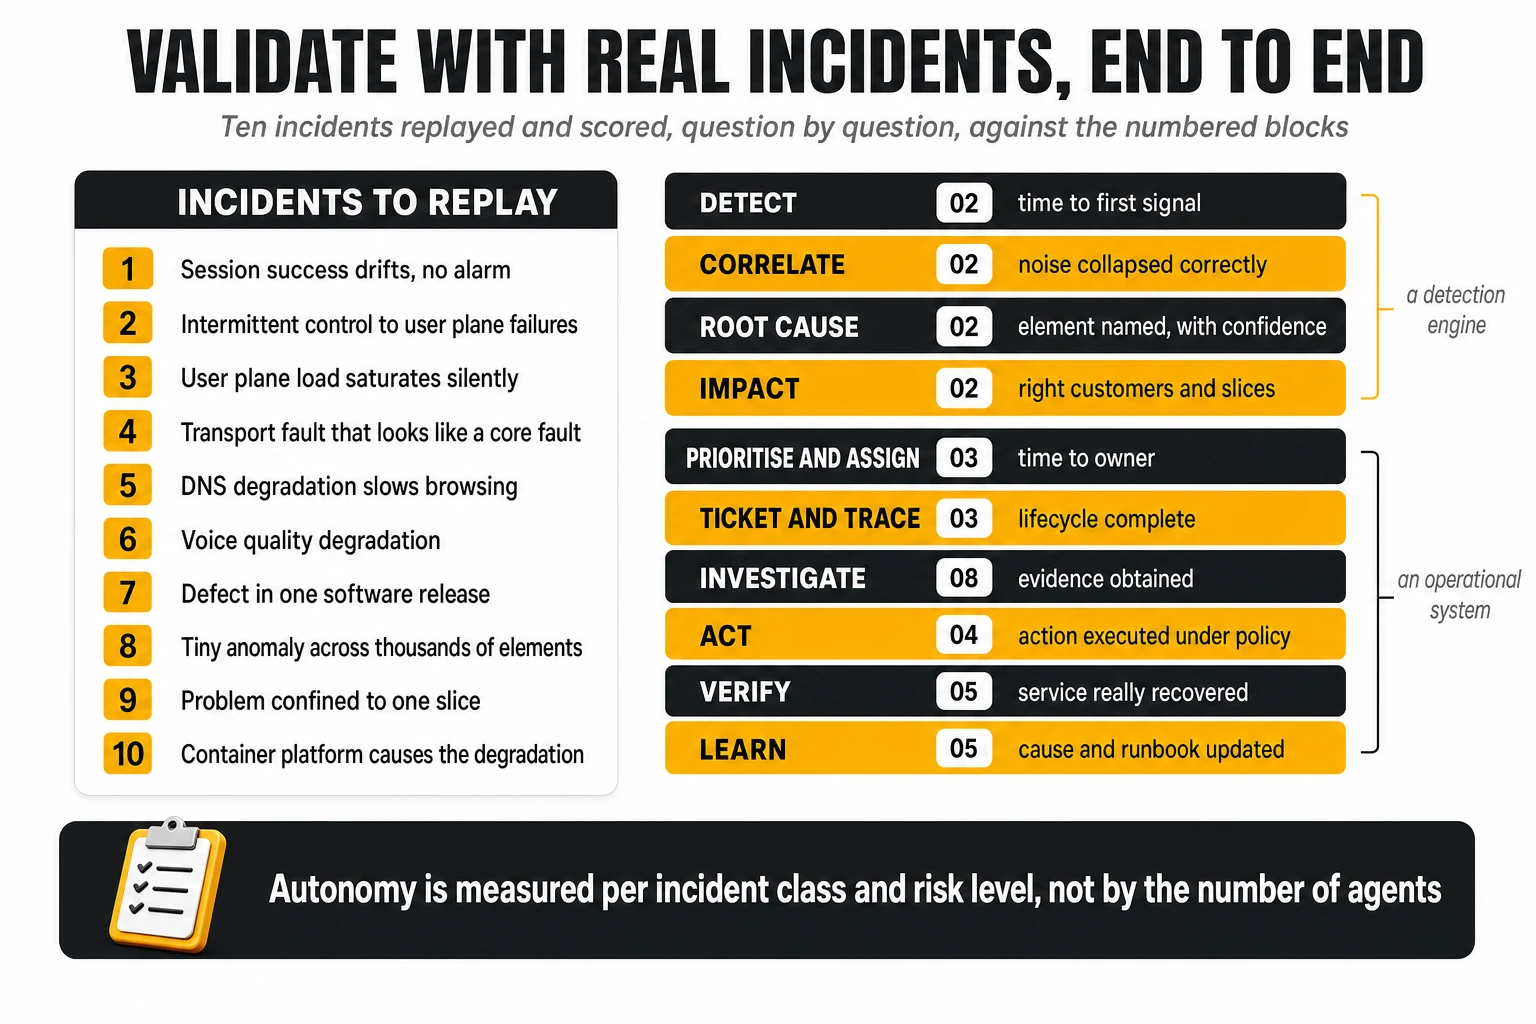
| Incident to replay | What it tests in the engine | What it tests in the operational system |
|---|---|---|
| 1. Session success drifts for days with no alarm | Statistical detection without a threshold; dependence on persistence | Whether anything is ticketed before a customer complains |
| 2. Intermittent control-plane to user-plane failures | Correlation of sparse events across functions | Grouping of intermittent alerts into one incident rather than many |
| 3. User plane load saturates silently | Early detection on capacity indicators; probable cause with confidence | Low-risk mitigation executed under policy with pre-checks |
| 4. Transport fault that looks like a core fault | Topological correlation across layers; cause two layers below the symptom | Routing to the right team the first time; cross-domain coordination |
| 5. DNS degradation slows browsing | Service impact without a network fault; experience indicators | Service-aware notification; impact communicated before the cause |
| 6. Voice quality degradation | Quality of experience evidence; media-path correlation | Verification on experience indicators, not on component state |
| 7. Defect in one software release | Correlation with change records; peer comparison across versions | Rollback through the change process; problem record opened |
| 8. Tiny anomaly across thousands of elements | Multivariate detection at scale; noise behaviour | Noise collapse ratio; whether the response platform drowns |
| 9. Problem confined to one slice | Impact precision at slice and customer level | Prioritisation by commitment at risk; correct customers notified |
| 10. Container platform causes the degradation | Evidence from the platform layer; investigation into deployments and resources | Agentic investigation with tool access; action class and authorisation correct |
| Question | What a pass looks like | Tests |
|---|---|---|
| 1. Detect: when was the first signal, and how long before the reference time? | A measured advance over the time the incident was actually noticed, at the fiftieth and the ninety-fifth percentile across the ten incidents | Engine, block 02 |
| 2. Correlate: was the noise collapsed into the right number of incidents? | One incident per real incident; no two real incidents merged; the ratio of alerts to incidents recorded | Engine, block 02 |
| 3. Root cause: was the originating element named, with a confidence and alternatives? | The confirmed element in the top hypothesis, with a confidence that proved calibrated across the ten | Engine, block 02 |
| 4. Impact: were the right services, slices and customers identified? | Precision and recall of the affected customers against what was later confirmed | Engine, block 02 |
| 5. Prioritise and assign: how long until the incident had an owner, and was it the right one? | Time to owner measured; first routing correct; priority consistent with the commitments at risk | Operational system, block 03 |
| 6. Ticket and trace: does one master record carry the whole lifecycle? | Every state, hypothesis, action and verification present in the record with mirrored identifiers | Operational system, block 03 |
| 7. Investigate: was additional evidence obtained when the hypothesis needed it? | The investigation requested and received evidence under policy, and attached it to the record | Operational system, block 08 |
| 8. Act: was the action executed under its class’s policy, with pre-checks and a rollback plan? | No action without pre-checks; no action outside its authorisation; rollback armed and tested | Operational system, block 04 |
| 9. Verify: did the service really recover, by the service’s indicators? | The six checks passed; closure refused when they did not; reopen rate recorded | Operational system, block 05 |
| 10. Learn: were the cause, the runbook and the baselines updated? | Problem record, runbook change and baseline retraining present and attributable to the incident | Operational system, block 05 |
The scoring is expressed on ten end-to-end dimensions, each tied to a block, and the discipline is to measure every one of them on the replay rather than to accept any from a brochure. The replay reproduces the evidence and the engines faithfully; the human parts — time to owner, approval delays, field work — are estimated from the historical records of the same incidents until the assembly has run on live incidents long enough to measure them.
| Dimension | Metrics | How it is measured in the replay | What it must not be confused with |
|---|---|---|---|
| Detection (02) | Mean time to detect; detection latency at the fiftieth and ninety-fifth percentile; precision and recall against the ten known incidents; dependence on persistence | First signal time against the reference time of the historical record, per incident | The vendor’s claimed detection time on its own data |
| Correlation (02) | Noise reduction ratio; correct grouping rate; false positives; false merges | Alerts in, incidents out, checked against the known incident boundaries | Alert volume reduction achieved by suppression alone |
| Root cause (02) | Time to first hypothesis; precision of the named element; confidence calibration; evidence attached | Top hypothesis against the confirmed cause; confidence against outcome across the ten | A single cause with no alternatives and no confidence |
| Impact (02) | Precision and recall of affected services and customers; time to impact | Impact list against the customers who were later confirmed affected | A count of elements under the fault |
| Incident response (03) | Time to prioritisation; time to owner; escalation correctness; time to first response | Timestamps in the response platform and the record, against the historical timeline | Time to acknowledgement of a page |
| ITSM (03) | Lifecycle completeness; identifier synchronisation; traceability of every state and action | Audit of the master record after the replay, item by item | The existence of a ticket |
| Automation (04) | Coverage by action class; execution success; failures; rollback rate; actions outside policy | Orchestrator logs against the action-class policy, per action | The number of runbooks available |
| Recovery (05) | Mean time to verified recovery; real recovery of quality of service and experience; reopen rate | Service indicators after the action, against the band; closures reopened within a defined window | Mean time to execute the fix |
| Efficiency (01 to 09) | Human minutes per incident by class; interventions per incident; cost per incident; recurrence | Estimated from the historical records for the human parts, measured for the system parts | Headcount reduction promised in a business case |
| Autonomy (04 and 09) | Share of incidents resolved without human intervention and with verified recovery, per incident class and risk level; precision of automated decisions; false action rate; human override rate | Per class, counting only incidents whose closure passed the six checks | The number of agents, skills, tool servers or runbooks deployed |
Autonomy is measured per incident class and per risk level; a single autonomy figure for the whole operation is a slogan, not a measurement. Three levels are reported separately, never summed:
- Automation of tasks: a step within a procedure runs without a human.
- Automation of procedures: a whole runbook runs under policy.
- Autonomous resolution: detection, investigation, action and verified recovery complete without any human intervention. Only this is autonomy, and only incidents whose closure passed the six checks count towards it.
An operation that reports the number of agents, skills, tool servers or runbooks it has deployed is reporting its inventory, not its maturity. The action classes of 04.1 give the structure for extending autonomy, and 09.2 holds the result.
| Action class | Autonomy allowed at the start | Evidence required to extend it | Metric that governs the extension |
|---|---|---|---|
| Diagnostic | Full, from day one | None beyond the investigation’s own audit trail | Investigation acceptance rate by the engineers who conclude the incident |
| Low-risk mitigation | Supervised, then autonomous per narrow class | A run of supervised executions with pre-checks passed, no rollback and verified recovery | Precision of the automated decision and false action rate, per class |
| Configuration change | Human authorisation through the change record | A measured history of recommended changes approved without modification | Share of recommendations approved as proposed, and reopen rate after execution |
| Structural change | Human decision, agents prepare the evidence | Not extended; the class is defined by the fact that it needs a human | Time saved in preparation, not autonomy |
| Forbidden to automation | None | Not extended | Zero attempts, enforced and audited |
The validation produces two answers, and an operator that leaves with only one has not finished. The first is which assembly held: which categories detected, understood, coordinated, ticketed, executed and verified correctly on the operator’s own incidents, and which gaps appeared between them. The second is the evidence itself — the measured latencies, precisions, ratios and rates — which becomes the baseline against which every phase of the roadmap in section 10 is gated and against which the published figures of section 9 can finally be compared.
9. Deployment evidence and what it actually demonstrates
The published evidence is real but uneven, and the first thing to read in any of it is not the figure but the type of evidence behind the figure. A framework validation is comparable across operators but scoped to the scenarios it validated; an operator announcement is credible about the architecture and vague about the metric; a vendor claim says what the product is designed to optimise and is unusable as a planning assumption until the operator has reproduced it on its own incidents.
| Organisation | What was deployed | Published result | Evidence type |
|---|---|---|---|
| DNB, True Corporation, TDC NET, NBN Co | Ericsson AI intent-based operations for service assurance | TM Forum Level 4 autonomy validations for assurance scenarios, October 2025 to July 2026, including cross-domain root cause and automated mitigation with rollback | Framework-validated |
| Bell Canada | Google Cloud framework with Spanner Graph and AI operations | 25% reduction in customer-reported issues; 75% increase in software delivery productivity | Operator announcement |
| Deutsche Telekom | Radio agent on Gemini models in Vertex AI | Live in production in Germany; 237,000 events identified in 2026; major event handling from hours to about a minute | Operator announcement |
| One NZ | Core network voice-quality agent on the Google Cloud framework | Deployed into operations as an IMS quality specialist agent | Vendor and partner announcement |
| Swisscom | Cloud-native core with Ericsson software probes and NETSCOUT virtual instrumentation | Announced October 2022 as cloud-based packet data processing with no physical tap in the chain | Joint announcement |
| Lumen | Selector as signal consolidator, with Itential executing and ServiceNow tracking | Published three-vendor architecture with explicit lanes for understanding, acting and tracking, January 2026 | Operator case study via vendor |
| Large European operator with two merged mobile networks | Polystar Osix Monitoring and Kalix Analytics, hybrid on-premises and Google Cloud | Selected June 2026 to align indicators, replace legacy platforms and provide end-to-end visibility with AI anomaly detection | Vendor announcement |
| Tier-1 European operator, roughly 30 million subscribers | Ericsson Expert Analytics on a hybrid feed of physical probes, embedded core events and radio cell traces from three vendors, since 2018–2019 | More than 21 million mobile subscribers monitored; incident data latency about 2 minutes against 45–60 minutes before; anomaly detection at 6 minutes on a 5-minute step against 40 minutes on a 60-minute step; automated root cause and subscriber impact still in progress | Vendor customer-case material, operator not named |
| Viettel, TPG Telecom, EE | Ericsson Expert Analytics | Customer experience and subscriber-level troubleshooting deployments | Vendor customer reference |
| CETIN Networks, Slovakia | RADCOM ACE, multi-year, replacing the incumbent assurance provider | End-to-end assurance across radio, voice and core for a 5G standalone and cloud-native core rollout, August 2026 | Vendor announcement |
| AT&T, DISH, Rakuten Mobile | RADCOM ACE cloud-native assurance | National-scale production deployments; no comparable public metrics | Vendor customer reference |
| Selector, cross-customer | AI-driven correlation platform | Claimed average 85% reduction in mean time to repair; resolution up to 95% faster | Vendor claim |
| Nokia, cross-customer | Assurance Center with AIOps and Gemini agents | GlobalData ranking as service assurance leader, January 2026; references at TPG, Optus, AT&T; claimed 50% to 80% faster problem resolution with agents | Analyst ranking plus vendor claim |
| Ericsson, cross-customer | Embedded software probes in the dual-mode packet core | Claimed up to 60% lower capital and up to 90% lower operating cost against external probes | Vendor claim |
| BMC, cross-customer | Helix Operations Management with AIOps event management | Claimed up to 90% event noise reduction through AI-driven correlation and deduplication | Vendor claim |
| PagerDuty, cross-customer | Event orchestration, alert grouping, incident response and runbook automation | Documented product capabilities for noise reduction, automated incident workflows and runner-based automation; no operator-published telecom outcome metrics located | Vendor documentation |
| Polystar, cross-customer | Multi-vendor assurance suite | More than 100 communication service providers cited as customers | Vendor claim |
| NETSCOUT | nGeniusONE and Omnis AI for service providers | Large installed base; 2026 extension of AI-ready data offer; no comparable public outcome metrics | Vendor announcement |
Four things stand out from the list, and none of them is a percentage.
- The only independently validated results belong to scenario-scoped intent-based assurance: a Level 4 outcome is real for a defined scenario, and says nothing about the network as a whole.
- The operators with the clearest published outcomes — Bell Canada, Deutsche Telekom, Lumen, Swisscom — all describe an assembly with separated roles rather than a single platform; the Lumen case names who understands (02), who acts (04) and who tracks (03).
- Almost nobody publishes what any of it cost: the published figures are the numerator, and the denominator is dominated by data engineering, identity resolution and the people who maintain both.
- Nobody publishes the operational dimensions at all — time to owner, lifecycle completeness, verified recovery, reopen rate — which is not evidence that they are poor but evidence that they are unmeasured.
The evidence supports three conclusions and refuses a fourth. It supports that detection latency can fall by an order of magnitude when evidence is collected at event granularity and analysed statistically, because the one customer case that publishes latencies shows exactly that. It supports that assemblies with separated roles are what operators actually run. It supports that framework-validated autonomy is achievable for defined scenarios with rollback. It does not support any claim about autonomous resolution rates across an operation, about the precision of agentic recommendations in production, or about the effect on cost per incident, because no one has published those figures.
10. Implementation roadmap and strategic conclusions
The roadmap has eight phases, each building named categories, and the rule that governs it is that every gate between phases is a measurement rather than a date. A phase begins when the previous one has reported its metric at the level the operator set, and the metrics are those of section 8, measured on the operator’s own incidents. The order follows the dependencies between the categories: nothing above the data (06) and the model (07) can be better than they are; nothing acts safely before the incident is one object with one record (03.3); nothing closes a loop before its precision is known (09.4). Autonomy is not a phase at the end; it is the result of the last phase applied, use case by use case, to the classes whose measurements justify it.
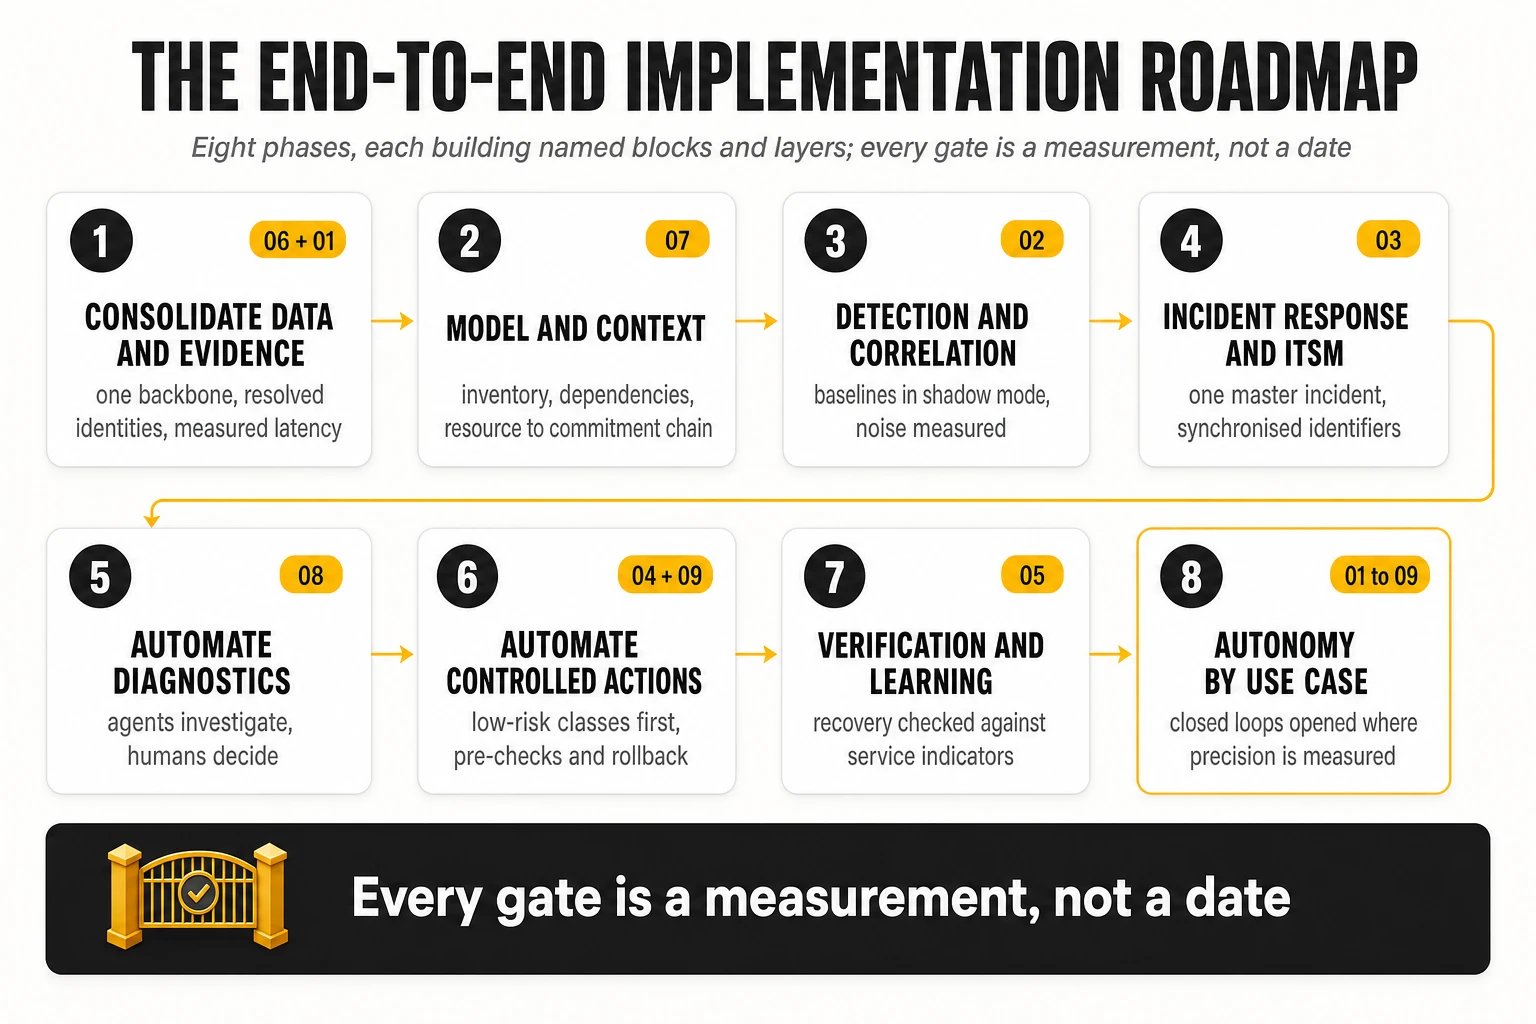
| Phase | What is built | Exit gate, as a measurement | The trap to avoid |
|---|---|---|---|
| 1. Consolidate data and evidence (06, 01) | One backbone with streaming and operational stores; native events collected from the functions; identities resolved at ingestion; the use-case-to-source matrix of section 4.1 delivered | Evidence latency per source at the ninety-fifth percentile; identity resolution rate; share of priority use cases with an assigned future source | Building the backbone as a bigger log store and calling it done |
| 2. Model and context (07) | Inventory reconciled; the dependency chain from resource to commitment built for the priority services; the knowledge graph populated and its accuracy audited | Model accuracy against audits; share of priority services with a complete chain; freshness of the model after changes | Buying a graph and expecting it to fill itself |
| 3. Detection and correlation (02) | Statistical baselines and change-point detectors in shadow mode; topological correlation over the chain; service-level burn rates for the priority services | Detection advance over current alarms at the fiftieth and ninety-fifth percentile; precision; noise collapse ratio; false merge rate | Going live with detectors whose precision has never been measured |
| 4. Integrate incident response and ITSM (03) | One master record per incident; identifiers mirrored; grouping, enrichment and routing in the response platform; closure rules in the ITSM | Lifecycle completeness; time to owner; identifier synchronisation rate; share of incidents ticketed before the cause is confirmed | Letting the response platform become a second ticketing system |
| 5. Automate diagnostics (08) | Investigation agents connected to the model, the evidence, the changes and the knowledge base through contracts; packet on demand under policy; humans decide | Time to probable cause; investigation acceptance rate by the engineers; share of investigations with evidence attached to the record | Agents that summarise instead of investigating, because they have no tool access |
| 6. Automate controlled actions (04, 09) | The orchestrator’s pre-checks, authorisation by action class, execution and rollback over the existing tools; low-risk classes first, supervised | Execution success; rollback rate; zero actions outside policy; precision of the automated decision per class | Automating the action before automating the checks around it |
| 7. Verification and learning (05) | The six checks enforced as closure rules; reopen measured; problem records, runbook updates and baseline retraining produced by every closure | Share of closures verified against service indicators; reopen rate; share of incidents producing a learning output | Closing on the orchestrator’s return code |
| 8. Autonomy by use case (01 to 09) | Closed loops opened, class by class, where the measured precision justifies them; the extension and its reversal governed by the per-class metrics | Share of incidents resolved without human intervention and with verified recovery, per class; false action rate; human override rate | Declaring an autonomy level for the whole operation |
For an operator starting from an existing estate, phases 1, 2 and 4 are mostly integration and modelling work on systems it already owns, and that is where the first year goes. The temptation to begin at phase 5 is strong, because agents are visible and a dependency chain is not; the result is agents that produce fluent summaries of incidents the estate still detects late. For an operator with a deployed probe estate, the six steps and six commitments of 4.1 sit inside phases 1 and 3 and are gated by the same measurements. For an operator choosing an assembly from section 6, the roadmap is the same in all four; what differs is which column of the nine-category table each phase fills in, and that mapping should be written down before phase 1 begins.
Five conclusions
First, real-time assurance is an integral operational capability, not a measurement function. It is not limited to measuring resources or finding anomalies; it has to determine what is happening, why, whom it affects and how the service is restored, and then confirm that it was. The five verbs of section 1 are the specification, the sixteen steps of section 2 are the process, and the nine categories of section 3 are the architecture. An operator that buys a product for one of the five and calls it observability has bought one fifth of the capability.
Second, the capabilities are complementary, and a platform that covers several does not remove the need to distinguish them. 01 observes, 06 consolidates, 07 contextualises, 02 detects and diagnoses, 03 coordinates and records, 04 executes, 05 verifies, 08 investigates and 09 governs. Where one product performs three of these, the operator still has to know which three, how they hand over, and what happens at the boundary with the ones it does not perform. The two confusions that cost the most are mistaking event intelligence (03.1) for root cause (02.4) and mistaking coordination (03) for execution (04).
Third, agentic AI is an integration and operational-intelligence capability, not a universal substitute. Agents (08) are valuable because they use the systems that already exist: they investigate, query, request evidence, test hypotheses, recommend and coordinate, faster and more consistently than a person reading five consoles. Their usefulness is bounded by their access to tools, data, the model and knowledge, and by the controls around them (09). They do not detect, they do not own the truth, and they do not authorise.
Fourth, integrating the existing ecosystem can be worth more than adding platforms. In many operators the largest gaps are not missing products but missing relationships: identifiers that do not match (06.2), dependencies that stop at a domain boundary (07), an incident that exists as six partial objects (03.3), a service model nobody owns. The fourth assembly of section 6 exists for those operators, and its gap analysis — nine categories, what exists, what is missing — is the first deliverable of any programme. Where a new platform is the right answer, that analysis makes the procurement precise; where it is not, it saves the money.
Fifth, the objective is autonomous, verifiable recovery of the service, and success is measured there and nowhere else. Root cause precision, alerts eliminated and agents deployed are inputs. The outputs are how much real degradation was avoided or shortened, how quickly the service was verifiably restored, how much human intervention each class still needs, how often incidents recur and what each costs. Those are the ten dimensions of section 8, measured per incident class and risk level, and they are the gates of the roadmap. An operator that measures them will extend autonomy exactly as far as the evidence supports, reverse it when precision falls, and be able to say of any incident not that the alarms stopped but that the customers recovered.
The answer this article has built is a sequence rather than a product: know which capabilities are needed (01 to 09), understand how they connect, choose the technologies that make each one possible, identify the suppliers that can provide them, recognise what is already owned, implement in the order the dependencies dictate, and measure the result as verified recovery. Every operator that has published a result followed some version of that sequence. None of them bought it.
At TelcoCrux, we help operators turn this reference into a decision: which of the nine categories they already have and which they lack, how to make the evidence layer scale into a cloud-native core without growing the probe estate by default, how to design a validation on real incidents that measures the operation and not only the engine, which assembly fits their estate and their people, and how to sequence the programme so that every phase is justified by a measured result. If you are evaluating service assurance, observability, incident management or autonomous operations and want an independent read before the procurement closes, let’s talk.