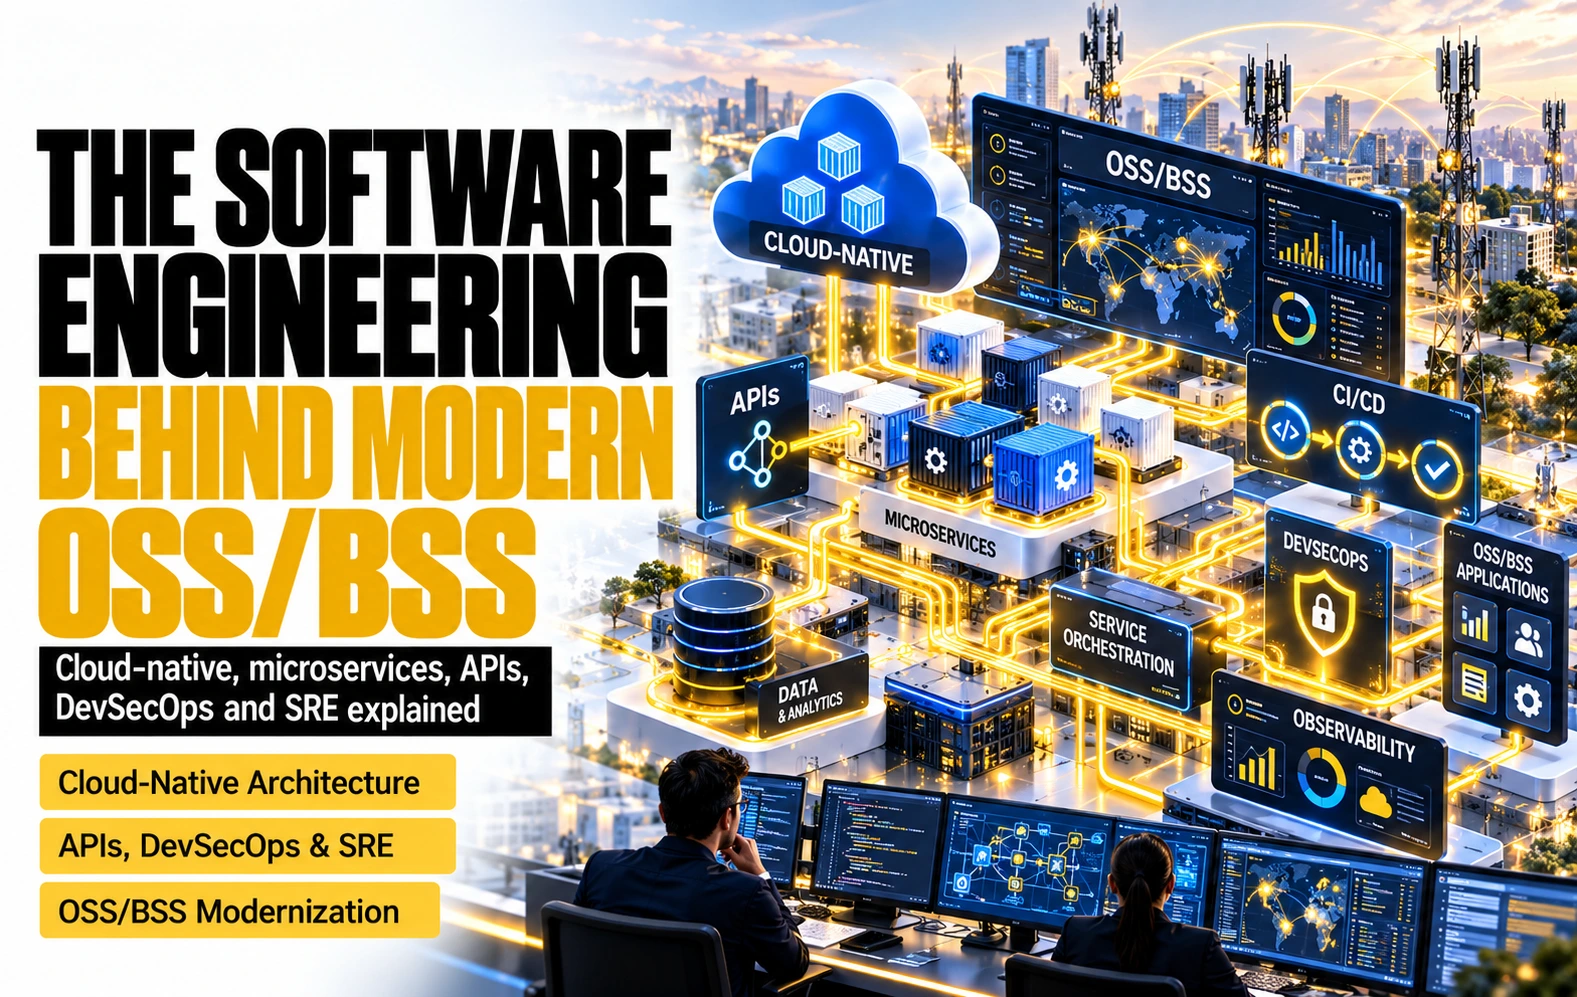
1. OSS/BSS became a software engineering problem
A single product order for a business fibre connection now crosses more software than an entire telecom IT department ran in 2005. The order enters through an API gateway, is validated against a product catalogue, decomposed into service orders, checked against service and resource inventory, sent to an activation engine that talks to a network controller, recorded as events on a message bus and observed through traces, metrics and logs collected from a dozen independently deployed services. Each of those services is built, tested, scanned, signed and released through an automated pipeline, sometimes several times a day. If any step fails, the system is expected to retry, compensate or roll back without a human editing a database by hand.
Twenty years ago the same order would have been handled by two or three large applications. A CRM captured it, an order management system in the middle translated it, and a provisioning system wrote it to the network, usually through a nightly batch or an enterprise service bus. Those applications were released twice a year in maintenance windows, ran on dedicated servers and were operated by teams who knew the database schema by heart. The engineering challenge was functional coverage. The operating model was stability through change avoidance.
The thesis of this article is that modern OSS/BSS is no longer a product category that an operator buys; it is a set of software engineering capabilities that an operator either masters or rents. Cloud-native platforms, microservices, standard APIs, event streaming, observability, continuous delivery, DevSecOps and site reliability engineering are not independent fashions. They form a chain in which each technology solves a problem created by the previous one. Containers made applications portable, which created thousands of moving parts that needed an orchestrator. Orchestration made it possible to split applications into many services, which needed contracts and events to talk to each other. Distributed services fail in ways nobody can predict, which required observability. Small services can be released often, which required automated pipelines. Fast pipelines can ship vulnerabilities as fast as features, which required security inside the pipeline. And when everything changes continuously, reliability can no longer be managed by forbidding change, which is why SRE exists.
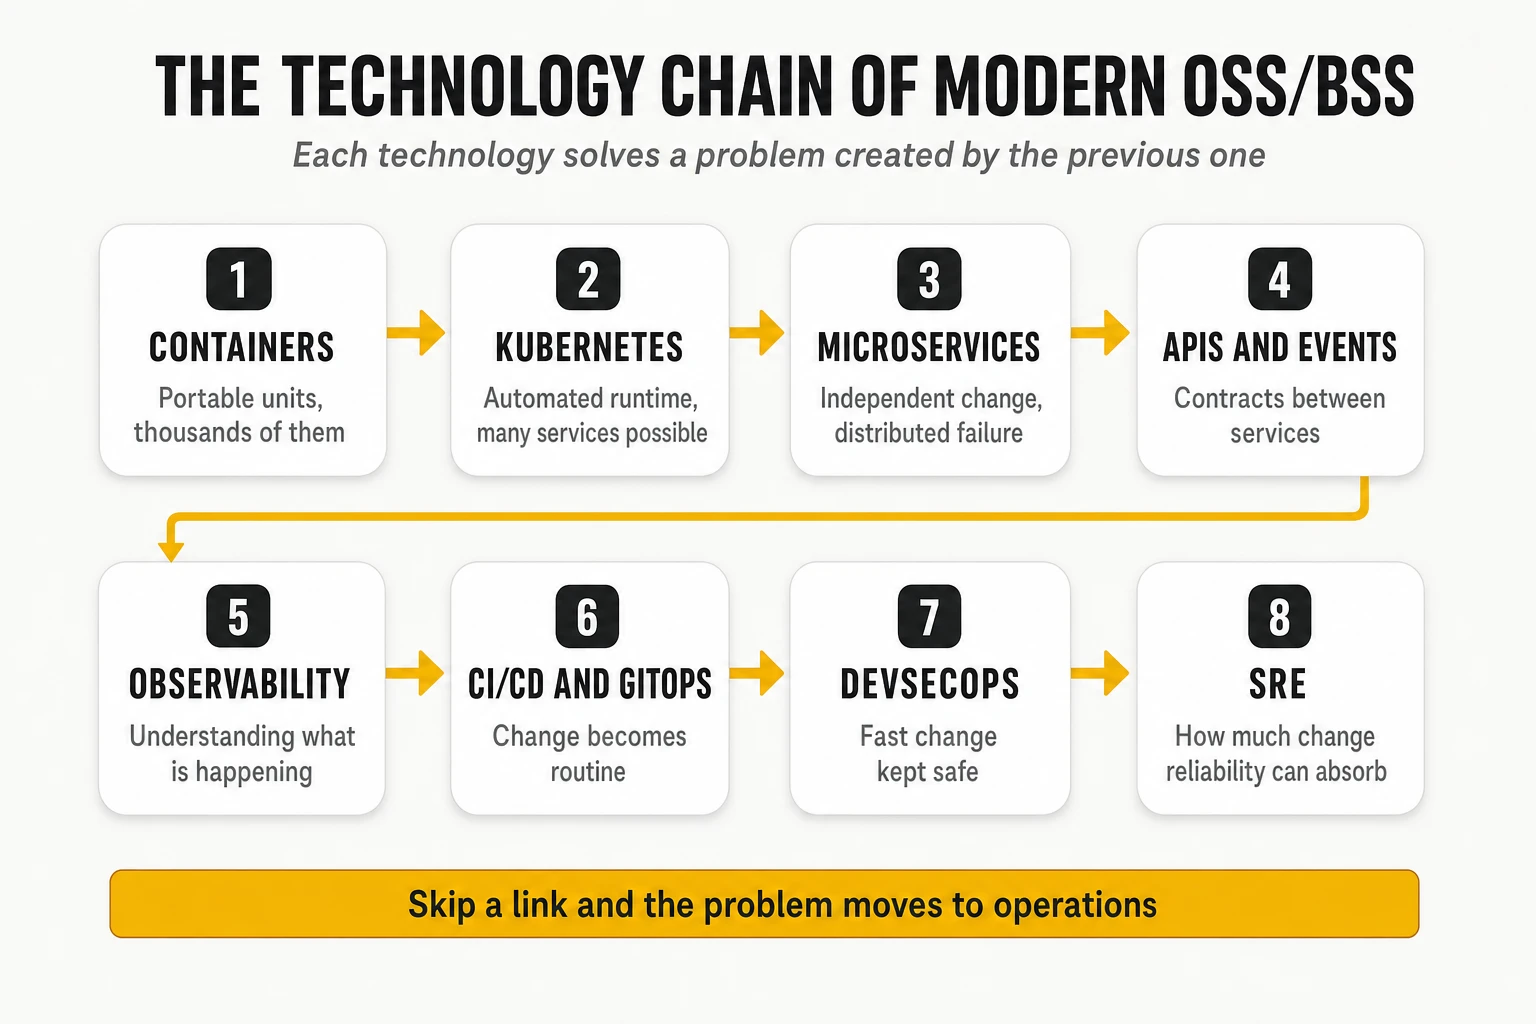
Three consequences follow, and they frame the rest of the article.
- The technologies only deliver value as a set. An operator that adopts microservices without observability, or Kubernetes without GitOps, or continuous delivery without SLOs, obtains the cost and complexity of the new model without its benefits. The usual result is a “distributed monolith”: many services that must still be released together.
- Most of the cost is in operations and skills, not in licences. The visible decision is which platform to buy. The decisive one is whether the organisation can run hundreds of services, pipelines and clusters with the discipline these technologies assume.
- The architecture of OSS/BSS is now defined by standards that were written by software engineers, not by telecom process designers. TM Forum’s Open Digital Architecture (ODA) Canvas is a Kubernetes operator. The Open APIs are OpenAPI documents. The reference implementations use Istio, Keycloak and Kafka. Reading them requires the vocabulary this article explains.
The Big Picture: How the Engineering Capabilities Fit Together
Modern OSS/BSS engineering is best understood as an integrated system for designing, delivering, operating and continuously improving telecommunications services. Its purpose is not simply to modernise applications, but to make the entire technology estate more adaptable, interoperable, resilient and economical to evolve.
Two interconnected lifecycles define this system. The service lifecycle transforms business intent into delivered services: products are defined, orders are captured, resources are assigned, network services are activated, performance is monitored and faults are resolved. The software lifecycle continuously changes the applications that execute those processes: capabilities are designed, developed, tested, secured, deployed, observed and improved.
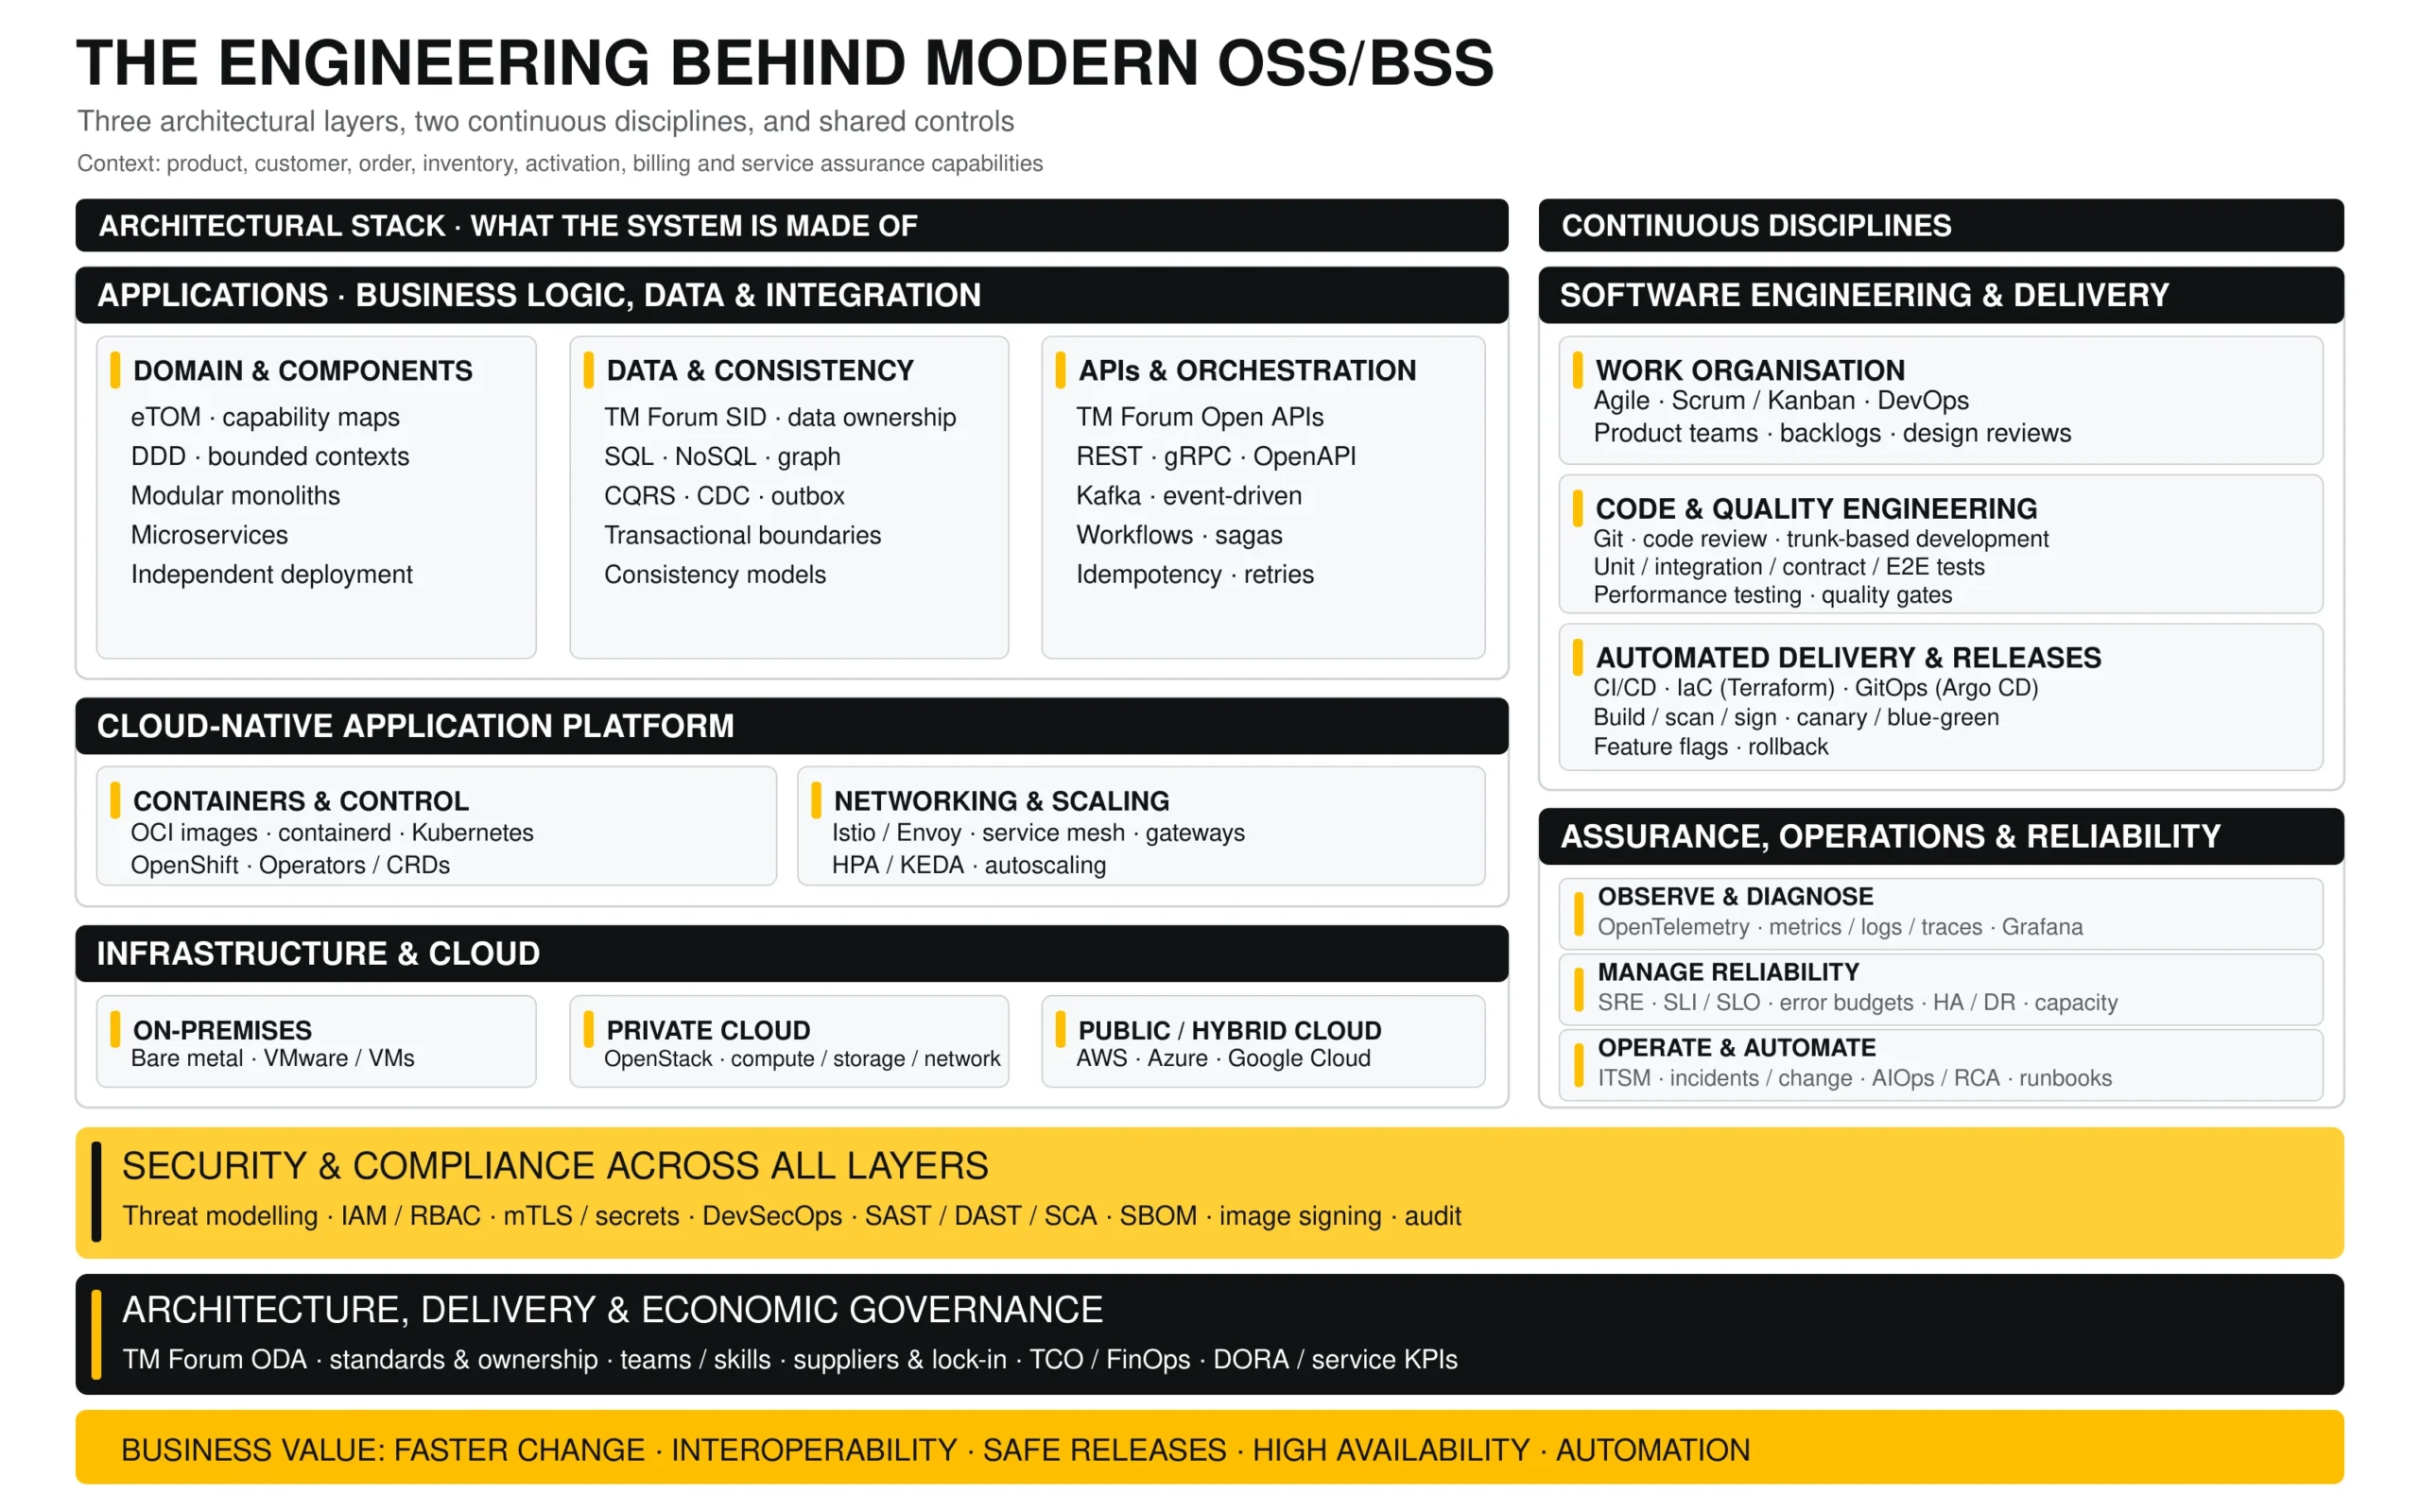
Modern OSS/BSS engineering is not simply a collection of technologies such as Kubernetes, microservices, Kafka or DevSecOps. It is an integrated engineering system designed to build, evolve and operate complex business-critical applications with greater flexibility, reliability and control.
Understanding this system requires distinguishing three different dimensions:
- The architectural layers: what the applications are made of, how they execute and which infrastructure supports them.
- The continuous engineering disciplines: how software is developed, tested, released, observed and improved throughout its lifecycle.
- The cross-cutting controls: how security, architecture governance, technical ownership and economic sustainability are maintained across the entire system.
These dimensions are interconnected, but they are not interchangeable. Kubernetes is an execution platform; microservices are an application design choice; CI/CD automates software delivery; and SRE establishes a discipline for managing reliability. Each addresses a different responsibility.
1. The three architectural layers
Infrastructure and cloud: the foundation
At the bottom sits the infrastructure providing computing, storage and networking resources. Applications may run on physical servers, traditional virtual machines, private clouds based on OpenStack or public cloud platforms such as AWS, Azure and Google Cloud.
The infrastructure strategy determines where workloads execute, how capacity is provided, how environments are interconnected and which costs, operational dependencies and supplier constraints the organisation accepts.
The distinction between infrastructure and application design matters. Moving an existing monolith to a public cloud does not automatically make it cloud-native, nor does choosing OpenStack imply adopting microservices.
The engineering objective is to provide a reliable, economically sustainable foundation without unnecessarily tying the application architecture to a particular infrastructure supplier.
Cloud-native application platform: how software is executed
Above the infrastructure is the platform responsible for deploying, connecting, scaling and managing applications.
Containers package applications and their dependencies into portable execution units, with the Open Container Initiative (OCI) defining common image and runtime specifications. Kubernetes orchestrates these workloads, while enterprise distributions such as OpenShift add integrated security, lifecycle management and operational tooling.
The platform also includes mechanisms for service discovery, traffic management, configuration and elasticity. Service meshes such as Istio, often using Envoy proxies, provide traffic policies, encryption and service-to-service observability. Horizontal autoscaling and tools such as KEDA adjust capacity according to demand.
Kubernetes Operators extend platform automation to more complex applications, encoding operational procedures into controllers that continuously reconcile actual and desired states.
Together, these technologies establish a programmable execution environment in which applications can be deployed, scaled and recovered with increasing automation.
However, the platform introduces its own operational complexity. Running Kubernetes successfully requires expertise in networking, storage, security, upgrades, observability and capacity management. Those responsibilities do not disappear when applications become cloud-native.
Application architecture: how business capabilities, data and integrations are organised
The upper layer contains the OSS/BSS applications themselves: customer management, product catalogues, order handling, inventory, provisioning, activation, assurance, billing and the capabilities required to support them.
Three architectural concerns must be addressed together.
First, domain and component design determines how functionality is organised. TM Forum frameworks such as eTOM and SID provide telecom-specific process and information references, while Domain-Driven Design (DDD) helps identify bounded contexts with clear responsibilities.
Applications can then be implemented as modular monoliths, microservices or combinations of both. The objective is not to maximise the number of services but to achieve appropriate modularity, independent evolution and manageable dependencies.
Second, data architecture determines which components own particular information, how consistency is maintained and which persistence technologies best serve each requirement. Relational databases, document stores, graph databases and distributed caches support different access patterns.
Patterns such as Change Data Capture (CDC), CQRS and transactional outboxes help distribute changes, maintain read models and coordinate data across independently deployed services.
Third, integration and orchestration architecture determines how those components cooperate.
APIs based on REST or gRPC support explicit request-response interactions. TM Forum Open APIs provide standardised contracts for telecom capabilities. Event-driven architectures, commonly implemented using technologies such as Kafka, allow systems to exchange events asynchronously.
Workflow orchestration and saga patterns coordinate long-running business operations that span several components and cannot rely on a single database transaction.
These architectural decisions must be consistent. Microservices without well-designed boundaries, data ownership and integration contracts frequently produce distributed systems that remain tightly coupled and difficult to change.
2. Software engineering and continuous delivery: how the system evolves
Architecture defines the structure of the system. Software engineering determines whether that structure can evolve safely, frequently and economically.
This responsibility extends well beyond programming or deploying containers. It covers the complete development lifecycle, from requirements and design through implementation, quality assurance, release and continuous improvement.
Agile methods such as Scrum and Kanban help organise development into manageable work cycles. DevOps connects software development with deployment and operational responsibilities, encouraging teams to take greater ownership of the services they create.
Version control systems such as Git provide traceability and coordination. Branching strategies, code reviews, reusable components and engineering standards help maintain quality as multiple teams contribute to the same ecosystem.
Automated testing is fundamental. Unit tests validate individual components; integration tests examine interactions; contract tests verify compatibility between independently deployed services; and end-to-end tests validate complete business processes. Performance, resilience and security testing address additional production risks.
These controls become particularly important in OSS/BSS, where a seemingly small change to an API, inventory schema or provisioning component can affect multiple downstream systems.
CI/CD industrialises the delivery process. Continuous Integration automatically builds and tests changes, while Continuous Delivery or Deployment automates the steps required to release validated software.
Infrastructure as Code, using technologies such as Terraform, makes infrastructure configuration reproducible and version-controlled. GitOps, commonly implemented with Argo CD, applies declarative configuration management to application deployment and platform operations.
Progressive delivery techniques such as canary releases, blue-green deployments and feature flags enable controlled introduction of changes. Automated rollback mechanisms reduce recovery times when a release behaves unexpectedly.
The result should be a repeatable engineering system in which software is continuously maintained in a deployable state.
Importantly, a successful software delivery transformation cannot be measured merely by deployment frequency. Lead time, change failure rate, recovery time, software quality and operational performance must be evaluated together. This is where DORA metrics and engineering governance become relevant.
3. Assurance, operations and reliability: how the system is controlled
Distributed applications introduce new failure modes. A business transaction may depend on several microservices, databases, message brokers and infrastructure components operating across multiple clusters.
Observability provides the evidence required to understand their behaviour. Metrics reveal performance and resource consumption; logs capture application events; and distributed traces reconstruct transactions across services.
OpenTelemetry standardises instrumentation and telemetry collection, while technologies such as Prometheus and Grafana support monitoring and analysis.
However, collecting telemetry is not equivalent to guaranteeing reliability.
Site Reliability Engineering (SRE) establishes measurable reliability objectives through Service Level Indicators (SLIs), Service Level Objectives (SLOs) and error budgets. These concepts help teams balance continuous software evolution with the stability required by production services.
Reliability engineering also includes capacity planning, redundancy, high availability, backup and disaster recovery, and testing of failure scenarios.
Operational processes connect this technical evidence with incident, problem and change management. ITSM platforms coordinate responsibilities and maintain operational records, while AIOps, automated diagnostics and runbooks can accelerate detection, root cause analysis and recovery.
In telecommunications, an additional integration is essential: application observability must connect with network and service assurance where relevant, so failures can be understood in terms of affected processes, services and customers rather than only failing software components.
The ultimate ambition is a closed feedback loop: detect degradation, determine its cause, assess impact, execute an authorised response and verify recovery.
4. Security and governance: responsibilities across every layer
Security is not a separate phase performed after development, nor is it confined to infrastructure.
Security by design must apply to application architecture, data, APIs, containers, infrastructure, delivery pipelines and production operations.
DevSecOps integrates security controls into the engineering lifecycle through threat modelling, automated vulnerability analysis, dependency scanning, secret management, software bills of materials (SBOMs) and software supply-chain controls.
Identity and access management, RBAC, encryption, service identities and policy enforcement protect execution environments and interactions between applications.
Alongside security, enterprise architecture and economic governance ensure that the overall ecosystem remains coherent and sustainable.
TM Forum’s Open Digital Architecture provides an overarching reference spanning business capabilities, information systems, implementation, deployment and governance.
Organisations must also establish architecture principles, technology standards, ownership boundaries, supplier strategies, integration requirements and explicit policies for managing technical debt.
Financial governance must evaluate total cost of ownership, cloud consumption, licensing, operational expenditure and the risks associated with supplier lock-in.
Finally, the operating model must ensure that teams possess the skills, decision rights and accountability required to develop and maintain the architecture.
5. Bringing the system together
Consider the introduction of a new capability into an enterprise service activation platform.
Application architects determine which business components must change, who owns the relevant data and which API or event contracts are affected.
Software engineers implement the change, validate its behaviour through automated tests and prepare a release through the CI/CD pipeline.
The cloud-native platform deploys the updated components onto the underlying infrastructure, applying the required configuration, security policies and availability mechanisms.
Observability verifies that transactions continue to execute correctly. SRE practices determine whether the service remains within its reliability objectives, while operational automation supports diagnosis and recovery if unexpected behaviour occurs.
Architecture governance ensures that the change remains consistent with the broader systems strategy and does not introduce unnecessary technological or supplier dependencies.
The central objective is not technological modernisation for its own sake. It is to create an engineering system capable of delivering business change continuously while controlling complexity, security, reliability and cost.
That is the real transformation behind modern OSS/BSS: moving from applications that are difficult to change and expensive to coordinate towards an architecture in which software, infrastructure, development and operations evolve as an integrated and governed system.
2. Cloud-native architectures
2.1 From monoliths and SOA to cloud-native
A monolith is an application deployed as a single unit, with all its functions sharing one process, one codebase and usually one database. Most OSS/BSS suites of the 2000s were monoliths, sometimes very large ones: a billing system with millions of lines of code, a single Oracle schema and a release cycle measured in quarters. Monoliths are not inherently bad. They are simple to deploy, transactions are local and consistent, and debugging happens in one place. They become a problem when the organisation grows: every change requires regression testing the whole system, every team waits for the same release train, and scaling one function means scaling all of them.
Service-Oriented Architecture (SOA) was the first attempt to break that coupling. In the SOA model, popular from roughly 2003 to 2015, functions were exposed as coarse-grained services described in WSDL and exchanged as SOAP/XML messages, usually through an Enterprise Service Bus (ESB). The ESB routed messages, transformed formats and often orchestrated processes. In telecom, SOA produced the first generation of OSS/J and MTOSI interfaces and the integration layers that still connect many CRM, order management and provisioning systems. Its weakness was the bus itself: business logic migrated into a central integration layer owned by a specialised team, which became the new bottleneck.
Cloud-native is not a hosting choice; it is a way of designing software so that it can exploit an elastic, automated, failure-prone infrastructure. The Cloud Native Computing Foundation definition describes it as building “loosely coupled systems that are resilient, manageable, and observable”, using containers, service meshes, microservices, immutable infrastructure and declarative APIs, combined with robust automation so engineers can “make high-impact changes frequently and predictably with minimal toil”. Each element of that sentence corresponds to a technology described in this article.
| Dimension | Monolith | SOA | Cloud-native |
|---|---|---|---|
| Unit of deployment | One application package | Coarse services, often on an application server | Container image per service |
| Integration | In-process calls, shared database | ESB, SOAP/XML, central orchestration | APIs (REST/gRPC) and events, smart endpoints |
| Data | One shared schema | Shared or per-system databases | Database per service, polyglot persistence |
| Scaling | Vertical, whole application | Per service, mostly manual | Horizontal, automatic, per service |
| Release cadence | Quarterly or slower | Monthly to quarterly | Daily or on demand per service |
| Failure model | Process crash stops everything | Bus failure affects all integrations | Partial failure assumed and designed for |
| Typical OSS/BSS example | Legacy billing or inventory suite | CRM + OM + provisioning over an ESB | ODA Components on Kubernetes |
Caption: Monolith, SOA and cloud-native compared. Most operator estates in 2026 contain all three.
2.2 Running in the cloud is not the same as being cloud-native
Moving a monolith to virtual machines in a public cloud (“lift and shift”) changes the landlord, not the architecture. The application still scales vertically, still needs maintenance windows and still assumes that its server will not disappear. It gains self-service infrastructure and loses capital expenditure, but it does not gain resilience or release speed. Many OSS/BSS “cloud migrations” of the last decade were of this type, and many delivered higher run costs than the on-premise estate they replaced, because cloud pricing rewards elasticity that a monolith cannot use.
A cloud-native application behaves differently in four ways. The Twelve-Factor App methodology, published by Heroku engineers in 2011 and still the most compact description of these properties, captures most of them.
- It is stateless at the process level. Any instance can be killed and replaced; state lives in external databases, caches or event logs. This is what allows an orchestrator to move, restart and scale instances freely.
- Configuration lives in the environment, not in the code. The same image runs in development, staging and production; only environment variables, secrets and configuration maps change.
- It starts fast and shuts down gracefully (“disposability”). An instance that takes ten minutes to start cannot be autoscaled in response to a traffic peak.
- It treats logs as event streams and exposes health and metrics endpoints, so that the platform can decide when it is alive, when it is ready to receive traffic and when it is overloaded.
Infrastructure is immutable. Servers and containers are never patched in place: a change produces a new image, which replaces the old one through an automated deployment. This removes configuration drift, the slow divergence between environments that used to make “it works in staging” meaningless, and turns every environment into something that can be rebuilt from code.
2.3 Containers: what they are and how they work
A container is a normal Linux process that the kernel isolates so that it believes it has the machine to itself. Unlike a virtual machine, a container does not run its own operating system kernel; it shares the host kernel and is isolated by two kernel features:
- Namespaces restrict what a process can see: its own process tree (PID namespace), network interfaces and IP addresses (NET), filesystem mounts (MNT), hostname (UTS), inter-process communication (IPC) and user IDs (USER).
- Control groups (cgroups) restrict what a process can consume: CPU shares and quotas, memory, block I/O and number of processes. When a container exceeds its memory limit, the kernel kills it; this is the “OOMKilled” status familiar to anyone who operates Kubernetes.
A container image is a stack of read-only filesystem layers plus metadata. The Open Container Initiative (OCI) standardises the image format, the runtime behaviour and the distribution protocol used by registries. An image built with Docker, Podman or Buildah runs on any OCI-compliant runtime. Layers are content-addressed by SHA-256 digest, which is why an image reference pinned by digest (image@sha256:…) is immutable while a tag such as :latest is not.
Docker popularised containers but is no longer what runs them in production clusters. Docker (2013) packaged namespaces, cgroups, an image format and a developer workflow into one tool. Kubernetes later defined the Container Runtime Interface (CRI) and removed its built-in Docker integration (“dockershim”) in version 1.24 in 2022. Clusters now use containerd or CRI-O as the high-level runtime, which in turn call a low-level runtime such as runc. Docker remains the dominant tool for building images on developer laptops and in CI.
Containers are lighter than virtual machines but less isolated. A kernel vulnerability can, in principle, let a process escape its container. Workloads that need stronger isolation use sandboxed runtimes (gVisor, Kata Containers) or keep virtual machines. For OSS/BSS, which rarely runs untrusted code, standard containers with hardening policies (non-root users, read-only filesystems, dropped Linux capabilities) are the norm.
2.4 Kubernetes: the orchestrator
Kubernetes is a control system that continuously drives a cluster of machines towards a state declared in configuration. The operator does not tell Kubernetes “start three instances”; it declares “there should be three instances of this image”, and controllers inside Kubernetes observe the actual state, compare it with the desired state and act to close the gap. This reconciliation loop is the single most important idea in modern infrastructure, and it reappears in GitOps (section 7), in the ODA Canvas (section 10) and in closed-loop network automation.
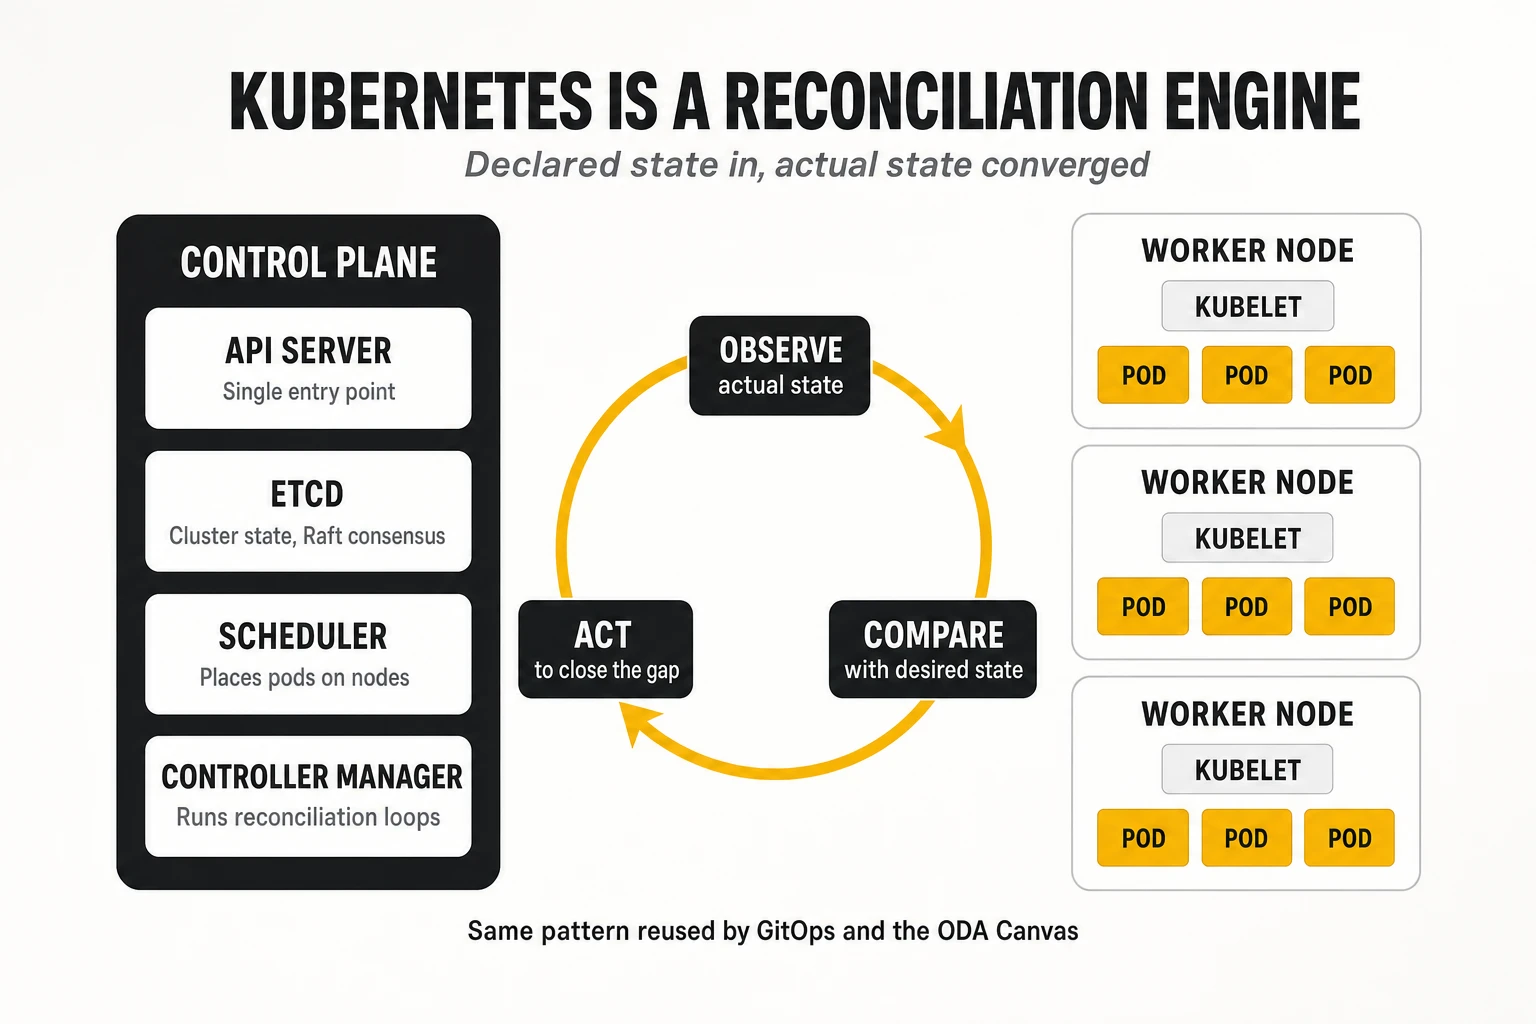
A Kubernetes cluster has a control plane and worker nodes.
- kube-apiserver is the only entry point: every user, tool and internal component reads and writes cluster state through its REST API.
- etcd is a distributed, strongly consistent key-value store (it uses the Raft consensus algorithm) that holds the entire cluster state. Losing etcd without a backup means losing the cluster.
- kube-scheduler decides on which node each new pod runs, based on resource requests, affinity rules, taints and tolerations.
- kube-controller-manager runs the built-in controllers (deployments, replica sets, jobs, nodes, endpoints) that implement reconciliation.
- On each worker node, the kubelet starts and monitors the containers assigned to it through the CRI, and kube-proxy (or an eBPF-based replacement such as Cilium) programs the network rules that implement services.
The core objects are few, and each solves a specific problem.
| Object | What it is | Problem it solves |
|---|---|---|
| Pod | One or more containers sharing a network namespace, IP address and volumes | The smallest schedulable unit; allows sidecars (proxies, log shippers) next to the main container |
| Deployment / ReplicaSet | Declares N identical, interchangeable pods and how to roll out new versions | Stateless services, rolling updates and rollbacks |
| StatefulSet | Pods with stable identity, ordered start-up and persistent volumes | Databases, Kafka brokers, anything that needs a stable name and disk |
| Service | A stable virtual IP and DNS name in front of a changing set of pods | Service discovery and load balancing inside the cluster |
| Ingress / Gateway API | Rules for routing external HTTP(S) traffic to services | North-south traffic entry, TLS termination |
| ConfigMap / Secret | Configuration and credentials injected as files or environment variables | Separating configuration from images |
| Namespace | A logical partition of the cluster with its own quotas and access rules | Multi-team and multi-environment isolation |
| Custom Resource Definition (CRD) + Operator | New object types and a controller that reconciles them | Automating complex software (databases, Kafka, ODA Components) the Kubernetes way |
Caption: The Kubernetes objects that matter most for OSS/BSS workloads.
Operators are how Kubernetes learned to run stateful and domain-specific software. An operator is a controller that watches a custom resource (for example a KafkaCluster or a TM Forum Component) and performs the actions an expert human would: creating resources, upgrading in order, taking backups, failing over. Projects such as Strimzi (Kafka), CloudNativePG (PostgreSQL) and the ODA Canvas itself are operators. This is relevant to OSS/BSS because it moves operational knowledge from runbooks into code.
Kubernetes is complex, and its complexity is not optional. Networking (CNI plug-ins), storage (CSI drivers), identity (RBAC, service accounts), upgrades (a minor release roughly every four months, each supported for about fourteen months under the upstream support policy) and multi-cluster management all have to be engineered. This is why most operators consume a distribution rather than upstream Kubernetes. Adoption is no longer the question: in the CNCF’s 2025 annual survey, published in January 2026, 82% of organisations using containers ran Kubernetes in production, up from 66% in 2023 (628 respondents). Kubernetes 1.37, released in August 2026, is the current minor version; features that matter for OSS/BSS workloads, such as native sidecar containers (stable since 1.33) and in-place resizing of pod CPU and memory (stable since 1.35), have only recently matured.
2.5 OpenShift and the Kubernetes distributions
A Kubernetes distribution packages upstream Kubernetes with an operating system, networking, storage, security defaults, a registry, monitoring and a support contract. In telecom, the most widespread is Red Hat OpenShift, alongside SUSE Rancher, VMware Tanzu (now under Broadcom), Wind River Studio and the managed services of the hyperscalers (Amazon EKS, Azure AKS, Google GKE). Network equipment vendors also ship their own platforms for their network functions.
OpenShift adds opinionated security and an operational layer on top of Kubernetes. Its nodes run Red Hat Enterprise Linux CoreOS, an immutable operating system managed by the cluster itself. Security Context Constraints prevent containers from running as root by default, which breaks many container images built for plain Kubernetes and is a frequent first surprise in OSS/BSS migrations. OpenShift also bundles an integrated registry, OperatorHub, built-in monitoring based on Prometheus, OpenShift GitOps (Argo CD) and OpenShift Pipelines (Tekton). The commercial and dependency implications of these bundles are analysed in our telco cloud lock-in article; for OSS/BSS teams the practical point is that applications should target upstream Kubernetes APIs and treat distribution-specific features as optional.
2.6 Autoscaling
Kubernetes scales at three levels, and confusing them is a common cause of cost overruns.
- Horizontal Pod Autoscaler (HPA) adds or removes pod replicas based on CPU, memory or custom metrics (for example orders per second or Kafka consumer lag). It is the main tool for stateless services.
- Vertical Pod Autoscaler (VPA) adjusts the CPU and memory requests of pods based on observed usage. It is useful to right-size services but is normally not combined with HPA on the same metric.
- Cluster Autoscaler and Karpenter add or remove nodes when pods cannot be scheduled or nodes are underused. On premises, where nodes are physical servers, this level is replaced by capacity planning.
- Event-driven autoscaling with KEDA scales consumers based on external signals such as queue length or Kafka lag, including scaling to zero. It fits OSS/BSS batch and event workloads well: a mediation or reconciliation job that runs only when files or events arrive.
Autoscaling only works if the application is designed for it. A service that holds sessions in memory, takes minutes to warm up or opens a database connection per request will scale poorly or overload its database. The database, not the stateless tier, is usually the scaling limit of an OSS/BSS platform.
2.7 Service mesh
A service mesh moves network concerns out of application code and into infrastructure. In a microservices system, every service needs encryption in transit, mutual authentication, retries, timeouts, traffic splitting and telemetry for every call it makes. Implementing these in every service, in every language, is expensive and inconsistent. A service mesh implements them in a proxy that intercepts traffic.
The classic mesh architecture uses a sidecar proxy in every pod. Istio injects an Envoy proxy next to each application container; a control plane (istiod) distributes configuration and certificates. Linkerd uses its own lightweight Rust proxy. The cost is resources and latency: a sidecar per pod adds memory and a few milliseconds per hop. Istio’s ambient mode, generally available since Istio 1.24 in November 2024, removes sidecars by splitting the work between a per-node layer-4 proxy (ztunnel) for mTLS and optional per-namespace layer-7 “waypoint” proxies.
What a mesh provides, concretely:
- Mutual TLS (mTLS) between all services, with workload identities usually expressed in the SPIFFE format, so that each service can prove who it is and policies can say “only the order service may call the inventory service”.
- Traffic management: percentage-based splits for canary releases, mirroring, retries with budgets, timeouts and circuit breaking.
- Uniform telemetry: request rates, error rates and latency histograms for every service-to-service call, plus trace spans, without code changes.
A mesh is not mandatory, and it is not free. For a platform with ten services, a well-configured ingress, network policies and library-level retries may be enough. For a platform with hundreds of services owned by different teams, the mesh becomes the only practical way to enforce security and traffic policy consistently. The ODA Canvas reference implementation uses Istio for exactly this reason.
2.8 High availability and resilience
Cloud-native high availability assumes that every component will fail and designs so that no single failure is visible to users. This is a reversal of the traditional model, where availability came from expensive, redundant hardware that was not supposed to fail.
The mechanisms stack from the pod to the region:
- Multiple replicas of every stateless service, spread across nodes and failure zones through topology spread constraints and anti-affinity rules.
- Liveness, readiness and startup probes, which tell Kubernetes when to restart a container and when to remove it from load balancing.
- Pod Disruption Budgets, which prevent maintenance operations (node drains, upgrades) from taking down too many replicas at once.
- Replicated state in the data layer: database clusters with synchronous replicas, Kafka with replication factor 3 and
min.insync.replicas=2, distributed caches. - Multi-cluster and multi-site deployment for disaster recovery, either active-active (both sites serve traffic, which requires data that can be written in two places) or active-passive (a standby site takes over, with a recovery time and a possible data loss defined by RTO and RPO).
Kubernetes makes stateless services resilient almost by default; stateful services remain hard. An inventory database with 500 million objects, a billing ledger or a Kafka cluster holding the event history of the network cannot simply be restarted elsewhere. Their availability depends on replication design, backup and restore procedures, and tested failover, which is where most real OSS/BSS outages originate.
2.9 What lies underneath: OpenStack, virtualisation, private and public cloud
Kubernetes needs machines, and in telecom those machines come from four kinds of infrastructure.
- Bare metal: Kubernetes installed directly on physical servers. It offers the best performance and lowest licence cost, at the price of hardware lifecycle management (provisioning, firmware, replacement) through tools such as Metal3 or vendor installers.
- Traditional virtualisation (VMware vSphere and similar): Kubernetes nodes run as virtual machines. It reuses existing operations and tooling, and remains common for IT workloads including OSS/BSS; the Broadcom licensing changes since 2024 have made its cost structure a strategic issue for many operators.
- OpenStack: the open-source infrastructure-as-a-service platform that operators adopted in the NFV era to host virtual network functions. Kubernetes clusters can run on OpenStack VMs, and newer products run OpenStack’s control plane itself on Kubernetes.
- Public cloud: managed Kubernetes (EKS, AKS, GKE) and managed data services. It removes infrastructure operations entirely and is increasingly used for BSS, digital channels and analytics; data residency, regulatory requirements and egress costs limit its use for some OSS functions.
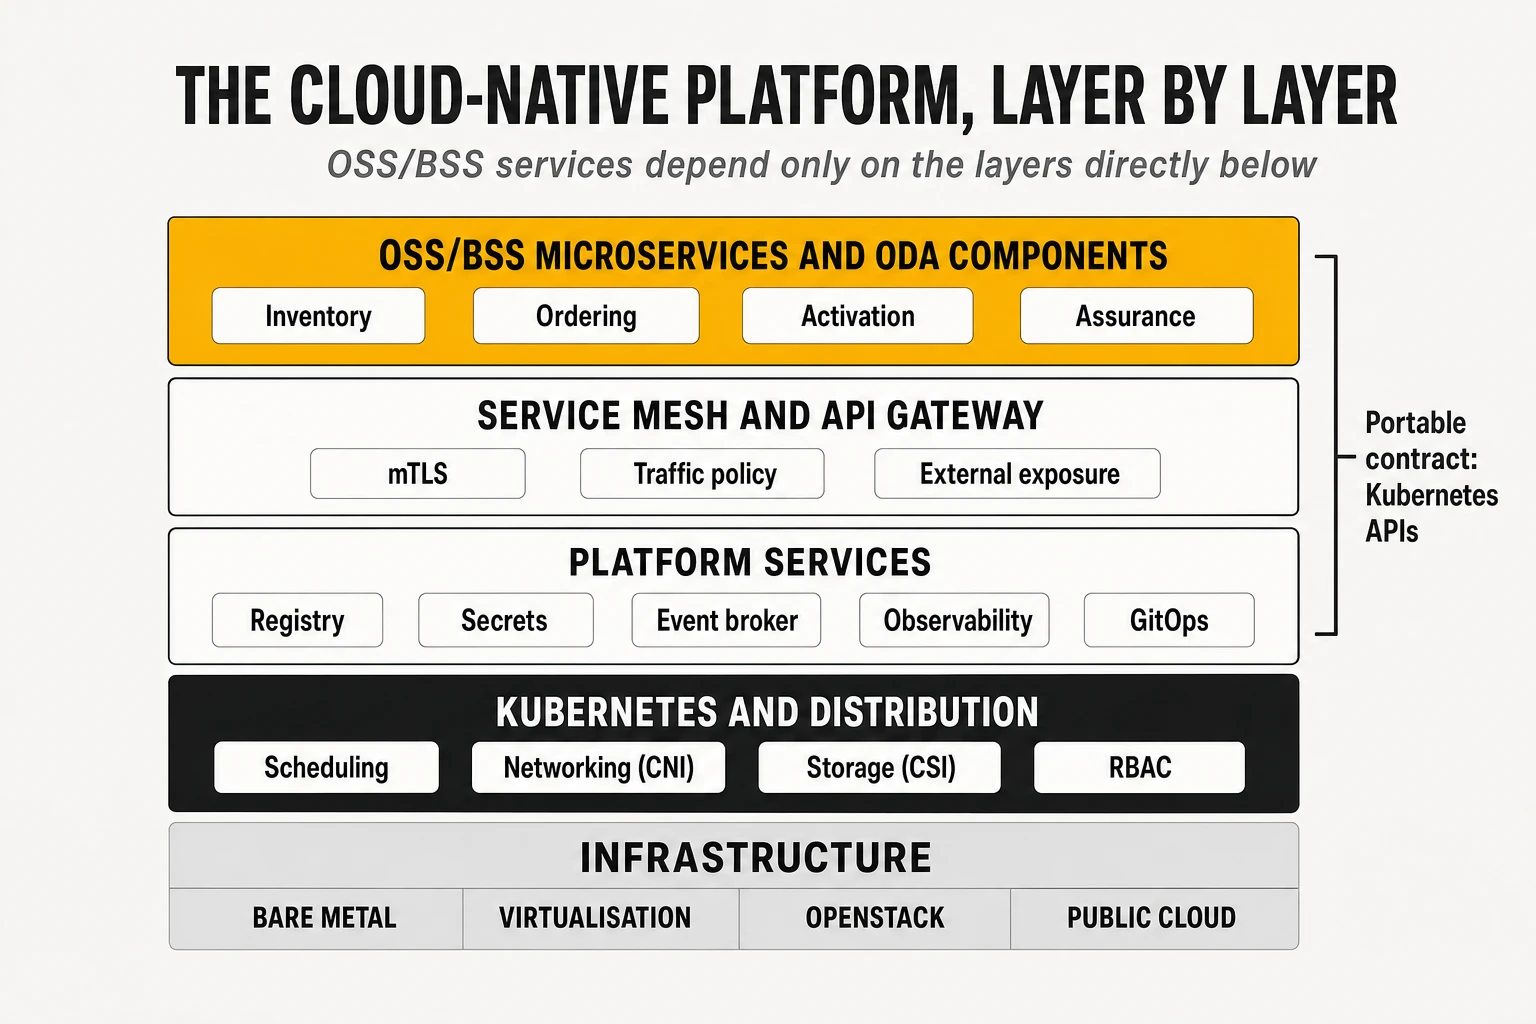
For OSS/BSS, the infrastructure choice matters less than for network functions. OSS/BSS workloads are standard IT: they do not need SR-IOV, DPDK or real-time kernels. They can and should be portable across all four options. The practical design rule is to depend on Kubernetes APIs, CSI storage classes and standard ingress, not on a specific infrastructure, which keeps the platform movable when commercial conditions change. The infrastructure options, their economics and their lock-in mechanisms are covered in depth in our telco cloud article.
3. Microservices architecture
3.1 What a microservice is, and how to cut one
A microservice is an independently deployable service that owns one business capability and its data. The term was popularised by James Lewis and Martin Fowler in 2014, who described the style as “a suite of small services, each running in its own process and communicating with lightweight mechanisms”. The word “micro” is misleading: the defining property is not size but independence. A service that cannot be changed, tested and deployed without coordinating with other teams is not a microservice, whatever its line count.
The hardest part of microservices is deciding where the boundaries go. The most widely used method is Domain-Driven Design (DDD), introduced by Eric Evans in 2003. DDD splits a domain into bounded contexts: areas within which a term has one precise meaning and one model. In telecom, the word “service” means a commercial product in the BSS, a customer-facing service (CFS) or resource-facing service (RFS) in the OSS, and a Kubernetes object in the platform. A “customer” in billing is an account with a balance; in assurance it is a set of service instances with an SLA. Putting both meanings in one model produces the giant, ambiguous data models that made legacy OSS/BSS hard to change.
TM Forum’s frameworks provide a useful first cut for telecom. The eTOM process framework and the SID information model have described the operator’s processes and entities for twenty years, and ODA groups them into functional blocks and components (section 10). They are a sensible starting point but not a substitute for analysis: a component such as “Service Inventory” may itself contain several bounded contexts (topology, lifecycle state, reconciliation), and the right granularity depends on how often each part changes and which team owns it.
Practical heuristics for cutting services:
- Split along business capabilities, not technical layers. A “database service” or a “validation service” shared by everyone is a coupling point, not a microservice.
- Split where change rates differ. The product catalogue changes weekly as marketing launches offers; the rating engine changes rarely but must be extremely reliable. They should not share a release.
- Keep together what must be transactionally consistent. If two pieces of data must always change atomically, splitting them forces a distributed transaction (section 3.5), which is expensive.
- Align services with teams. Conway’s law observes that systems mirror the communication structure of the organisations that build them; a service owned by three teams will be released at the speed of the slowest.
3.2 Independent deployability
Independent deployability is the property that justifies the whole microservices cost. If the order management team can release a fix on Tuesday without waiting for the inventory team, the catalogue team and a joint regression cycle, lead time drops from months to hours. If not, the organisation pays for distribution (network calls, partial failures, distributed data) without the benefit.
Three technical conditions make independent deployment possible:
- Backward-compatible interfaces. A new version of a service must accept the requests of old clients and produce responses they can still parse. This requires contract discipline and versioning (section 4.6).
- Private data. If two services share database tables, a schema change in one breaks the other; they are coupled through the database even if their APIs are clean.
- Automated, per-service pipelines with their own tests, artefacts and deployment, so that releasing one service never requires building another (section 7).
3.3 Synchronous and asynchronous communication
Services communicate either synchronously, where the caller waits for an answer, or asynchronously, where it sends a message and continues. Both are needed; the mistake is to use one for everything.
| Aspect | Synchronous (REST, gRPC) | Asynchronous (events, messages) |
|---|---|---|
| Interaction | Request and response; caller waits | Fire and forget, or publish and subscribe |
| Coupling in time | Both services must be up at the same time | Producer and consumer can be up at different times |
| Typical latency | Milliseconds per hop, adds up across chains | Variable; seconds are acceptable |
| Failure behaviour | Callee failure propagates to caller immediately | Messages wait in the broker until the consumer recovers |
| Consistency | Immediate answer, easier reasoning | Eventual consistency, harder reasoning |
| Best OSS/BSS fit | Queries (catalogue lookup, eligibility, inventory read), user-facing actions | State changes (order created, service activated), telemetry, alarms, long-running processes |
Caption: Synchronous and asynchronous communication compared.
Long synchronous call chains are the most common cause of fragility in microservices. If an order request synchronously calls catalogue, eligibility, inventory and pricing, and each has 99.9% availability, the chain’s availability is at best about 99.6%, and its latency is the sum of all four. Asynchronous designs break the chain: the order is accepted, an event is published, and downstream services react in their own time.
3.4 Data management
Each microservice owns its data and exposes it only through its interface (“database per service”). No other service may read or write its tables directly. This rule is what makes independent deployment and independent scaling possible, and it is the rule most often broken in OSS/BSS modernisation, where reporting, reconciliation and integration jobs have historically read every database directly.
Owning data separately allows polyglot persistence: each service uses the store that fits its access pattern.
- Relational databases (PostgreSQL, Oracle, CockroachDB) for orders, billing and anything needing strong consistency and transactions.
- Document stores (MongoDB, Couchbase) for entities with variable attributes, such as product and resource specifications whose characteristics differ by technology.
- Graph databases (Neo4j, Spanner Graph, JanusGraph) for topology and dependency queries in inventory, analysed in our article on network digital twins built on graphs.
- Key-value and in-memory stores (Redis, Valkey) for sessions, caches and counters.
- Search engines (OpenSearch, Elasticsearch) for free-text lookup across entities.
- Time-series databases for metrics and performance counters.
The price of separated data is that queries across services become hard. “Show me all customers affected by this fibre cut” requires joining assurance, inventory and customer data that now live in three databases. The usual answers are API composition (a service queries the others and joins in memory), read models built from events (CQRS, section 5.4) and a separate analytical platform fed by change data capture.
The transactional outbox pattern solves the most common data-plus-event bug. A service that updates its database and then publishes an event can crash between the two, leaving the database changed and the event lost (or the reverse). In the outbox pattern, the service writes the event into an “outbox” table in the same local transaction as the business change; a separate process (often Debezium reading the database log) publishes the outbox rows to the broker. The database transaction guarantees that both happen or neither does.
3.5 Distributed transactions and sagas
A business operation that changes data in several services cannot use a normal database transaction. The classic solution, two-phase commit (2PC), coordinates all participants so that they commit or abort together. It works inside a single database cluster but scales poorly across services: participants hold locks while waiting for the coordinator, a coordinator failure can leave them blocked, and many modern stores and brokers do not support it at all.
A saga replaces one distributed transaction with a sequence of local transactions, each with a compensating action. The pattern was described by Hector Garcia-Molina and Kenneth Salem in a 1987 paper and rediscovered for microservices. If step four fails, the saga runs the compensations of steps three, two and one in reverse order. Compensation is not rollback: a sent SMS cannot be unsent, so the compensation is a corrective message; an allocated IP address is released; a reserved port is freed.
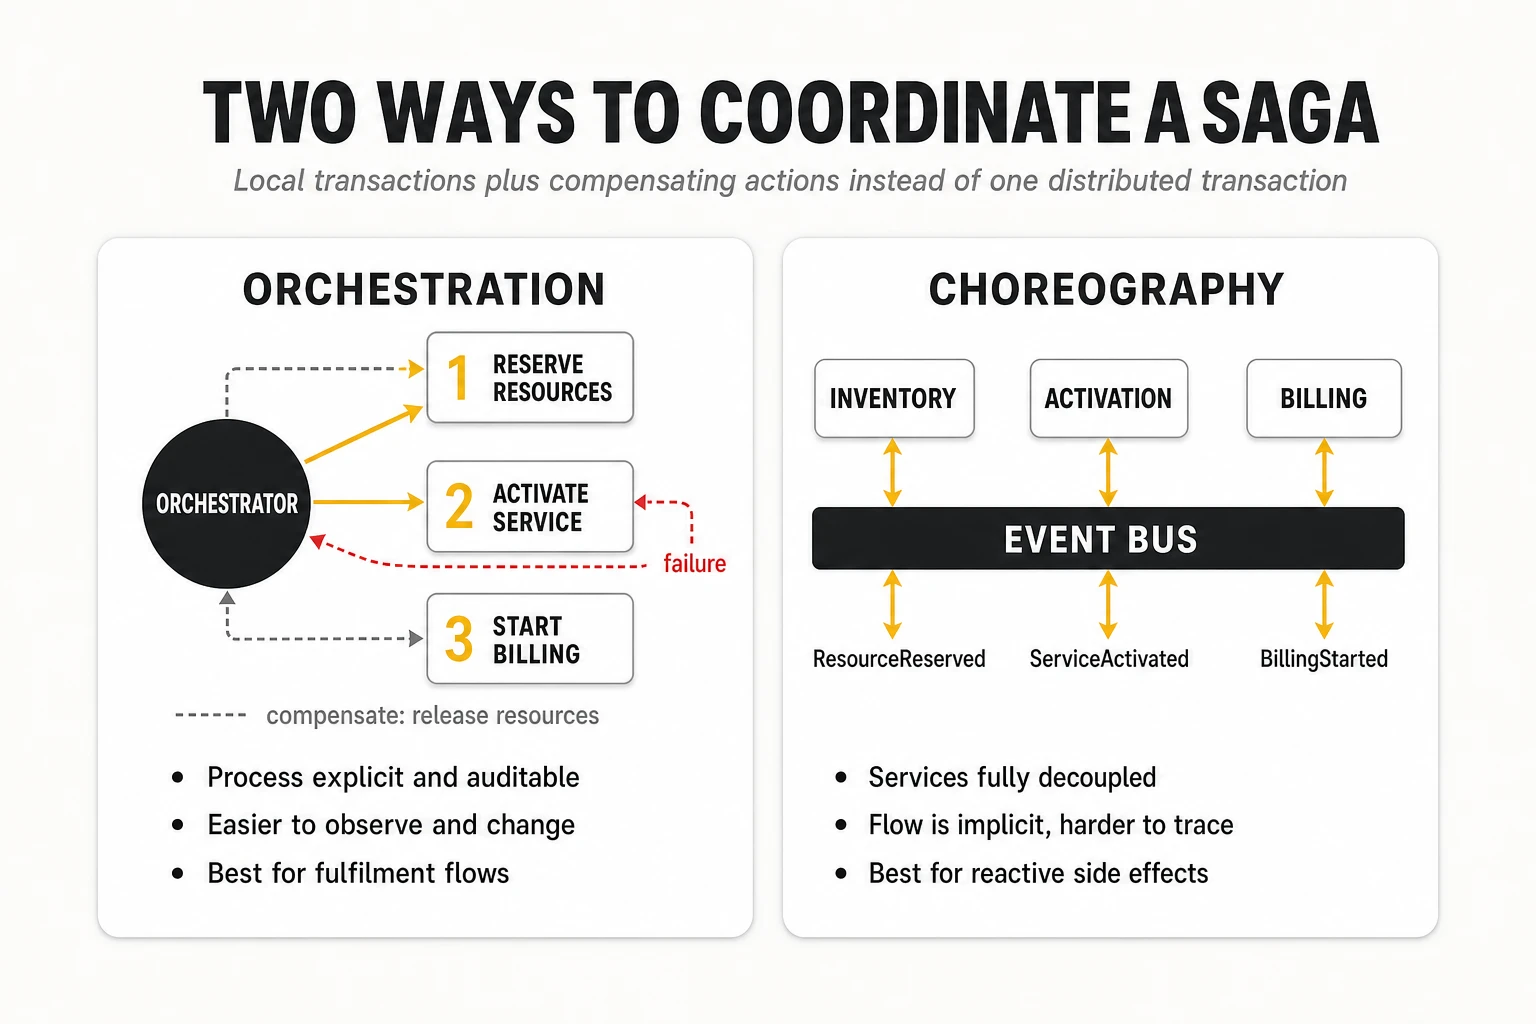
Sagas are coordinated in one of two ways.
- Orchestration: a central orchestrator (a workflow engine or a dedicated service) calls each participant in turn and decides what to do on failure. The process is explicit, visible and testable. OSS order management and provisioning naturally fit this model, and workflow engines such as Temporal, Camunda or Netflix Conductor are built for it.
- Choreography: each service listens for events and reacts by doing its part and emitting a new event. There is no central coordinator, so services are more decoupled, but the end-to-end flow exists only implicitly across many services and is hard to follow, change and debug.
TelcoCrux view: for OSS/BSS fulfilment processes, which are long-running, stateful and need to be auditable, orchestration is usually the better default. Choreography fits reactive side effects (notifications, analytics updates, cache invalidation) where no single service needs to know the whole flow.
3.6 Eventual consistency and idempotency
In a distributed system, different services will temporarily disagree about the state of the world; eventual consistency means they converge if no new updates arrive. After an order completes, the inventory may show the service active a few hundred milliseconds before the billing system starts charging, and a few seconds before the customer portal reflects it. This is acceptable for most OSS/BSS processes if it is designed for: user interfaces show “in progress” states, reports tolerate small lags and reconciliation processes detect and fix divergence.
Idempotency is the property that makes retries safe: performing an operation twice has the same effect as performing it once. Networks lose responses. A caller that does not receive an answer cannot know whether its request failed or succeeded, so it retries. If the operation is “activate service X”, a retry must not activate it twice; if it is “charge 10 euros”, a retry must not charge 20.
The standard techniques are simple and must be universal:
- Idempotency keys: the caller attaches a unique identifier to each logical request; the service stores processed keys and returns the stored result for duplicates.
- Naturally idempotent operations: “set state to active” instead of “toggle state”; HTTP PUT with the full desired state instead of POST.
- Deduplication in consumers: event consumers record the IDs of processed events and skip repeats, because most brokers deliver at least once (section 5.6).
- Conditional updates: optimistic concurrency with version numbers or ETags, so that a stale retry does not overwrite a newer change.
In network activation, idempotency is a safety property, not a convenience. A retried configuration push that duplicates a VLAN, a QoS policy or a route can cause an outage. Activation adapters should compare desired and actual configuration and apply only the difference, which is precisely what declarative models such as NETCONF/YANG and the Kubernetes reconciliation pattern encourage.
3.7 Resilience patterns: timeouts, retries, circuit breakers, bulkheads
Distributed systems fail partially, and the patterns below exist to stop a local failure from becoming a global one. They are implemented in libraries (Resilience4j in Java, Polly in .NET), in the service mesh, or both.
- Timeouts: every remote call must have one. A call without a timeout can hold a thread forever, and a slow dependency is more dangerous than a dead one because it consumes resources while appearing alive.
- Retries with exponential backoff and jitter: retry transient failures after increasing delays (100 ms, 200 ms, 400 ms…) with a random component, so that thousands of clients do not retry in synchronised waves (the “thundering herd”). Retries must be bounded and only applied to idempotent operations.
- Circuit breaker: after a threshold of failures, the caller stops calling the failing dependency (“open” state) and returns a fallback immediately; after a cool-down it lets a few test requests through (“half-open”) and resumes if they succeed. This protects both the caller’s resources and the failing service, which gets room to recover.
- Bulkhead: separate resource pools (threads, connections) per dependency, so that a slow inventory service cannot exhaust the threads needed to talk to the catalogue.
- Rate limiting and load shedding: reject excess requests early (token bucket or leaky bucket algorithms) rather than accepting work the system cannot finish.
Retries are the most dangerous of these patterns when combined carelessly. If each of four layers retries three times, a single failing request at the bottom can generate 81 attempts. Retry budgets (a cap on the share of traffic that may be retries) and retrying at only one layer are the standard mitigations.
3.8 Service discovery
Service discovery is how a service finds the network address of another service whose instances come and go. In a static data centre, addresses were configured by hand; in Kubernetes, pods get new IP addresses each time they restart.
Kubernetes provides discovery natively. A Service object gets a stable DNS name (inventory.oss.svc.cluster.local) and virtual IP; the cluster keeps the list of healthy pod endpoints behind it up to date, and kube-proxy or the CNI load-balances connections. A service mesh refines this with request-level load balancing, locality awareness and health-based routing.
Outside or across clusters, discovery needs additional tools: registries such as HashiCorp Consul or Netflix Eureka (common in Spring Cloud systems built before Kubernetes), DNS-based global load balancers, or multi-cluster service mesh configurations. For OSS/BSS platforms spanning several clusters and sites, multi-cluster discovery and failover is an explicit design topic, not a default.
3.9 Monolith, SOA or microservices: when each fits
Microservices are not the end state of every architecture; they are the right answer for a specific set of conditions. The “monolith first” advice, and the growing popularity of the modular monolith (one deployable unit with strictly separated internal modules), reflect a decade of experience with teams that split too early.
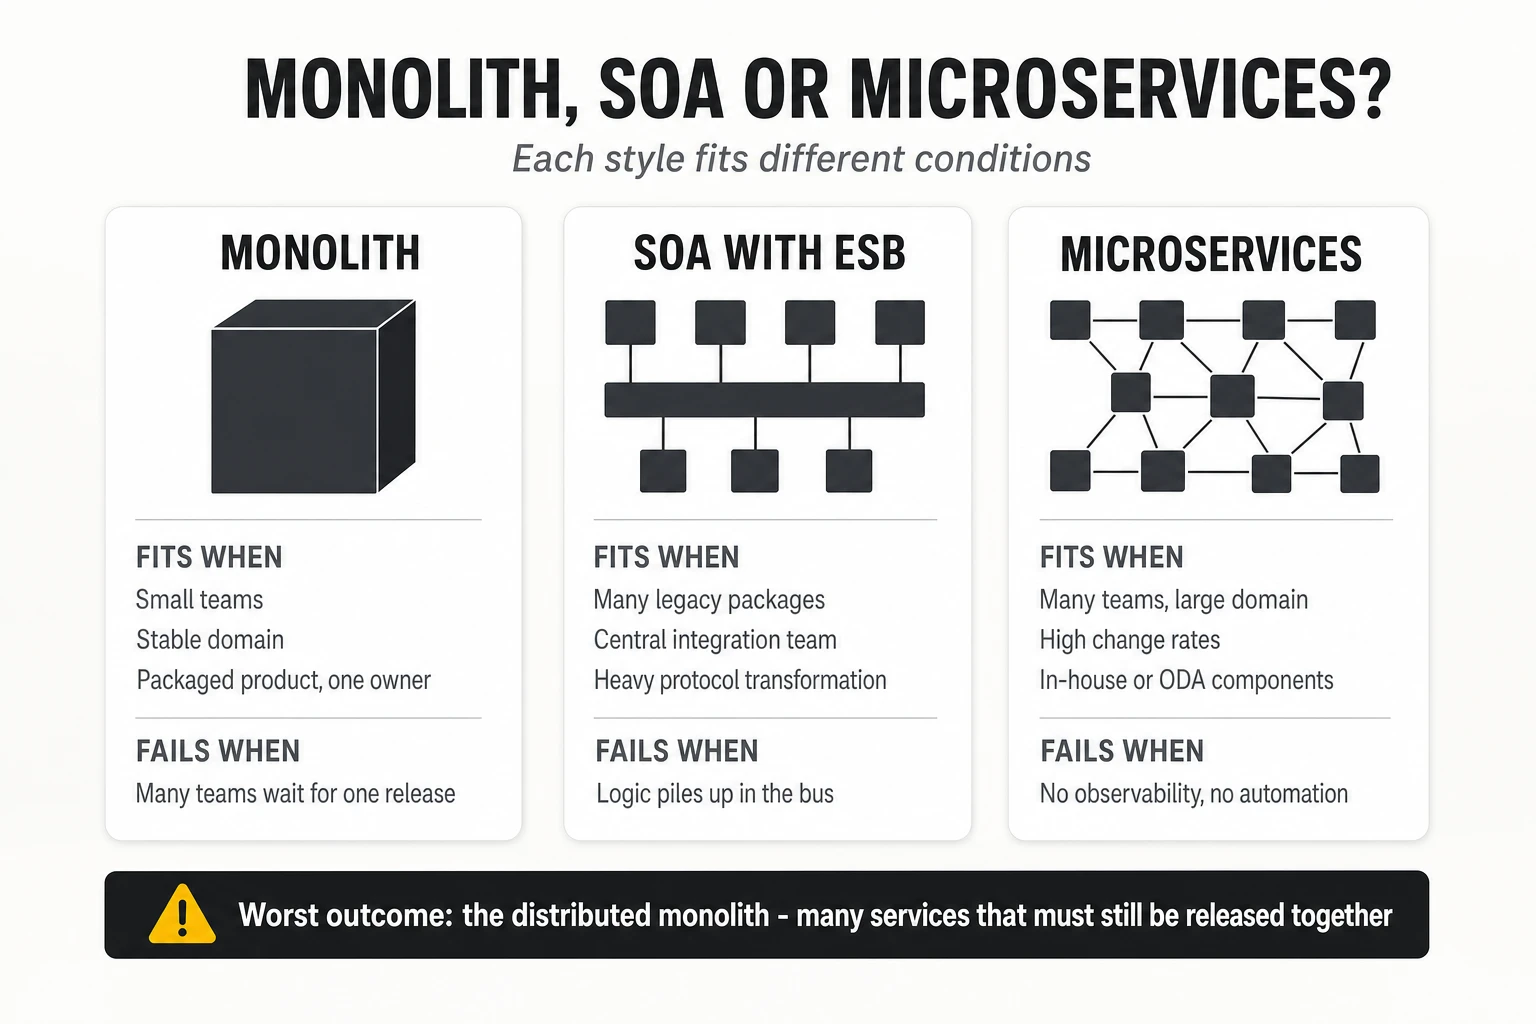
| Architecture | Advantages | Disadvantages | When it is the right choice |
|---|---|---|---|
| Monolith (including modular monolith) | Simple deployment and debugging; local transactions; low operational overhead | Whole-system releases; scaling as a block; coupling grows with time | Small teams; stable, well-understood domains; packaged products with one vendor owning the release; early product stages |
| SOA with ESB | Reuse of coarse services; central governance; mature tooling for heterogeneous legacy | Central bus becomes a bottleneck and single point of failure; logic leaks into integration | Integrating many legacy packages that cannot be changed; regulated environments with central integration teams |
| Microservices | Independent releases and scaling; technology freedom per service; fault isolation | Distributed systems complexity; data consistency; requires mature DevOps, observability and SRE | Large domains with many teams; high change rates; elastic or very high load; platforms built in-house or as ODA components |
Caption: Choosing an architecture style. TelcoCrux assessment based on public engineering literature and operator programmes.
The most expensive outcome is the distributed monolith. It looks like microservices (many repositories, many containers) but behaves like a monolith: services share databases, call each other synchronously in long chains and must be released together because their contracts are not versioned. It combines the operational burden of distribution with the release rigidity of a monolith. The symptoms are easy to detect: joint release trains, cross-service integration test environments that take days to stabilise, and outages in one service that take down the whole platform.
For OSS/BSS, a pragmatic rule emerges. Packaged products bought from a vendor can be internally monolithic as long as they expose clean, standard APIs and events and can be deployed and scaled on the operator’s platform; the operator does not gain much from the vendor’s internal decomposition. Capabilities that the operator builds or heavily customises itself, and that change frequently (catalogue-driven ordering, orchestration logic, assurance analytics), are where microservices pay back.
4. APIs and system integration
4.1 HTTP, REST and JSON
HTTP is the application protocol of almost every modern OSS/BSS interface. A client sends a request with a method (GET, POST, PUT, PATCH, DELETE), a path, headers and an optional body; the server answers with a status code, headers and a body. HTTP/1.1 opens one request at a time per connection; HTTP/2 multiplexes many requests over one connection with binary framing and header compression; HTTP/3 runs over QUIC on UDP to avoid head-of-line blocking. For OSS/BSS, HTTP/2 matters mainly because gRPC depends on it.
REST (Representational State Transfer) is an architectural style, not a protocol. Roy Fielding defined it in his 2000 doctoral dissertation as a set of constraints: client-server separation, statelessness, cacheability, a uniform interface, layering and optional code on demand. In practice, “REST API” means an HTTP API organised around resources (/productOrder/{id}) manipulated with standard methods, where:
- GET reads a resource and must not change state (it is “safe” and idempotent).
- PUT replaces a resource with the representation sent; repeating it has the same effect (idempotent).
- PATCH modifies part of a resource; whether it is idempotent depends on the patch format (JSON Merge Patch or JSON Patch).
- POST creates a resource or triggers a process; it is not idempotent, which is why idempotency keys are needed for safe retries.
- DELETE removes a resource and is idempotent.
Status codes carry the contract of failure. 2xx means success (201 Created, 202 Accepted for asynchronous processing), 4xx means the client made an error that retrying will not fix (400 invalid, 401 unauthenticated, 403 forbidden, 404 not found, 409 conflict, 422 semantically invalid, 429 rate limited), and 5xx means the server failed and a retry may succeed (500, 502, 503, 504). Misusing them, for example returning 200 with an error message in the body, breaks retries, monitoring and SLO calculations, which count 5xx responses as errors.
JSON (JavaScript Object Notation) is the dominant payload format. It is human-readable, supported by every language and schema-describable with JSON Schema. Its weaknesses are size and parsing cost compared with binary formats, the absence of native types for dates and decimals (an amount in a billing API should not be a floating-point number), and loose typing that lets malformed payloads through unless schemas are validated at the edge.
4.2 OpenAPI and Swagger
OpenAPI is the standard, machine-readable description of an HTTP API. An OpenAPI document, in YAML or JSON, lists every path, method, parameter, request body, response and security scheme, with schemas for all payloads. It started as the Swagger specification, created by Tony Tam at Wordnik in 2010; SmartBear donated it to the Linux Foundation’s OpenAPI Initiative in 2015, and it was renamed OpenAPI with version 3.0 in 2017. “Swagger” now refers to the tooling (Swagger UI, Swagger Editor, Swagger Codegen) rather than the specification. Version 3.1 (2021) aligned its schemas fully with JSON Schema, and version 3.2, published in September 2025, added features such as streaming and hierarchical tags. TM Forum’s version 5 Open APIs are published as OpenAPI 3.0 documents, while most version 4 APIs remain Swagger 2.0 files.
An OpenAPI document is useful far beyond documentation:
- Code generation of server stubs and client SDKs in many languages (OpenAPI Generator).
- Mock servers that let consumer teams build against an API before it exists (Prism, WireMock).
- Linting against style and design rules with tools such as Spectral, run in the developer’s editor and in CI.
- Request and response validation at the API gateway or in the service.
- Breaking-change detection by diffing two versions of the specification in the pipeline (oasdiff, openapi-diff).
- Conformance testing of an implementation against the standard specification, which is how TM Forum certifies Open API implementations.
API-first design means writing and reviewing the OpenAPI contract before writing code. The contract becomes the agreement between producer and consumer teams, mocks unblock parallel work, and the pipeline enforces that the implementation matches the contract. For OSS/BSS teams that integrate with many partners, this is the single most effective practice to reduce integration delays.
4.3 gRPC and Protocol Buffers
gRPC is a remote procedure call framework, open-sourced by Google in 2015, that uses HTTP/2 for transport and Protocol Buffers for serialisation. The interface is defined in a .proto file that declares services, methods and message types; code generators produce typed client and server code for each language. Messages are encoded in a compact binary format, typically several times smaller and faster to parse than equivalent JSON.
gRPC supports four interaction patterns: unary (one request, one response), server streaming, client streaming and bidirectional streaming. Streaming is what makes it attractive for telemetry: gNMI, the OpenConfig protocol for streaming network telemetry and configuration, is built on gRPC, which is why gRPC appears on both sides of the OSS boundary: between internal microservices and between OSS collectors and network elements.
| Criterion | REST/JSON | gRPC/Protobuf |
|---|---|---|
| Contract | OpenAPI (optional but recommended) | .proto file (mandatory) |
| Payload | Text JSON, human-readable | Binary, compact, not human-readable |
| Transport | HTTP/1.1, HTTP/2 or HTTP/3 | HTTP/2 |
| Streaming | Limited (server-sent events, WebSockets, webhooks) | Native, bidirectional |
| Browser and partner friendliness | Universal | Needs gRPC-Web or a gateway translation |
| Telecom standards | TM Forum Open APIs, CAMARA network APIs, most partner interfaces | gNMI/gNOI telemetry and operations, internal high-volume calls |
| Best OSS/BSS fit | External, partner-facing and standard APIs | Internal service-to-service calls with high volume or low latency; telemetry |
Caption: REST and gRPC are complementary. External and standard interfaces use REST; internal high-throughput paths may use gRPC.
GraphQL is a third option, used mainly behind digital channels. It lets a client request exactly the fields it needs from several underlying services in one query, which suits customer apps and portals that aggregate catalogue, account and usage data. It is rarely used for system-to-system OSS integration, where fixed contracts and standard APIs matter more than query flexibility.
4.4 API gateways
An API gateway is the single entry point that sits between external consumers and internal services. It decouples what consumers see (stable, public URLs and policies) from how services are deployed (many internal endpoints that change).
Its typical responsibilities:
- Routing requests to the right backend service and version.
- TLS termination and, where needed, mTLS with partners.
- Authentication and authorisation through token validation (OAuth 2.0, JWT) and API keys.
- Rate limiting and quotas per consumer, which is also how commercial API products are metered.
- Request and response transformation, including protocol translation (REST to gRPC) and header injection for trace context.
- Analytics and logging of API usage per consumer and per product.
The market includes open-source gateways (Kong, Apache APISIX, Tyk, Envoy-based gateways such as Envoy Gateway and Gloo), cloud services (AWS API Gateway, Azure API Management, Google Apigee) and full API management platforms that add developer portals, subscription management and monetisation. In Kubernetes, the Gateway API has become the standard way to declare north-south routing, replacing the limited Ingress resource with role-oriented objects (GatewayClass, Gateway, HTTPRoute, GRPCRoute) that most gateways and meshes implement.
A frequent design question is where the gateway ends and the mesh begins. The usual division is that the gateway handles north-south traffic (from outside the platform in), with consumer-facing concerns such as API keys, quotas and developer onboarding, while the mesh handles east-west traffic between services, with mTLS, retries and service-level policy. The ODA Canvas follows this split: its API operators publish each component’s exposed APIs on a gateway, while Istio secures traffic inside.
4.5 Authentication and authorisation: OAuth 2.0, OIDC, JWT and mTLS
Authentication establishes who is calling; authorisation decides what they may do. Modern OSS/BSS separates both from application code and delegates them to an identity provider (Keycloak, Microsoft Entra ID, Okta, Ping, ForgeRock) and to the gateway or mesh.
OAuth 2.0 (RFC 6749, 2012) is an authorisation framework in which a client obtains an access token from an authorisation server and presents it to a resource server. The flows that matter in OSS/BSS are:
- Client credentials: a system authenticates as itself (BSS calling OSS, an orchestrator calling inventory). There is no user.
- Authorisation code with PKCE: a user logs in through a browser or mobile app, which receives a token on the user’s behalf. PKCE protects public clients that cannot hold a secret.
- Token exchange and on-behalf-of flows: a service passes the user’s identity downstream with reduced scope, preserving accountability across a call chain.
OpenID Connect (OIDC) adds authentication on top of OAuth 2.0 with an ID token that describes the user, and is the standard for single sign-on to OSS/BSS user interfaces. Access tokens are usually JSON Web Tokens (JWT): signed JSON documents carrying claims (subject, audience, expiry, scopes, roles) that services can validate locally with the issuer’s public key, without calling the identity provider on every request.
Mutual TLS (mTLS) authenticates both ends of a connection with certificates. It is the standard for service-to-service identity inside a mesh and is increasingly used with partners and between operator domains, often combined with OAuth tokens bound to the client certificate. The operational challenge is certificate lifecycle at scale: issuing, rotating and revoking certificates for thousands of workloads, which is why meshes automate it with short-lived certificates and SPIFFE identities.
Authorisation logic is moving out of code as well. Coarse rules (“only the order service may call activation”) live in mesh policies; fine-grained rules (“a wholesale partner may only see its own orders”) are evaluated by policy engines such as Open Policy Agent or by the identity platform. For OSS/BSS exposed to partners and to network API consumers, this separation is what makes multi-tenancy auditable.
4.6 Versioning and contract management
Every API will change, and the discipline of managing that change determines whether services can be released independently.
The first rule is to distinguish compatible from breaking changes. Adding an optional field to a response or a new optional parameter is compatible, as long as clients ignore unknown fields (the “tolerant reader” principle). Removing a field, renaming it, changing its type, making an optional field mandatory or changing the meaning of a value is breaking.
Versioning strategies, in order of prevalence:
- Major version in the URL path (
/tmf-api/productOrderingManagement/v4/,/v5/). Explicit and easy to route; used by TM Forum Open APIs. Old and new versions run side by side during a migration window. - Version in a header or media type, which keeps URLs stable but is harder to test and route.
- Semantic versioning of the contract (SemVer: MAJOR.MINOR.PATCH), where only a MAJOR change is allowed to break clients.
Consumer-driven contract testing verifies compatibility before deployment rather than in production. With tools such as Pact, each consumer publishes the interactions it relies on; the provider’s pipeline replays them against the new version and fails the build if any would break. This replaces large, slow end-to-end integration environments with fast checks per service, and is one of the practical enablers of independent deployability.
Contract management also covers deprecation. A deprecated API version should carry a sunset date (the HTTP Deprecation and Sunset headers exist for this), usage should be monitored per consumer so that owners know who is still calling it, and removal should follow a published policy. In OSS/BSS, where some consumers are partners and wholesale customers bound by contracts, deprecation periods of six to twelve months are common.
4.7 TM Forum Open APIs
The TM Forum Open APIs are a library of more than 60 standard REST interfaces, published as OpenAPI specifications, that cover the main operator domains. They define resource models (based on the SID information framework), operations, state machines and event notifications, so that a product order, a service order or an alarm has the same structure regardless of vendor. The specifications are published openly in the tmforum-apis GitHub organisation and through the TM Forum Open API table.
| API | Name | Domain | Role in the order-to-activate and trouble-to-resolve flows |
|---|---|---|---|
| TMF620 | Product Catalog Management | Core commerce | Product offerings, specifications and prices |
| TMF622 | Product Ordering Management | Core commerce | Customer orders and their lifecycle |
| TMF637 | Product Inventory Management | Core commerce | Products a customer owns |
| TMF641 | Service Ordering Management | Production | Service orders from BSS to OSS |
| TMF638 | Service Inventory Management | Production | Service instances (CFS/RFS) and their relationships |
| TMF640 | Service Activation and Configuration | Production | Activation and configuration of services on resources |
| TMF639 | Resource Inventory Management | Production | Physical, logical and virtual resources |
| TMF642 | Alarm Management | Production / assurance | Alarms, acknowledgement and clearing |
| TMF621 | Trouble Ticket Management | Assurance / engagement | Customer and network trouble tickets |
| TMF921 | Intent Management | Intelligence / autonomy | Declarative intents and intent reports |
Caption: The TM Forum Open APIs most relevant to OSS/BSS engineering.
Three design features of the Open APIs matter for engineers.
- Polymorphism and extension. Entities carry
@type,@baseTypeand@schemaLocationattributes, so that an implementation can extend a standard entity (for example a fibre-specific resource) with additional attributes described in its own schema, without breaking standard clients. - Characteristics as name-value lists. Product, service and resource specifications describe technology-specific attributes as characteristic lists rather than fixed fields. This keeps the API generic but moves validation into catalogue-driven logic, which is a frequent source of integration ambiguity between vendors.
- Event notifications. Each API defines events (for example
ProductOrderStateChangeEvent) and a hub mechanism through which consumers register callbacks; the generic TMF688 Event Management API extends this towards brokers.
Conformance is the weak point. TM Forum runs a conformance certification programme, and many vendors certify their APIs. Certification proves that an implementation accepts and returns the standard structures; it does not guarantee that two certified products interpret characteristics, states and extensions in the same way. TelcoCrux view: Open APIs reduce integration effort substantially, but an operator still needs its own profile of each API (which optional fields, which characteristics, which states, which extensions) and a conformance test suite that enforces it.
4.8 ESB, iPaaS, ETL/ELT, CDC and integration middleware
APIs are only one integration style. An operator’s estate also moves data in bulk, synchronises databases, transforms formats and connects SaaS applications, and different tools solve each of these.
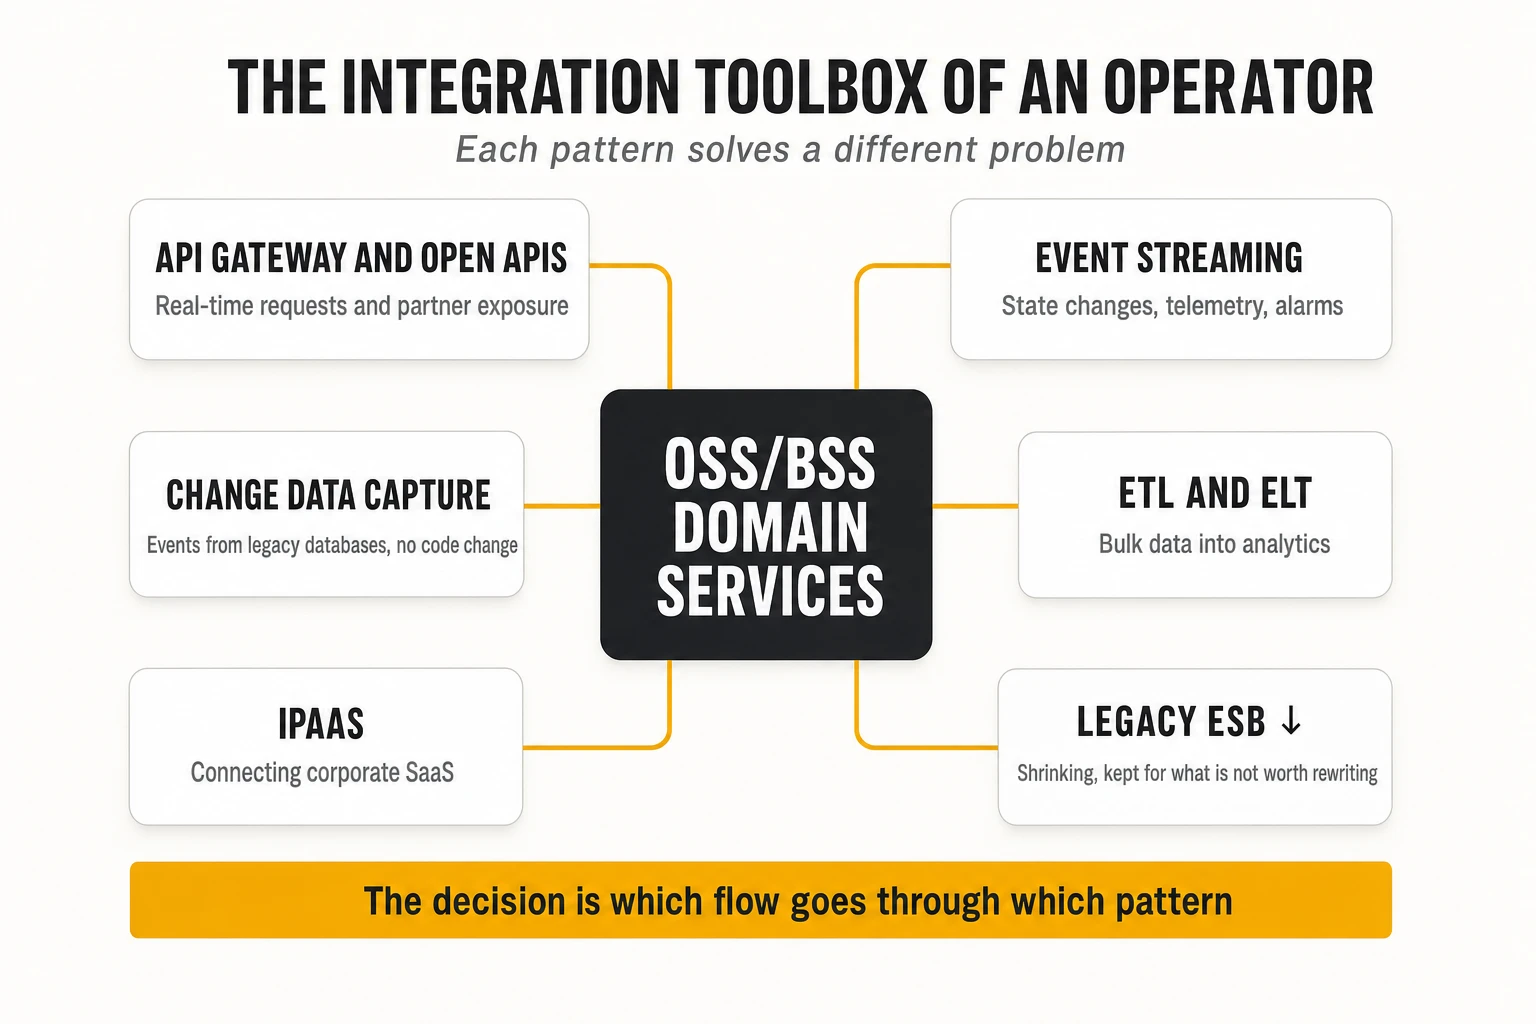
| Pattern | How it works | Strengths | Weaknesses | Typical OSS/BSS use |
|---|---|---|---|---|
| ESB (Enterprise Service Bus) | Central middleware that routes, transforms and orchestrates messages between systems | Mature; strong transformation and protocol adapters for legacy (SOAP, JMS, files, mainframe) | Central bottleneck; business logic accumulates in the bus; specialised team | Legacy integration that cannot be rewritten; gradual strangler migration |
| API-led integration | Systems expose APIs; consumers call them directly or through a gateway | Real-time; decentralised ownership; standard contracts | Synchronous coupling; needs governance and versioning | Order capture, catalogue lookup, inventory queries, partner exposure |
| Event streaming | Producers publish events to a broker; consumers subscribe | Temporal decoupling; replay; scales to very high volume | Eventual consistency; harder debugging; schema governance | State changes, telemetry, alarms, notifications |
| iPaaS (integration platform as a service) | Cloud-hosted low-code integration with pre-built connectors (MuleSoft, Boomi, Workato, Azure Logic Apps) | Fast for SaaS-to-SaaS and standard connectors; managed | Per-flow or per-connector cost; limited for high-volume or low-latency flows | CRM, ERP, HR and finance SaaS integration around the BSS |
| ETL / ELT | Extract data in bulk, transform, load into an analytical store (ETL transforms before loading; ELT loads raw data and transforms inside the warehouse) | Efficient for large historical datasets and analytics | Batch latency (hours); not for operational flows | Data warehouse, revenue assurance, regulatory reporting |
| CDC (change data capture) | Reads the database transaction log and emits every insert, update and delete as an event | Near-real-time; no changes to the source application; no polling | Exposes internal schemas unless curated; ordering and schema-change handling | Feeding events from legacy systems; outbox publishing; analytics replication |
Caption: Integration patterns compared. TelcoCrux assessment.
Change data capture deserves special attention in OSS/BSS modernisation. Tools such as Debezium, an open-source project now hosted by the Commonhaus Foundation, read the write-ahead log of PostgreSQL, the binlog of MySQL or the redo log of Oracle and publish each change to Kafka. This turns a legacy inventory or order management database, whose code nobody wants to touch, into a source of events that new services can consume. It is the backbone of the “strangler fig” migration pattern: new capabilities are built around the legacy system, fed by its events, until the legacy core can be retired. The risk is that consumers couple to the legacy table structure; the mitigation is to translate raw change events into curated domain events before wider consumption.
The modern integration architecture is a combination, not a replacement. TelcoCrux view: in a typical operator in 2026, Open APIs carry real-time requests, a streaming platform carries state changes and telemetry, CDC bridges legacy databases into that platform, ELT feeds analytics, iPaaS connects corporate SaaS, and a shrinking ESB keeps the legacy integrations that are not yet worth rewriting. The architectural decision is which flow goes through which pattern, and who owns each.
5. Event-driven architectures
5.1 Events, commands and the publish/subscribe model
An event is an immutable record that something happened: “ProductOrder 4711 was completed at 10:42:03”. It is named in the past tense, it cannot be rejected (the fact already occurred) and the producer does not know or care who consumes it. A command, by contrast, is a request for something to happen (“activate service X”), addressed to a specific receiver that may refuse it. Mixing the two, for instance publishing “ActivateService” events that only one consumer is expected to act on, is a common design error that reintroduces coupling through the broker.
Event-Driven Architecture (EDA) is a style in which services communicate primarily by publishing and reacting to events. Its core mechanism is publish/subscribe: producers publish events to a named channel; any number of consumers subscribe and receive a copy; the broker in between stores and delivers. Adding a new consumer requires no change to the producer, which is the main source of EDA’s flexibility: a new fraud detection, analytics or notification service can be attached to existing order events without touching order management.
Events come in three common shapes, and choosing deliberately matters:
- Notification events carry only an identifier and a type (“order 4711 changed”); consumers call back for details. Small, but they generate extra API calls.
- Event-carried state transfer includes the full new state of the entity, so consumers need no callback and can build their own local copies.
- Delta events carry only the changed attributes, which is compact but requires consumers to hold previous state.
5.2 Anatomy of a broker: producers, consumers, topics, partitions and offsets
A message broker is the infrastructure that receives, stores and delivers messages. Its vocabulary differs between products, but the concepts below, described in Apache Kafka’s terms, are the ones every OSS/BSS architect needs.
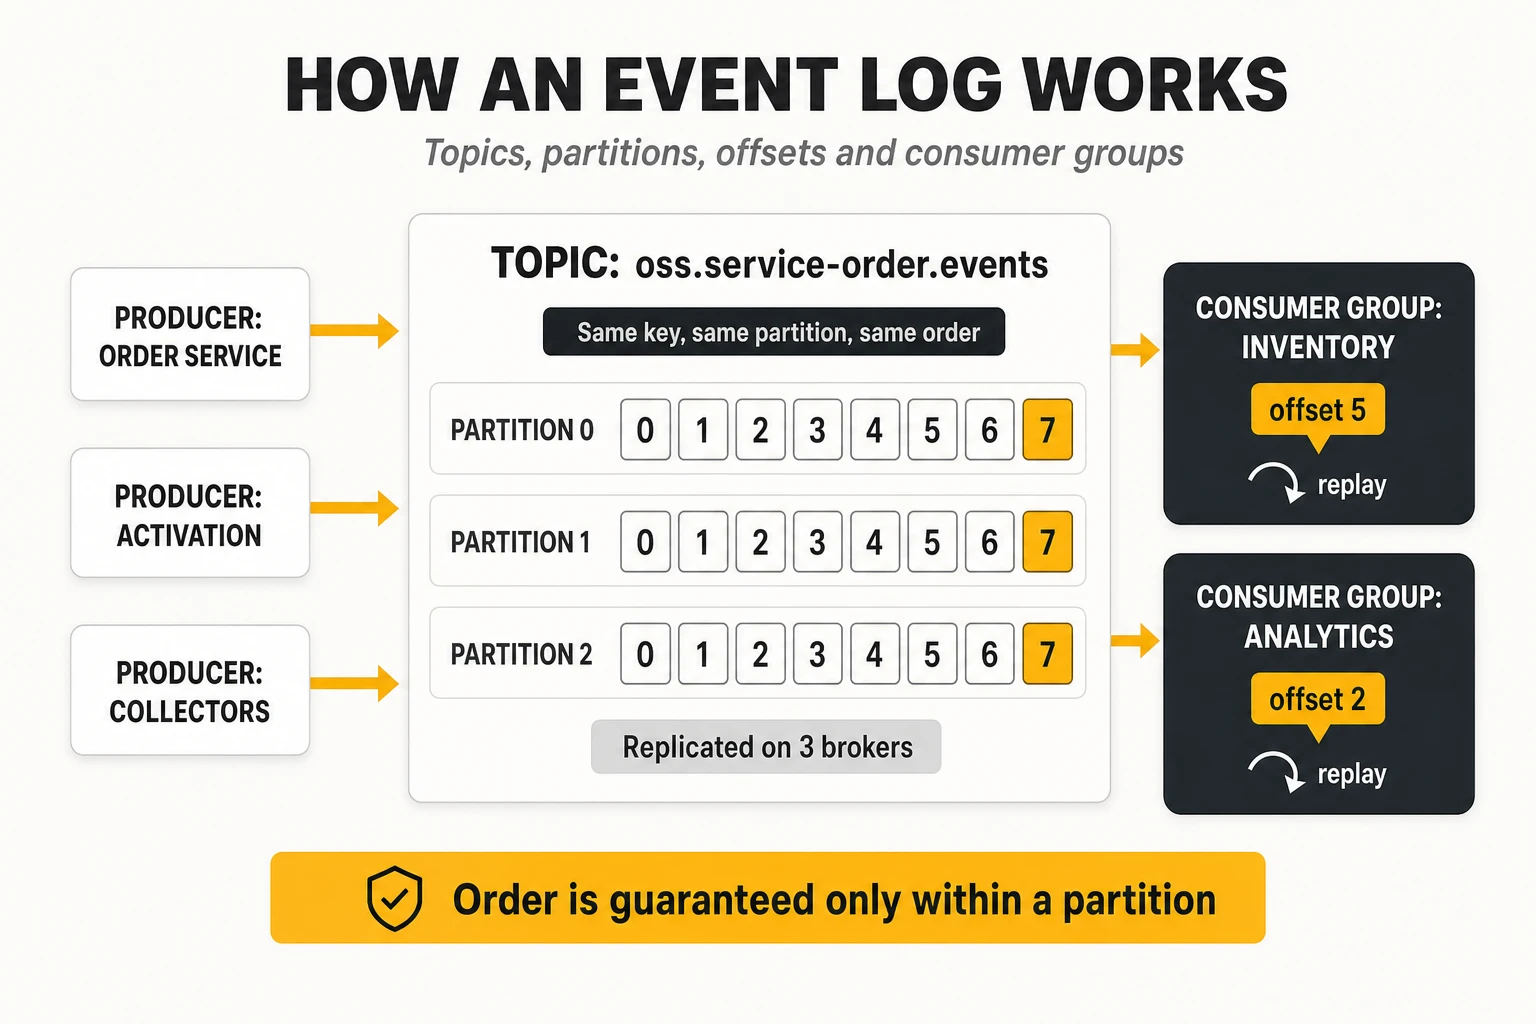
- Producer: an application that writes events, choosing a topic and usually a key.
- Topic: a named stream of events of one kind (
oss.service-order.events). - Partition: a topic is split into partitions, each an ordered, append-only log stored on disk. Partitions are the unit of parallelism and ordering: events with the same key always go to the same partition, so all events for one service order or one subscriber stay in order.
- Offset: the sequential position of an event within a partition. Consumers track which offset they have processed; because events are not deleted when read, a consumer can rewind its offset and replay history.
- Consumer group: a set of consumer instances that share the work of reading a topic, each partition assigned to one instance at a time. Different groups read the same topic independently, each at its own offset.
- Replication: each partition is copied to several brokers (typically three); one is the leader, the others followers. If the leader fails, a follower takes over.
- Retention: events are kept for a configured time or size, or compacted so that only the latest event per key remains, which turns a topic into a durable table of current state.
The partition key is the most consequential design decision in an event-driven OSS. If service order events are keyed by order ID, all events of an order are processed in sequence; if they are keyed randomly, an “order cancelled” event may overtake “order created”. If alarms are keyed by network element, one noisy element can overload a single partition (“hot partition”). The key must reflect the unit whose order matters.
5.3 Kafka, RabbitMQ, Pulsar and other brokers
Apache Kafka is a distributed, replicated commit log designed for very high-throughput event streaming. Created at LinkedIn and open-sourced in 2011, it stores events durably on disk, lets consumers pull at their own pace and replay at will, and scales horizontally by adding partitions and brokers. Kafka 4.0, released in March 2025, completed the long migration away from Apache ZooKeeper: clusters now manage their own metadata with the built-in KRaft consensus protocol, which simplifies operations considerably. Kafka 4.2 (February 2026) made share groups (“queues for Kafka”) production-ready, letting several consumers process messages of the same partition with per-message acknowledgement, which narrows the historical gap with traditional queues. Around Kafka sits an ecosystem that matters as much as the broker: Kafka Connect for integration with databases and systems, Kafka Streams for processing, schema registries, and managed services (Confluent Cloud, Amazon MSK, Aiven, Redpanda as a Kafka-compatible alternative).
RabbitMQ is a general-purpose message broker built around flexible routing. Producers publish to exchanges, which route messages to queues according to bindings (direct, topic patterns, fan-out, headers). Consumers receive messages pushed by the broker and acknowledge them, after which they are removed. RabbitMQ implements AMQP 0-9-1 natively and supports MQTT and STOMP. Its quorum queues, based on the Raft protocol, provide replicated, durable queues (classic mirrored queues were removed in RabbitMQ 4.0 in 2024), and its streams feature adds a Kafka-like append-only log with replay for cases that need it.
Apache Pulsar separates compute from storage. Stateless Pulsar brokers serve producers and consumers, while Apache BookKeeper nodes store the data in segments. This allows brokers and storage to scale independently, supports tiered storage to object stores and offers built-in multi-tenancy and geo-replication. It unifies streaming and queuing semantics in one system. Its operational footprint (brokers, BookKeeper and a metadata store) and smaller ecosystem are the trade-offs.
| Criterion | Apache Kafka | RabbitMQ | Apache Pulsar |
|---|---|---|---|
| Core model | Partitioned, replicated log; consumers pull | Queues with exchange-based routing; broker pushes | Segmented log on BookKeeper; brokers stateless |
| Retention and replay | Native; time, size or compaction based | Messages removed after acknowledgement (streams add replay) | Native, with tiered storage |
| Ordering | Per partition (share groups trade ordering for parallelism) | Per queue (single consumer) | Per partition / key |
| Routing flexibility | Basic (topic and key) | Very rich (exchanges, bindings, headers) | Moderate (topics, subscriptions types) |
| Throughput profile | Very high, optimised for sequential disk I/O | High for task queues; lower for very large streams | Very high, independent scaling of storage |
| Multi-tenancy, geo-replication | Via configuration and tools (MirrorMaker, Cluster Linking) | Federation and shovel plug-ins | Built in |
| Ecosystem maturity in telecom | Dominant: telemetry, CDC, OSS events, ODA reference | Common in application task queues and legacy integration | Niche, growing |
| Best OSS/BSS fit | Event backbone, telemetry, alarms, CDC, audit | Work queues, command dispatch, request/reply between services | Large multi-tenant or multi-region streaming with heavy retention |
Caption: The three main open-source brokers compared. Throughput depends heavily on hardware, message size and configuration; published benchmarks are vendor- or author-specific.
Other options fill specific niches. NATS (with JetStream) offers very lightweight, low-latency messaging suited to edge and control-plane signalling. MQTT brokers serve IoT devices. Cloud-native services (Amazon Kinesis, SQS/SNS, Google Pub/Sub, Azure Event Hubs, which exposes a Kafka-compatible endpoint) remove broker operations at the price of portability. For OSS/BSS, Kafka has become the default backbone, and TelcoCrux’s view is that the burden of proof lies on choosing something else.
5.4 Event sourcing and CQRS
Event sourcing stores the sequence of events that changed an entity instead of only its current state. The current state of a service order is reconstructed by replaying “created”, “validated”, “decomposed”, “activation started”, “activation completed”. The event log is the source of truth; current-state tables are derived views. This provides a perfect audit trail, the ability to reconstruct the state at any past moment, and the possibility of building new views from history. It also brings costs: schema evolution of stored events, snapshotting to avoid replaying millions of events, and a programming model unfamiliar to most teams.
CQRS (Command Query Responsibility Segregation) separates the model that handles writes from the models that serve reads. Commands update a write model optimised for consistency; events from that model update one or more read models optimised for specific queries (a search index, a graph of dependencies, a denormalised view for the customer portal). CQRS is often combined with event sourcing but does not require it.
In OSS/BSS, CQRS is more widely useful than full event sourcing. A resource inventory, for example, may keep its authoritative write model in a relational database while feeding a graph read model for impact analysis, a search index for the user interface and a Kafka topic for downstream consumers. Full event sourcing fits well where audit and history are first-class requirements: order lifecycles, billing ledgers, configuration change history.
5.5 Stream processing in real time
Stream processing computes continuously over unbounded flows of events, instead of running queries over data at rest. In OSS/BSS it powers alarm correlation, KPI computation, threshold detection, usage aggregation for charging, fraud detection and enrichment of telemetry with inventory context.
The main engines differ in deployment model and power. Apache Flink, whose 2.0 release in March 2025 moved state to remote storage for cloud-native deployments, is the reference for stateful, low-latency processing with exactly-once state guarantees, event-time semantics and very large state; it runs as a separate cluster. Kafka Streams is a Java library embedded in ordinary services, which makes it simple to deploy for processing within Kafka. Spark Structured Streaming suits teams already invested in Spark, with a micro-batch heritage. Streaming databases (RisingWave, Materialize) and Flink SQL let analysts express continuous queries in SQL.
Three concepts define correctness in stream processing:
- Windows group events in time: tumbling windows are fixed and non-overlapping (alarm counts per minute), sliding windows overlap (5-minute average every 30 seconds), session windows close after a period of inactivity (a user session, an alarm storm).
- Event time versus processing time: a performance counter generated at 10:00:00 may arrive at 10:00:45 because of network delay. Correct analytics use the time the event happened, not the time it arrived.
- Watermarks tell the engine how long to wait for late events before closing a window, trading completeness against latency.
The data and processing layer behind network assurance, including how these engines are combined with storage and analytics, is analysed in depth in our article on the data layer of autonomous networks.
5.6 The hard problems: order, duplication, consistency, retries, errors and schemas
Event-driven systems trade the obvious failures of synchronous calls for subtler ones. Each of the problems below must be designed for explicitly; none is solved by the broker alone.
Delivery semantics. Brokers offer at-most-once delivery (messages may be lost, never duplicated), at-least-once (never lost, may be duplicated) or, within limits, exactly-once. Kafka supports idempotent producers and transactions that give exactly-once semantics for read-process-write flows inside Kafka; as soon as a consumer calls an external system (a database, a network controller), duplicates are possible again. The practical rule is to assume at-least-once delivery and make every consumer idempotent (section 3.6).
Ordering. Order is guaranteed only within a partition. Events about the same entity must share a key; events about different entities have no guaranteed relative order. Retries can also reorder events: if event 5 fails and is retried after event 6 succeeds, the consumer sees 6 before 5. Consumers that care about order should check version numbers or sequence fields and discard or defer out-of-order events.
Consistency. A consumer’s view lags the producer’s. Designs must tolerate reading stale data, and processes that require a definitive answer (“is this port free?”) must ask the owning service synchronously or use reservations with expiry.
Retries and error handling. A consumer that fails on a message has three options: retry immediately, retry later, or set the message aside. The standard pattern combines bounded retries with backoff, separate retry topics with increasing delays, and a dead-letter queue (DLQ) for messages that still fail, where they are inspected, fixed and replayed. A “poison message” that always fails must never block a partition: without a DLQ, one malformed alarm can stop all processing behind it.
Schema evolution. Producers and consumers evolve independently, so event schemas must too. Formats with explicit schemas (Apache Avro, Protocol Buffers, JSON Schema) are registered in a schema registry (Confluent Schema Registry, Apicurio, Karapace), which enforces a compatibility mode on every new version:
- Backward compatible: new consumers can read old events (for example, adding a field with a default).
- Forward compatible: old consumers can read new events (they ignore added fields).
- Full compatibility: both, which is the safest default for widely consumed topics.
Standards for describing events are maturing. AsyncAPI does for event-driven interfaces what OpenAPI does for REST: it describes channels, messages and bindings in a machine-readable document that tools can lint, mock and generate code from. CloudEvents, a CNCF specification, standardises event metadata (source, type, id, time) so that events can be routed and traced across platforms. TM Forum’s TMF688 and the event sections of each Open API define the telecom payloads. Using all three together (CloudEvents envelope, TM Forum payload, AsyncAPI description) gives an OSS event backbone the same contract discipline as its APIs.
6. Observability of distributed applications
6.1 Monitoring versus observability
Monitoring answers questions you knew to ask in advance; observability lets you answer questions you did not anticipate. Traditional monitoring checks predefined conditions: is the server up, is CPU above 90%, did the nightly job finish. It is well suited to monoliths, where failure modes are few and familiar. In a system of hundreds of services, the failure that matters is usually new: a specific product type, through a specific API version, hitting a specific inventory shard, slows down only when a certain partner sends large payloads. No dashboard was built for that combination.
Observability is the property of a system whose internal state can be inferred from the telemetry it emits. The term comes from control theory; in software it was popularised by engineers at Twitter, Honeycomb and Google around 2016-2018. In practice, it means instrumenting software so that every request leaves enough high-cardinality, correlated data (which customer, which order, which version, which pod) to slice and investigate any behaviour after the fact. Monitoring remains part of observability: alerts still fire on known conditions. The difference is the ability to investigate beyond them.
6.2 Metrics, logs and traces
Telemetry comes in three main signals, each answering a different question.
- Metrics are numeric measurements aggregated over time: request counts, error counts, latency distributions, queue lengths, memory use. They are cheap to store and query, ideal for dashboards and alerts, and answer “is something wrong, and how much?”. Their main types are counters (only increase), gauges (go up and down) and histograms (distributions of values in buckets, from which percentiles are computed).
- Logs are timestamped records of discrete events, ideally structured as JSON with consistent fields rather than free text. They carry detail (“validation failed: characteristic ‘bandwidth’ missing in order 4711”) and answer “what exactly happened here?”.
- Traces follow one request across all the services it touches. A trace is a tree of spans, each representing a unit of work (an HTTP call, a database query, a Kafka publish) with start time, duration, attributes and status. They answer “where did the time go, and where did it fail?”.
Context propagation is what makes traces possible. When a service receives a request, it reads a trace identifier from an HTTP header defined by the W3C Trace Context recommendation (traceparent), creates its own span as a child, and passes the identifier on in every outgoing call and every message it publishes. If one service in the chain drops the header, the trace breaks into disconnected pieces. Propagation through Kafka messages, batch jobs and workflow engines is where most OSS traces break in practice.
Correlation across signals is the real value. A metric alert shows that the error rate of the activation service rose; exemplars attached to the latency histogram point to specific slow traces; the trace shows that the span calling a network controller timed out; the trace ID in the log lines of that span reveals the controller’s error message. When metrics, traces and logs share identifiers and resource attributes (service name, version, pod, cluster), that investigation takes minutes. When they live in separate tools with separate naming, it takes hours.
Two further signals are emerging. Continuous profiling records where CPU and memory are spent inside code over time, and OpenTelemetry is standardising it as a fourth signal: the profiles signal entered public alpha in March 2026. Events, in the sense of significant state changes (deployments, configuration changes, feature flag toggles), are increasingly overlaid on dashboards because a large share of incidents start with a change.
6.3 Latency, percentiles, saturation and the golden signals
Averages hide the experience of the users who matter most. If 99 requests take 50 ms and one takes 5 seconds, the average is about 100 ms, which describes nobody. Latency is therefore measured in percentiles: p50 (median), p95, p99 and p99.9. The p99 is the latency that 1% of requests exceed. In a system where one user action triggers dozens of backend calls, tail latency compounds: if a page needs 20 calls and each has a 1% chance of being slow, about 18% of page loads will include at least one slow call.
Percentiles cannot be averaged. The p99 of a service is not the average of the p99s of its instances. They must be computed from histograms aggregated across instances, which is why metric systems store histogram buckets rather than precomputed percentiles.
Three compact frameworks tell engineers what to measure.
- The four golden signals, from the Google SRE book: latency, traffic, errors and saturation.
- RED (Rate, Errors, Duration) for request-driven services: how many requests, how many failed, how long they took.
- USE (Utilisation, Saturation, Errors) for resources: CPU, memory, disks, connection pools, queues.
Saturation is the most neglected of them and the best predictor of trouble. It measures how “full” a constrained resource is: database connection pool usage, thread pool queue length, Kafka consumer lag, disk I/O wait. Services usually degrade sharply when a resource approaches saturation, long before CPU looks high. For an OSS event pipeline, consumer lag (how far a consumer group is behind the latest offset) is the single most useful saturation metric: it shows that alarms or orders are waiting even if every service reports healthy.
6.4 OpenTelemetry
OpenTelemetry (OTel) is the vendor-neutral standard for generating, collecting and exporting telemetry. It was formed in 2019 by merging two earlier projects, OpenTracing and OpenCensus, and graduated in the CNCF in May 2026, backed by every major observability vendor and cloud provider. Traces, metrics and logs are stable in most language SDKs, although maturity still varies by language. Its significance is strategic: instrumentation, the expensive and invasive part of observability, is written once against an open API, and the backend can be changed without touching application code.
OpenTelemetry has five building blocks:
- Specification and semantic conventions: standard names for attributes (
http.request.method,db.system,messaging.destination.name,service.name), so that telemetry from different services and languages can be correlated. - APIs and SDKs for each major language, used to create spans, record metrics and emit logs.
- Automatic instrumentation agents and libraries that instrument common frameworks (HTTP servers, gRPC, JDBC, Kafka clients) without code changes, plus a Kubernetes operator that injects them.
- OTLP, the OpenTelemetry Protocol, over gRPC or HTTP, for transporting all signals.
- The OpenTelemetry Collector, a pipeline component that receives telemetry (OTLP, Prometheus, Jaeger, syslog, many others), processes it (batching, filtering, attribute enrichment, sampling, redaction of personal data) and exports it to one or several backends.
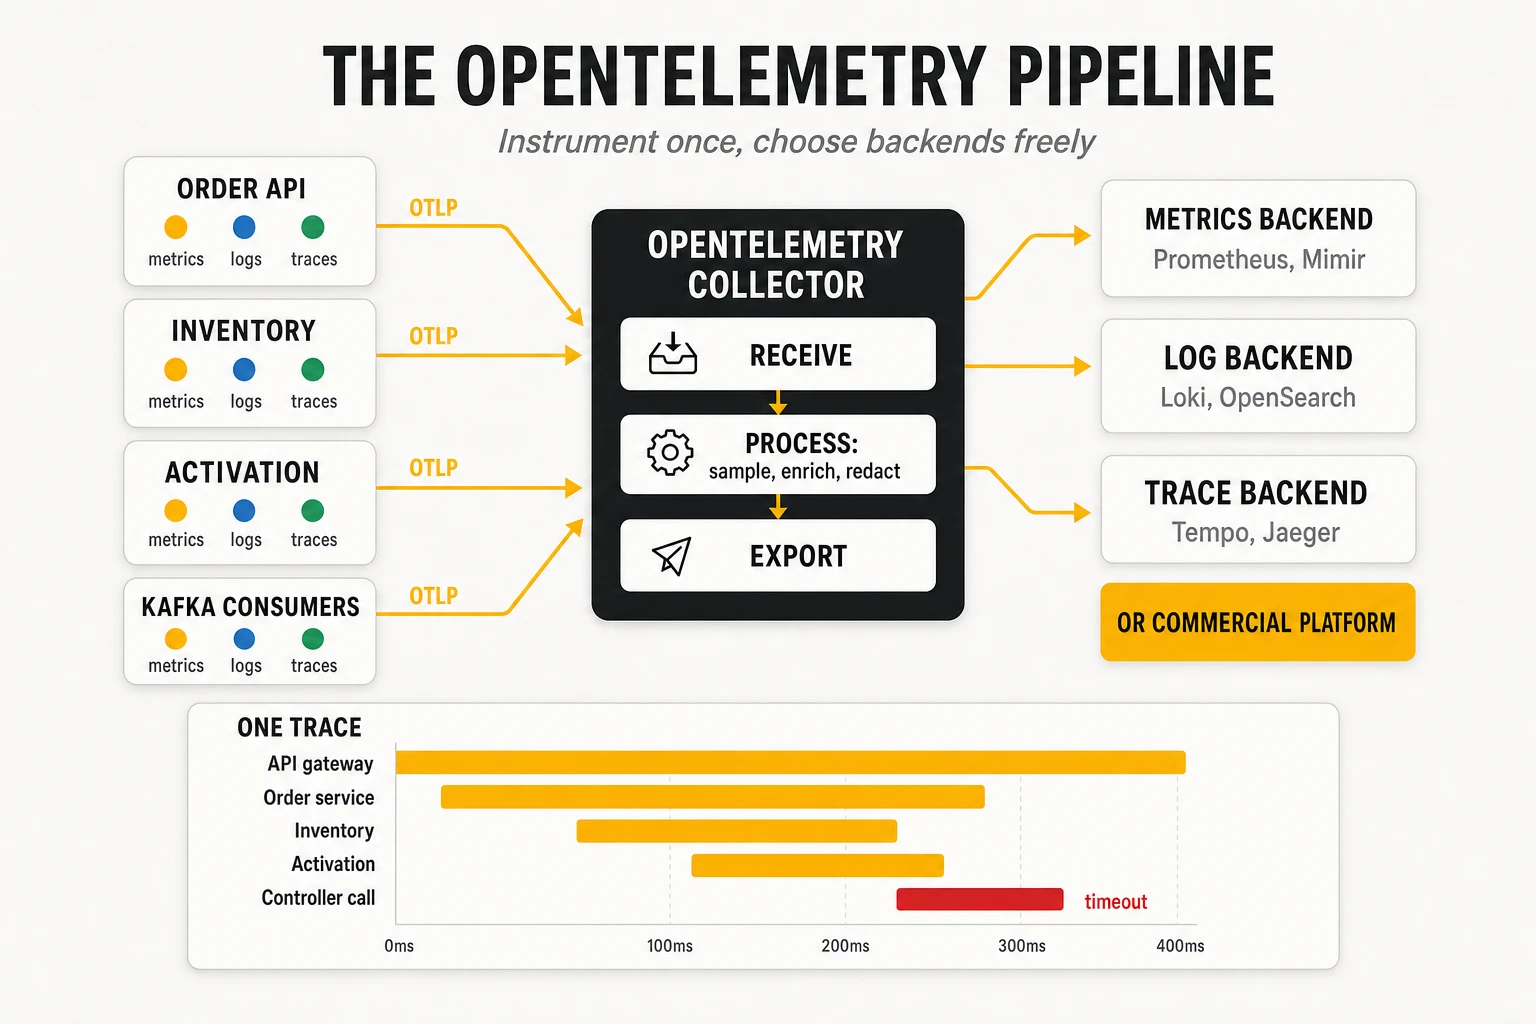
Sampling is the main cost lever for traces. Recording every span of every request in a high-volume OSS is expensive. Head-based sampling decides at the start of a trace (for example keep 5%); tail-based sampling, done in the Collector, decides after the trace completes and can keep all traces with errors or high latency while discarding most successful fast ones. Tail sampling gives far better diagnostic value per stored byte but requires the Collector to buffer whole traces.
6.5 Prometheus, Grafana, Jaeger, Tempo and commercial platforms
The open-source observability stack has converged around a few projects.
- Prometheus is a time-series database and monitoring system, the second project to graduate from the CNCF after Kubernetes. It scrapes metrics from HTTP endpoints (
/metrics) on a pull model, stores them with labels, evaluates alerting rules written in PromQL and sends alerts to Alertmanager for grouping, silencing and routing. Prometheus 3.0 (November 2024) added native OTLP ingestion and UTF-8 metric names, which removes much of the friction of combining it with OpenTelemetry. Single Prometheus servers are not built for long-term, global storage; Thanos, Cortex, Grafana Mimir and VictoriaMetrics add horizontal scale and retention. - Grafana is the visualisation layer that queries Prometheus, Loki, Tempo, Elasticsearch, SQL databases and many commercial backends, and links them in dashboards and correlated drill-downs.
- Grafana Loki (like Grafana and Tempo, licensed under AGPLv3 since 2021) aggregates logs by indexing only labels, not the full text, which makes storage much cheaper than full-text indexing at the cost of slower ad-hoc searches.
- Jaeger (created at Uber, CNCF graduated, and rebuilt on the OpenTelemetry Collector framework with version 2 in November 2024) and Grafana Tempo store and query distributed traces. Tempo stores traces in object storage with minimal indexing, relying on trace IDs from logs and exemplars for lookup.
- OpenSearch and Elasticsearch remain common for logs where full-text search is needed.
Commercial platforms (Datadog, Dynatrace, Splunk Observability, New Relic, Elastic Observability, Grafana Cloud, and the cloud providers’ native services) offer integration, automatic discovery, AI-assisted analysis and no operational burden. Most now ingest OpenTelemetry natively. Their weakness for OSS/BSS is the pricing model: billing by host, by ingested gigabyte, by custom metric or by indexed span can scale steeply with the high cardinality that makes observability useful. TelcoCrux view: instrument with OpenTelemetry and route through the Collector regardless of backend; this keeps the commercial negotiation open and allows splitting signals across backends by cost.
Observability needs its own engineering discipline. The common failures are not tool choices but practices: metric names that differ by team, label cardinality explosions (putting order IDs in metric labels can generate millions of time series), logs with personal data that violate privacy rules, and dashboards nobody looks at. Naming conventions, cardinality budgets and data protection rules belong in the platform standards, enforced in the pipeline like any other policy.
6.6 Observability of the OSS software versus observability of the network
Two different things are called observability in a telecom operator, and confusing them leads to wrong tool choices.
- Software observability (the subject of this section) tells the engineering team how the OSS/BSS applications themselves behave: is the order API slow, is the activation service failing, is the inventory database saturated, which deployment introduced the regression.
- Network and service observability tells operations how the network and the services delivered to customers behave: is a cell congested, is a fibre degraded, is a VPN breaching its SLA, which customers are affected. It is built from network telemetry (SNMP, streaming telemetry via gNMI, flow records, probes, alarms) correlated with inventory and topology.
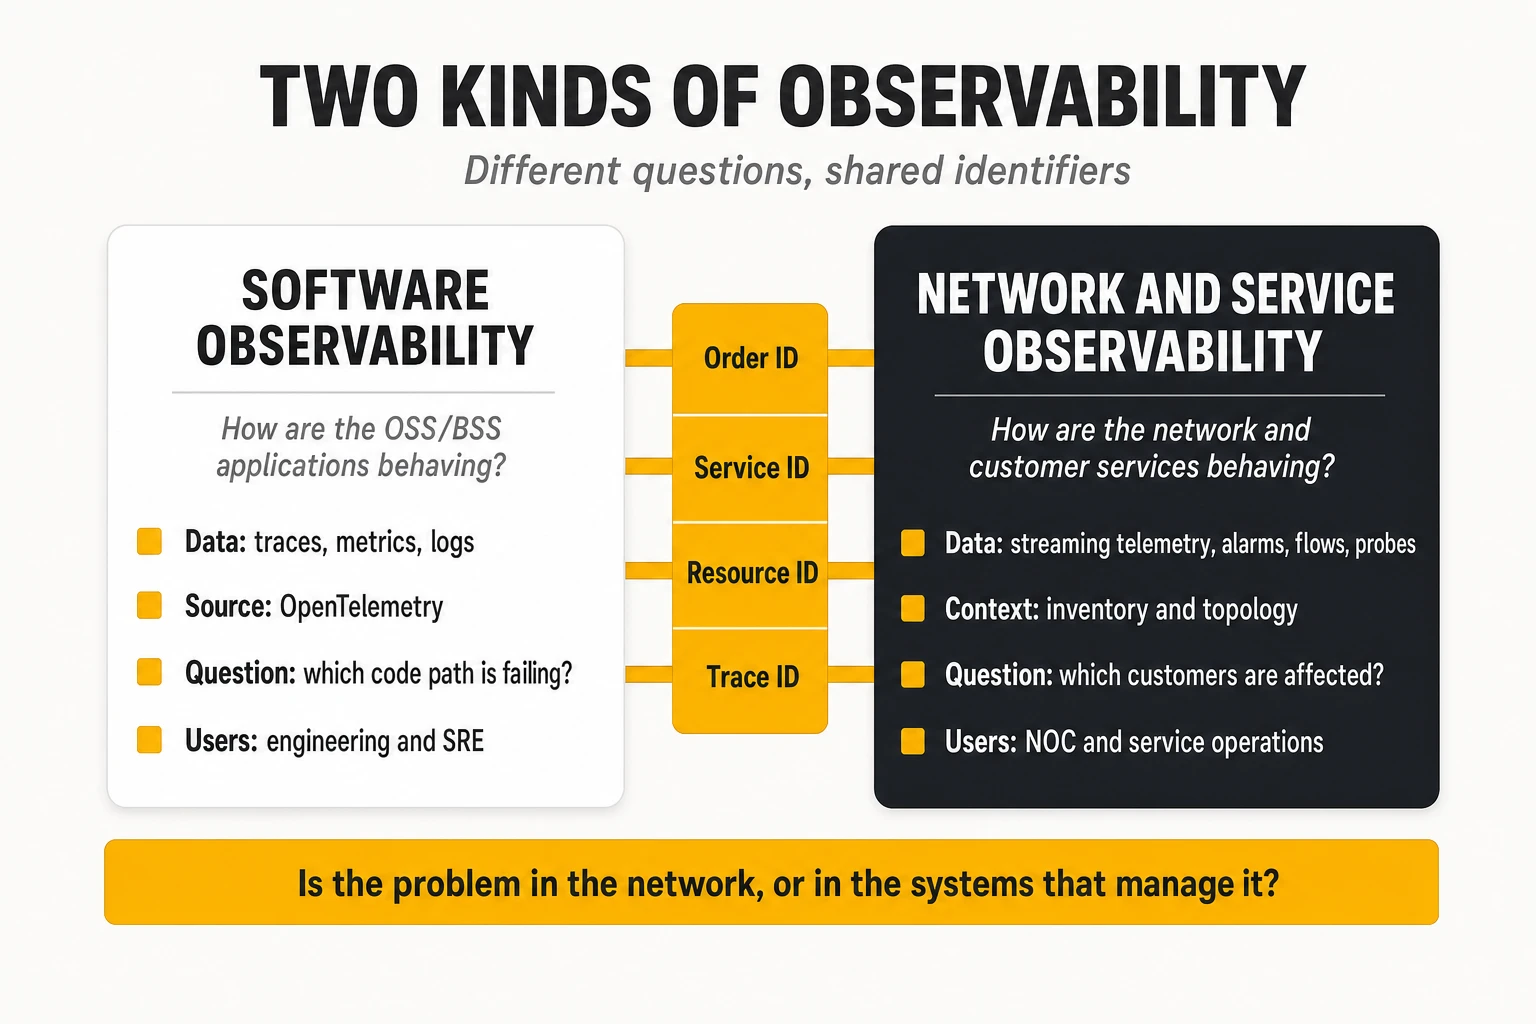
They use partly the same technologies but serve different users and questions. Both may use Kafka, time-series databases and Grafana. But network observability deals with millions of network elements and counters, topology and service models, and the question “which customers are affected”; software observability deals with requests, spans and deployments, and the question “which code path is failing”. The functional platforms for the network side, from discovery to inventory to assurance, are compared in our network discovery, inventory and observability analysis, and the topology models behind them in our network digital twin article.
They complement each other at the boundary, and that boundary is where many real incidents sit. A customer reports that a new service was never activated: was the network element unreachable (network domain) or did the activation service drop the request after a retry storm (software domain)? A burst of network alarms is not being correlated: is the network failing, or is the assurance pipeline’s Kafka consumer lagging? Answering requires shared identifiers (product order, service order, service instance, resource IDs, trace IDs carried into southbound calls) and dashboards that show both views together. TelcoCrux view: operators should treat the OSS/BSS platform as a monitored part of the service chain, with its own SLOs, and propagate trace context from the order API down to the activation adapter, so that the last span of every activation trace is the network call itself.
7. Continuous integration, continuous delivery and GitOps
7.1 The software delivery lifecycle, end to end
Continuous integration and continuous delivery (CI/CD) turn a code change into running software through an automated, repeatable sequence. In the traditional OSS/BSS model, a vendor shipped a release package, the operator’s integration team installed it in test environments, ran weeks of manual tests and installed it in production during a maintenance window. In the CI/CD model, every change flows through the same automated path within minutes or hours.
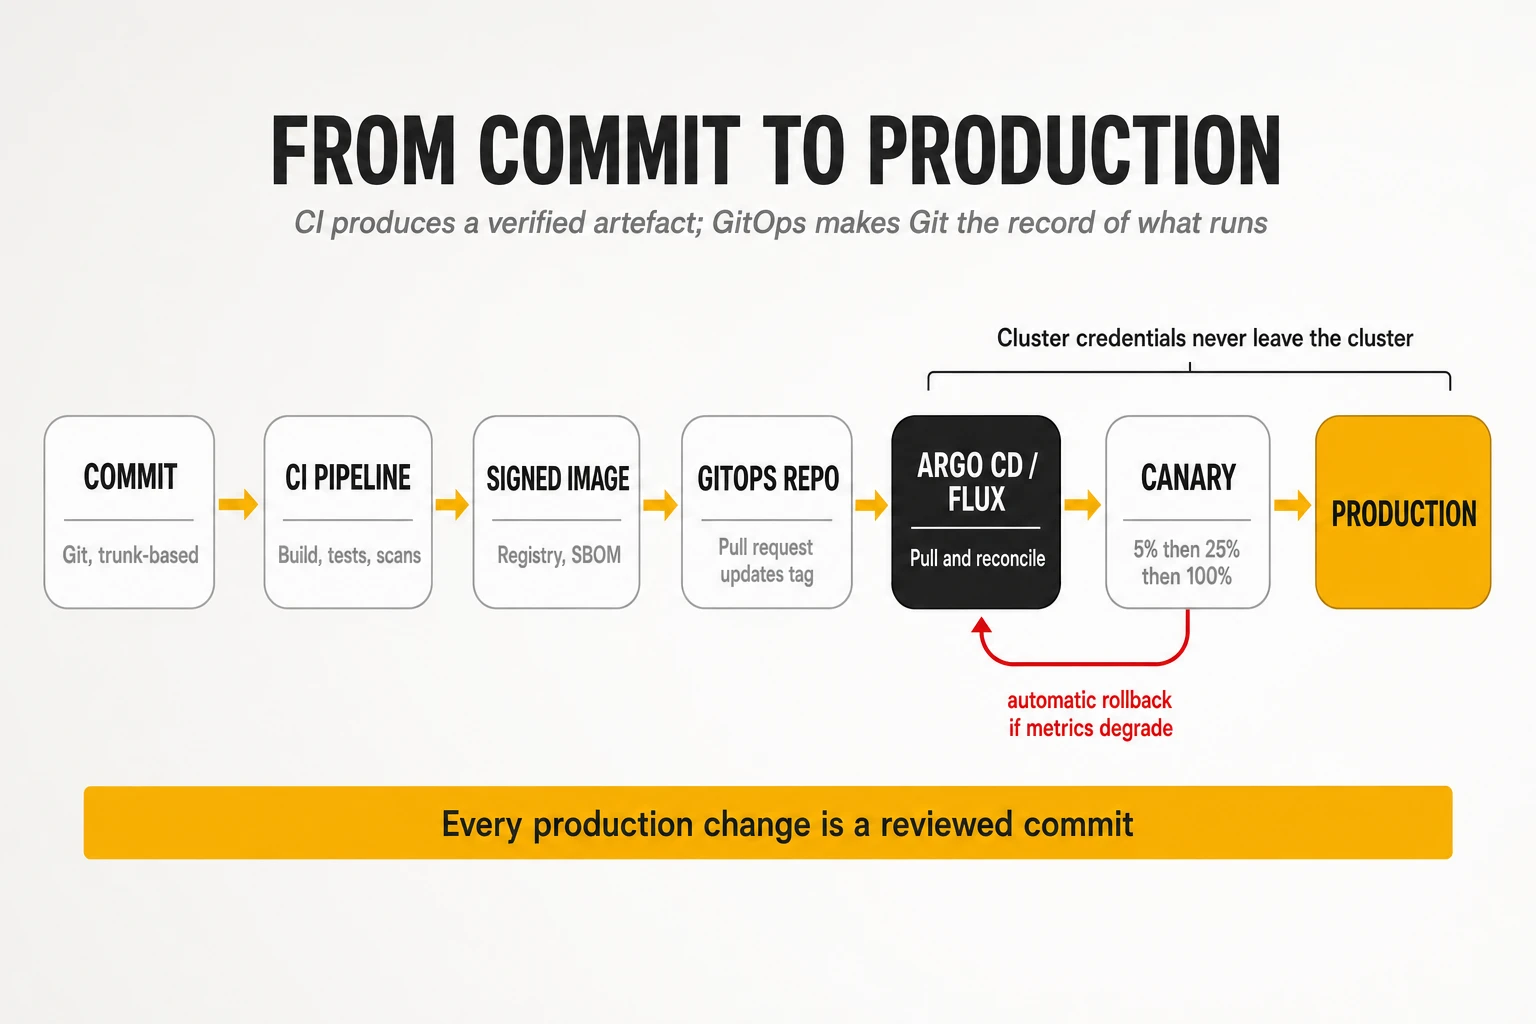
The stages, and what each contributes:
- Version control (Git). All source code, configuration, infrastructure definitions, policies and deployment manifests live in Git repositories. Every change is a commit with an author, a description and a review trail.
- Branching and review. Trunk-based development, in which developers merge small changes into the main branch at least daily, keeps integration continuous. Short-lived branches go through pull requests with automated checks and peer review. Long-lived feature branches, common in older Gitflow setups, delay integration and concentrate merge risk.
- Build. The pipeline compiles code and resolves dependencies in a clean, reproducible environment.
- Automated tests, organised as a pyramid: many fast unit tests, fewer component and contract tests, and a small number of end-to-end tests. Contract tests (section 4.6) replace most of the slow, fragile integration testing that used to dominate OSS/BSS release cycles.
- Artefact creation. The output is a versioned, immutable artefact, normally a container image, plus its Helm chart or manifests, its SBOM and its signature (section 8).
- Registry. Images are pushed to a container registry (Harbor, JFrog Artifactory, Sonatype Nexus, GitLab, GitHub or cloud registries) that scans them, stores signatures and controls who may pull them.
- Deployment to successive environments (development, staging, production) using the same artefact, changing only configuration.
- Verification: automated smoke tests, synthetic transactions and analysis of live metrics decide whether the release proceeds or rolls back.
Continuous delivery and continuous deployment are different. Continuous delivery means every change that passes the pipeline is ready to release, but a human or a business decision triggers production. Continuous deployment means every passing change goes to production automatically. Most operators adopt continuous delivery for OSS/BSS, with automated deployment to production for internal services and approval gates for customer-facing or network-impacting changes.
Feature flags decouple deployment from release. New code is deployed switched off and activated for specific users, regions or partners through a flag service (LaunchDarkly, Unleash, Flagsmith, or the OpenFeature standard). This allows trunk-based development with unfinished features, commercial launches timed independently of deployments, and instant deactivation if a feature misbehaves.
7.2 CI/CD tools
Four platforms dominate CI/CD in operators, and the choice is usually driven by where the code is hosted.
| Tool | Model | Strengths | Weaknesses | Typical fit |
|---|---|---|---|---|
| Jenkins | Self-hosted automation server with a large plug-in ecosystem; pipelines as Groovy Jenkinsfiles | Extremely flexible; runs anywhere; huge plug-in library; no licence cost | Plug-in sprawl and upgrade fragility; controller is a single point of failure; operational burden | Existing estates with many custom pipelines; air-gapped environments |
| GitHub Actions | Workflows in YAML triggered by repository events; hosted or self-hosted runners; marketplace of reusable actions | Tight integration with GitHub; vast action marketplace; simple to start | Supply-chain risk from third-party actions; cost of hosted minutes at scale | Teams on GitHub (cloud or Enterprise Server) |
| GitLab CI/CD | Pipelines in YAML integrated with GitLab’s repository, registry, security scanning and environments | Single platform from code to deployment; built-in security scanners in higher tiers; strong self-hosting | Advanced security features tied to premium tiers | Operators wanting one self-hosted DevSecOps platform |
| Azure DevOps | Azure Pipelines plus boards, repos, artefacts and test plans | Strong integration with Microsoft estates and Azure; mature enterprise governance | Less momentum than GitHub within Microsoft’s own portfolio | Enterprises standardised on Microsoft tooling |
Caption: The main CI/CD platforms compared. Tekton (Kubernetes-native pipelines, used in OpenShift Pipelines) and CircleCI are further options.
TelcoCrux view: the tool matters less than standardisation. Operators that let each vendor and project bring its own pipeline tool end up with dozens of incompatible pipelines and no common security controls. The effective model is a small number of reusable, centrally maintained pipeline templates (“golden paths”) that every team inherits, with security and quality gates built in.
7.3 Infrastructure as Code
Infrastructure as Code (IaC) describes infrastructure and its configuration in versioned files that tools apply automatically. It extends to infrastructure the same benefits that version control gives to code: review, history, reproducibility and automated testing.
- Terraform and OpenTofu provision infrastructure declaratively through providers for clouds, virtualisation platforms, Kubernetes, DNS and many SaaS services. A state file records which real resources correspond to which definitions, and each run computes a plan of changes. HashiCorp changed Terraform’s licence from MPL to the Business Source License in August 2023; the community fork OpenTofu, launched under the Linux Foundation in September 2023, continues with an open-source licence and joined the CNCF as a sandbox project in 2025. IBM completed its acquisition of HashiCorp in February 2025.
- Ansible is an agentless automation tool that connects over SSH or APIs and runs YAML playbooks. It is widely used for operating system configuration, application installation and, notably, network device configuration, which makes it familiar to network engineering teams.
- Helm is the package manager for Kubernetes: a chart is a templated set of Kubernetes manifests with configurable values, versioned and stored in registries. Most OSS/BSS vendors ship their products as Helm charts.
- Kustomize customises plain Kubernetes manifests through overlays (base plus per-environment patches) without templating; it is built into kubectl.
- Crossplane extends Kubernetes so that cloud and infrastructure resources (databases, buckets, clusters) are declared as Kubernetes objects and reconciled by controllers, bringing infrastructure under the same GitOps model as applications.
Declarative and imperative tools are complementary. Declarative tools (Terraform, Helm, Kubernetes manifests) describe the desired end state and let the tool compute the steps. Imperative tools (Ansible playbooks, scripts) describe the steps. Declarative definitions are easier to diff, review and reconcile; imperative automation remains necessary for procedural tasks such as ordered migrations.
7.4 GitOps: Argo CD and Flux
GitOps is an operating model in which the desired state of every environment is stored in Git and continuously reconciled into the running system by an agent. The OpenGitOps principles, maintained by a CNCF working group, define it in four properties: the system is described declaratively; the desired state is versioned and immutable; agents pull the desired state automatically; and agents continuously reconcile actual state towards it.
The difference from traditional CI/CD is the direction of deployment. In a push model, the CI pipeline holds credentials to the cluster and runs kubectl apply or helm upgrade. In the GitOps pull model, the CI pipeline only updates a Git repository (for example, changing an image tag in a manifest); an agent running inside the cluster detects the change and applies it. Cluster credentials never leave the cluster, every change to production is a Git commit with review and history, and drift (someone changing the cluster by hand) is detected and reverted automatically.
Two CNCF-graduated projects implement GitOps on Kubernetes.
- Argo CD models deployments as Applications that map a Git path to a cluster and namespace, shows their sync and health status in a rich web interface, and manages many clusters from one control plane. ApplicationSets generate applications for fleets of clusters or environments from templates. Its companion Argo Rollouts adds progressive delivery. Argo CD 3.0 was released in May 2025.
- Flux is a set of composable controllers (source, kustomize, helm, notification, image automation) with no central user interface, closer to a toolkit embedded in the platform. It continued with new corporate backing after Weaveworks, its original sponsor, ceased operations in early 2024, and has kept a regular release cadence since.
GitOps fits OSS/BSS particularly well because it produces an audit trail by construction. Every change to what runs in production is a reviewed commit, which satisfies change management and regulatory audit requirements with far less paperwork than ticket-based processes. How these automated change flows fit with operator change management, risk classification and network change windows is analysed in our article on change management in telecom networks.
7.5 Deployment strategies: rolling, blue-green, canary and rollback
A deployment strategy decides how a new version replaces the old one, and therefore how many users a bad release can hurt before it is caught.
| Strategy | How it works | Advantages | Requirements and risks | OSS/BSS fit |
|---|---|---|---|---|
| Rolling update | Replaces instances gradually, a few at a time; Kubernetes default | No extra capacity; simple | Old and new versions run together; database and API changes must be compatible; rollback is another rolling update | Default for stateless internal services |
| Blue-green | Deploys the full new version (green) alongside the old (blue), then switches all traffic | Instant switch and instant rollback; full testing before switch | Double capacity during deployment; data migrations must work for both | Customer-facing APIs; releases with risky changes |
| Canary | Sends a small share of real traffic (1%, 5%, 25%…) to the new version and compares metrics before increasing | Limits the blast radius; verified with real traffic | Needs traffic splitting (mesh or gateway) and good metrics; statistically meaningful traffic | High-volume APIs such as ordering, catalogue, eligibility |
| Shadow (mirroring) | Copies real traffic to the new version without returning its responses | Tests with real load at zero user risk | Not usable for operations with side effects (activation, charging) unless stubbed | Read-only services, new inventory or catalogue engines |
| Feature-flag release | Deploys code inactive; enables features gradually by flag | Decouples deployment from release; instant kill switch | Flag debt if flags are not removed; testing combinations | Commercial launches; partner-specific features |
Caption: Deployment strategies compared.
Progressive delivery automates the canary decision. Tools such as Argo Rollouts and Flagger shift traffic in steps and, at each step, query Prometheus or another metrics source for error rate and latency; if the new version is worse than the old beyond a threshold, they roll back automatically without human involvement. This turns “deploy and watch the dashboards” into a controlled experiment, and it is the mechanism behind the low change failure rates of high-performing teams.
Rollback is easy for code and hard for data. Reverting a container image takes seconds. Reverting a database schema change that has already transformed millions of rows does not. The standard technique is the expand and contract pattern: first add the new structure while keeping the old (expand), deploy code that writes both and reads the new, migrate data, and only in a later release remove the old structure (contract). Each step is backward compatible, so any single release can be rolled back. In OSS/BSS, where inventory and order databases are large and long-lived, schema migration discipline is a prerequisite for frequent releases.
Network-facing changes need an extra layer of caution. Rolling back an activation adapter does not undo the configuration it pushed to the network. Releases of software that changes the network should be canaried by scope (one region, one technology, one customer segment) and combined with pre- and post-checks on the network itself, the same discipline applied to network changes.
8. DevSecOps
8.1 Fundamentals: what changes compared with DevOps
DevOps removed the wall between development and operations; DevSecOps removes the one between both and security. In the DevOps model, the team that builds a service also deploys and runs it, supported by automation. Security, however, often remained a separate gate at the end: a penetration test before go-live, a vulnerability scan run by another department, a manual review of firewall rules. When releases happen daily, a security gate that takes two weeks is either bypassed or becomes the bottleneck that cancels the benefits of CI/CD.
DevSecOps integrates security controls into every stage of the lifecycle, automates them and makes the delivery team responsible for acting on their results. Three principles define it:
- Shift left: find problems as early as possible, when they are cheapest to fix. A vulnerable dependency flagged in the developer’s editor costs minutes; the same vulnerability found in production after an incident costs days and possibly a breach notification.
- Automate the controls: every check that can be expressed as a rule (no critical vulnerabilities, no secrets in code, images signed, containers not running as root) runs automatically in the pipeline or at admission into the cluster, with clear pass/fail criteria.
- Shield right: security does not end at deployment. Runtime protection, continuous scanning of running images against newly published vulnerabilities, and anomaly detection cover what static checks miss.
The software supply chain became the focus of DevSecOps after a series of high-profile attacks. The SolarWinds compromise (disclosed in December 2020) inserted malicious code into a build system, so that signed, legitimate updates distributed a backdoor to thousands of customers, including telecom operators. The Log4Shell vulnerability (December 2021) showed that a single ubiquitous open-source library could expose a large part of the world’s Java software overnight, and that most organisations could not quickly answer “where do we use it?”. The xz Utils backdoor (2024) showed a patient attacker becoming a trusted maintainer of a compression library. Each event drove a specific control: build integrity and provenance, software bills of materials, and dependency vetting.
8.2 Testing techniques: SAST, DAST, SCA and more
Several families of automated security testing complement each other; none is sufficient alone.
| Technique | What it analyses | How | Finds | Typical tools | Pipeline stage |
|---|---|---|---|---|---|
| SAST (static application security testing) | Source code at rest | Parses code into syntax trees and data flows; matches insecure patterns | Injection flaws, insecure crypto, unsafe deserialisation, hard-coded credentials | SonarQube, Semgrep, CodeQL, Checkmarx, Fortify | Commit and pull request |
| Secret scanning | Code, configuration and Git history | Pattern and entropy detection of keys, tokens, passwords | Leaked credentials | Gitleaks, TruffleHog, GitHub secret scanning | Pre-commit hook and pull request |
| SCA (software composition analysis) | Third-party dependencies and their versions | Matches dependency manifests against vulnerability databases (CVE, OSV, GitHub advisories) and licence data | Known vulnerable libraries, licence violations | Trivy, Grype, Snyk, OWASP Dependency-Check, Dependabot, Renovate | Build |
| Container image scanning | OS packages and libraries inside the image | Inventories image layers and matches against vulnerability feeds | Vulnerable base images and packages; misconfigurations | Trivy, Grype, Clair, registry-integrated scanners | Build and registry (continuously) |
| IaC and configuration scanning | Terraform, Helm, Kubernetes manifests, Dockerfiles | Policy checks on declared configuration | Public buckets, privileged containers, missing limits, open security groups | Checkov, KICS, Trivy config, kube-linter | Pull request and build |
| DAST (dynamic application security testing) | The running application, from outside | Sends crafted requests to endpoints and APIs | Injection, authentication and session flaws, misconfigured headers, exposed endpoints | OWASP ZAP, Burp Suite, API-specific fuzzers | Staging |
| IAST and RASP | The running application, from inside | Instrumentation agents observe data flows during tests (IAST) or block attacks in production (RASP) | Exploitable paths with fewer false positives | Contrast Security, Datadog and other APM-integrated agents | Test and runtime |
Caption: Automated security testing techniques and where they run in the pipeline.
The operational problem is not finding vulnerabilities but triaging them. A typical container image scan returns dozens or hundreds of findings, most in packages the application never calls. Teams that treat every finding as blocking stop shipping; teams that ignore findings accumulate risk. Triage needs context: is the vulnerable function reachable, is it exploitable in this configuration, is it being exploited in the wild? Section 8.7 describes how.
8.3 SBOM: the software bill of materials
A software bill of materials (SBOM) is a machine-readable inventory of every component in a piece of software: libraries, versions, suppliers, licences and their relationships. It is to software what a parts list is to hardware. When the next Log4Shell is announced, an operator with SBOMs for all deployed images can answer “which of our systems contain the vulnerable version?” with a query instead of a multi-week investigation.
Two formats dominate. SPDX, a Linux Foundation project originally focused on licence compliance, is an international standard (ISO/IEC 5962:2021). CycloneDX, from the OWASP Foundation and standardised as ECMA-424 (second edition December 2025), was designed for security use cases and also covers services, hardware, and vulnerability exploitability information. Tools such as Syft, Trivy and the CycloneDX plug-ins generate SBOMs automatically during the build; platforms such as Dependency-Track store them and continuously match them against new vulnerabilities.
SBOMs are becoming a regulatory and procurement requirement. The US CISA SBOM programme, following Executive Order 14028 of May 2021, made SBOMs an expectation for software sold to the federal government. In the European Union, the Cyber Resilience Act (Regulation (EU) 2024/2847) entered into force in December 2024; its obligation to report actively exploited vulnerabilities and severe incidents has applied since 11 September 2026, and the remaining requirements apply from 11 December 2027. It requires manufacturers of products with digital elements to identify and document components, including through an SBOM, and to handle vulnerabilities throughout the support period. Telecom operators are also subject to NIS2 supply-chain security obligations. For OSS/BSS procurement, requiring vendors to deliver an SBOM with every release, in SPDX or CycloneDX, is now a reasonable and enforceable contract term.
VEX complements the SBOM. A Vulnerability Exploitability eXchange (VEX) document states whether a known vulnerability in a listed component actually affects the product (“not affected: vulnerable code not present / not reachable”). Without VEX, SBOM-based scanning floods customers with false positives; with it, vendors can communicate which findings require action.
8.4 SLSA and artefact signing
SLSA (Supply-chain Levels for Software Artifacts, pronounced “salsa”) is a framework of incremental requirements that protect the integrity of the build process. Originating at Google and now maintained under the OpenSSF, it reached version 1.2, which adds a source track to the original build track. The build track defines levels:
- Build L1: the build produces provenance, a signed statement describing how the artefact was built (source repository and commit, build platform, parameters).
- Build L2: the build runs on a hosted build platform that generates and signs the provenance itself, so it cannot be forged by the developer.
- Build L3: the build platform is hardened so that builds are isolated from each other and signing keys cannot be accessed by user-defined build steps.
Signing proves that an image came from the expected pipeline and was not modified afterwards. The Sigstore project, and its Cosign tool, made signing practical: in “keyless” mode, the pipeline authenticates with its workload identity (for example a GitHub Actions or GitLab OIDC token), obtains a short-lived certificate from the Fulcio certificate authority, signs the image, and records the signature in the Rekor public transparency log. There is no long-lived private key to protect or leak. Signatures, SBOMs and provenance attestations are stored alongside the image in the registry.
Verification at admission closes the loop. A signature is useless unless something checks it. Policy engines in the cluster (section 8.6) can require that every image is signed by the operator’s pipeline identity and carries an SBOM and SLSA provenance, and reject any image that does not. This is what prevents a compromised developer laptop or a typo-squatted public image from reaching production.
8.5 Secrets management
A secret is any credential that grants access: database passwords, API keys, OAuth client secrets, private keys, certificates. The first rule is absolute: secrets never go into source code, container images or Git repositories, including private ones. Leaked credentials found in repositories remain one of the most common initial access vectors.
Mature secrets management has four elements:
- A central secrets store such as HashiCorp Vault (or its open-source fork OpenBao), AWS Secrets Manager, Azure Key Vault or Google Secret Manager, with encryption, access policies and audit logs.
- Dynamic, short-lived credentials: instead of a static database password shared for years, the store generates a credential for each workload that expires after hours, so that a leaked credential quickly becomes useless.
- Workload identity instead of bootstrap secrets: pods authenticate to the secrets store with their Kubernetes service account token or a cloud workload identity, so that no initial secret needs to be distributed.
- Delivery into the workload through the External Secrets Operator, the Secrets Store CSI driver or Vault agent injection, which make secrets available as files or environment variables without storing them in Git. Where secrets must live in Git for GitOps, they are encrypted (Sealed Secrets, SOPS) so that only the cluster can decrypt them.
Kubernetes Secrets alone are not secret enough. By default they are base64-encoded, not encrypted, in etcd, and readable by anyone with broad namespace access. Encryption at rest, tight RBAC and an external store are required for production OSS/BSS.
8.6 Policy as Code
Policy as Code expresses security and compliance rules as versioned, testable code that is evaluated automatically. Instead of a PDF security standard that auditors check once a year, the rule “containers must not run as root” is a policy that blocks every non-compliant deployment, at every moment, with a clear error message.
In Kubernetes, policies are enforced by admission controllers that intercept every request to the API server.
- Open Policy Agent (OPA) is a general-purpose policy engine (CNCF graduated) with its own language, Rego. Gatekeeper integrates it with Kubernetes admission. OPA is also used outside Kubernetes: API authorisation, Terraform plan checks, CI pipeline rules.
- Kyverno is a Kubernetes-native policy engine, CNCF graduated in March 2026, whose policies are Kubernetes resources. Its original pattern-based
ClusterPolicytype is being deprecated in favour of CEL-based policy types such asValidatingPolicy, aligned with Kubernetes’ own admission policies. It can validate, mutate (add defaults), generate resources and verify image signatures, which makes it popular with platform teams who do not want to learn Rego. - ValidatingAdmissionPolicy, built into Kubernetes and generally available since version 1.30, lets simple validation rules be written in CEL without any external engine.
The policies that matter most for OSS/BSS platforms are well known: no privileged or root containers; mandatory CPU and memory requests and limits; images only from approved registries and only when signed; no :latest tags; mandatory labels for ownership and cost allocation; network policies present in every namespace; no host path mounts. Policies run first in audit mode, reporting violations without blocking, and are switched to enforcement once existing workloads are compliant (in Kyverno, by changing validationActions from Audit to Deny).
A reference Kyverno policy illustrates the approach. The policy below uses the CEL-based ValidatingPolicy type. It requires every container to declare CPU and memory limits and to run as non-root, and rejects non-compliant pods with an explicit message. It checks the container level as well as the pod level, because a container-level setting overrides the pod default. Policy examples that still use ClusterPolicy with validationFailureAction, common in older guides, rely on deprecated fields.
apiVersion: policies.kyverno.io/v1
kind: ValidatingPolicy
metadata:
  name: oss-bss-baseline
spec:
  validationActions: [Deny]
  matchConstraints:
    resourceRules:
      - apiGroups: [""]
        apiVersions: ["v1"]
        operations: ["CREATE", "UPDATE"]
        resources: ["pods"]
  validations:
    - message: "Every container must declare CPU and memory limits."
      expression: >-
        object.spec.containers.all(c,
          has(c.resources) && has(c.resources.limits) &&
          'cpu' in c.resources.limits && 'memory' in c.resources.limits)
    - message: "Containers must run as non-root (runAsNonRoot: true)."
      expression: >-
        object.spec.containers.all(c,
          has(c.securityContext) && has(c.securityContext.runAsNonRoot)
            ? c.securityContext.runAsNonRoot
            : has(object.spec.securityContext) &&
              has(object.spec.securityContext.runAsNonRoot) &&
              object.spec.securityContext.runAsNonRoot)
8.7 Vulnerability management
Vulnerability management is the continuous process of identifying, prioritising, fixing and verifying vulnerabilities across everything deployed. Scanning is the easy part. Prioritisation is where programmes succeed or drown.
Three public signals make prioritisation evidence-based:
- CVSS (Common Vulnerability Scoring System) rates the theoretical severity of a vulnerability from 0 to 10. It says how bad a vulnerability could be, not how likely it is to be exploited.
- EPSS (Exploit Prediction Scoring System), published by FIRST, estimates the probability that a vulnerability will be exploited in the next 30 days, based on observed activity.
- The CISA Known Exploited Vulnerabilities (KEV) catalogue lists vulnerabilities confirmed as exploited in the wild.
A practical policy combines them with context. Vulnerabilities in the KEV catalogue, or with high EPSS scores, in internet-facing components are fixed within days; critical CVSS findings in internal, unreachable code are scheduled with normal releases; findings marked “not affected” in vendor VEX statements are suppressed with a recorded justification. Fixes are applied by rebuilding images on patched base images, not by patching running containers, and automated dependency update tools (Renovate, Dependabot) open pull requests so that keeping current becomes routine rather than a project.
For OSS/BSS bought from vendors, vulnerability management is a contractual matter. The operator cannot rebuild a vendor’s image. Contracts should specify SBOM and VEX delivery, maximum times to deliver fixes by severity, support for current base images and Kubernetes versions, and the right to scan delivered artefacts.
8.8 A complete DevSecOps pipeline for an OSS/BSS component
The pipeline below shows how the controls combine for a single ODA component, for example a TMF638 service inventory service, from commit to production. Tools are examples; each stage can be implemented with equivalent products.
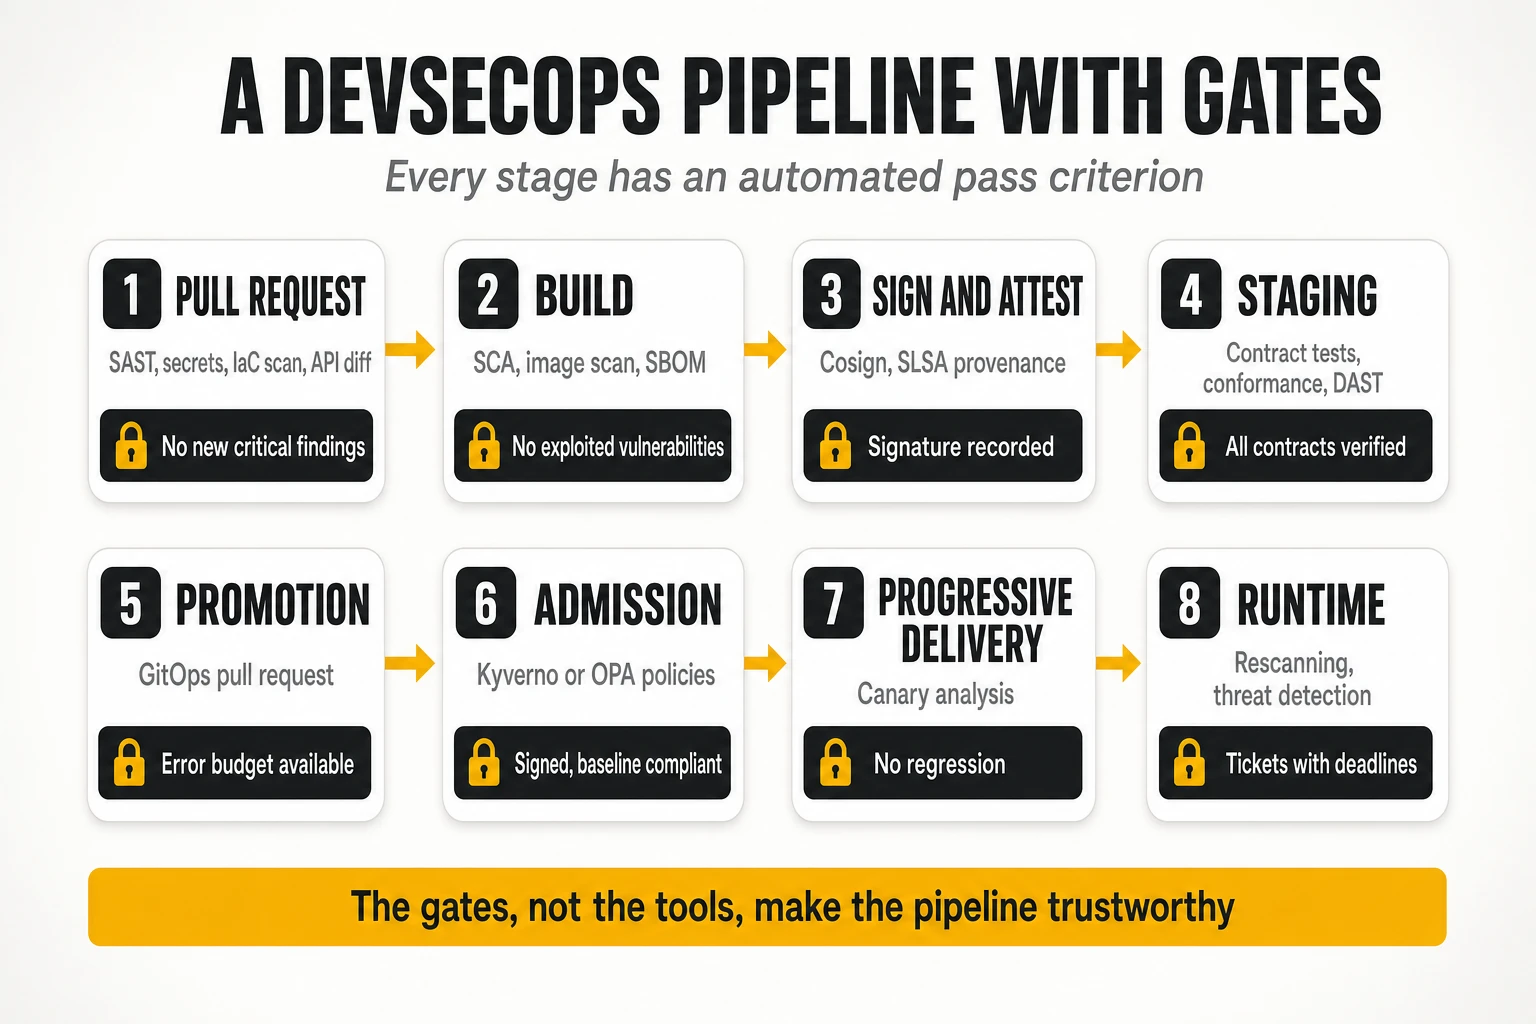
| Stage | Automated actions | Example tools | Gate (pass criterion) |
|---|---|---|---|
| 0. Developer workstation | Pre-commit hooks for secrets and formatting; IDE linting of code and OpenAPI | Gitleaks, Spectral, IDE plug-ins | No secrets committed; contract lint clean |
| 1. Pull request | Unit tests with coverage; SAST; secret scan; IaC and manifest scan; OpenAPI breaking-change diff; peer review | SonarQube or Semgrep, Checkov, oasdiff, Git platform reviews | Tests pass; coverage threshold met; no new critical or high SAST findings; no breaking API change without a major version; at least one approval |
| 2. Build | Reproducible container build on a minimal base image; SCA on dependencies; image scan; SBOM generation | BuildKit or Buildah, Trivy or Grype, Syft (CycloneDX) | No known-exploited (KEV) or critical fixable vulnerabilities; SBOM produced |
| 3. Sign and attest | Keyless signature of image; SLSA provenance and SBOM attached as attestations; push to registry | Cosign, SLSA generators, Harbor or Artifactory | Signature and attestations recorded in the registry and transparency log |
| 4. Staging | Deploy via GitOps to staging; consumer-driven contract tests; TM Forum API conformance tests for exposed APIs; DAST; performance smoke tests | Argo CD, Pact, TM Forum conformance kit, OWASP ZAP, k6 | All consumer contracts verified; conformance to the operator’s API profile; no high DAST findings; latency within the SLO |
| 5. Promotion | Pipeline updates the production GitOps repository through a pull request; error budget check | Git platform, Prometheus API query | Error budget of the service not exhausted (section 9); change approved per risk class |
| 6. Admission | Cluster admission policies verify signature, provenance, registry and workload baseline | Kyverno or OPA Gatekeeper, Sigstore policy controller | Image signed by the pipeline identity; baseline policies pass |
| 7. Progressive delivery | Canary 5% → 25% → 100% with automated analysis of error rate and latency against the stable version | Argo Rollouts or Flagger, Istio, Prometheus | No statistically significant regression; otherwise automatic rollback |
| 8. Runtime | Continuous rescanning of running images against new CVEs; runtime threat detection; audit logging | Registry scanners, Falco or commercial runtime security, SIEM | New critical exposures raise tickets with severity-based deadlines |
Caption: Reference DevSecOps pipeline for an OSS/BSS component. TelcoCrux reference design.
A skeleton of the CI part, in GitHub Actions syntax, shows how compact the automation becomes once templates exist. In practice, each step calls a centrally maintained reusable workflow rather than being written per project.
name: tmf638-service-inventory
on:
  pull_request:
  push:
    branches: [main]
permissions:
  contents: read
  id-token: write # OIDC identity for keyless signing
  packages: write
jobs:
  verify:
    runs-on: ubuntu-latest
    steps:
      - uses: actions/checkout@v4
      - run: make test # unit tests and coverage gate
      - run: spectral lint api/openapi.yaml # contract style rules
      - run: oasdiff breaking api/base.yaml api/openapi.yaml --fail-on ERR
      - run: semgrep scan --config auto --error
      - run: gitleaks detect --no-banner
  build-sign:
    needs: verify
    if: github.ref == 'refs/heads/main'
    runs-on: ubuntu-latest
    steps:
      - uses: actions/checkout@v4
      - run: docker build -t $IMAGE .
      - run: trivy image --severity CRITICAL --ignore-unfixed --exit-code 1 $IMAGE
      - run: syft $IMAGE -o cyclonedx-json > sbom.json
      - run: docker push $IMAGE
      - run: cosign sign --yes $IMAGE@$DIGEST
      - run: cosign attest --yes --type cyclonedx --predicate sbom.json $IMAGE@$DIGEST
      - run: ./scripts/bump-gitops-tag.sh $DIGEST # opens PR on the GitOps repo
Two design choices in this example matter more than any tool. First, images are referenced by digest, not tag, from the moment they are signed, so that what was scanned and signed is exactly what is deployed. Second, the pipeline never holds production credentials: it only proposes a change to the GitOps repository, and the cluster pulls and verifies it.
9. Site Reliability Engineering (SRE)
9.1 What SRE is and how it differs from traditional operations
Site Reliability Engineering is what happens when software engineers are asked to design an operations function. The phrase is Ben Treynor Sloss’s, who founded Google’s SRE team in 2003, and the discipline was documented publicly in the Google SRE books from 2016. SRE treats reliability as a feature with a target, measures it with explicit indicators, and manages the tension between change and stability through data rather than negotiation.
Traditional IT operations and SRE start from opposite assumptions. Traditional operations aims for maximum stability, sees change as the main source of risk and protects production through change boards, freezes and manual procedures. SRE accepts that 100% reliability is neither achievable nor desirable (users cannot tell the difference between 99.99% and 100% when their own network is less reliable), defines how much unreliability is acceptable, and spends that margin on change. Operations work is treated as an engineering problem: repetitive work is automated, and systems are redesigned so that they need less operating.
DevOps, DevSecOps and SRE are complementary, not competing. DevOps is a culture and set of practices that unites building and running software. DevSecOps adds security to that loop. SRE is a concrete implementation of DevOps principles focused on reliability, with specific practices (SLOs, error budgets, toil limits, blameless postmortems) and often a specific role. Google’s own formulation is that “class SRE implements interface DevOps”.
9.2 SLI, SLO, SLA and error budgets
Four concepts form the quantitative core of SRE.
- Service Level Indicator (SLI): a carefully chosen measurement of the service as users experience it, usually expressed as the ratio of good events to valid events. For a TMF622 ordering API: the share of order submissions answered with a non-5xx status in under 800 ms. For an activation pipeline: the share of service orders activated within 15 minutes.
- Service Level Objective (SLO): the target for an SLI over a time window, agreed between engineering and the business: 99.9% of order submissions good over a rolling 30 days.
- Service Level Agreement (SLA): a contractual commitment to customers, with financial consequences when breached. SLAs should be looser than internal SLOs, so that the team reacts before the contract is at risk.
- Error budget: the allowed unreliability, 100% minus the SLO. A 99.9% SLO over 30 days allows 0.1% bad events, or about 43 minutes of full unavailability.
| SLO (30-day window) | Error budget | Equivalent full downtime per 30 days |
|---|---|---|
| 99% | 1% | 7 h 12 min |
| 99.5% | 0.5% | 3 h 36 min |
| 99.9% | 0.1% | 43 min 12 s |
| 99.95% | 0.05% | 21 min 36 s |
| 99.99% | 0.01% | 4 min 19 s |
| 99.999% | 0.001% | 26 s |
Caption: Error budgets for common SLOs. Each additional nine costs roughly ten times more engineering effort and redundancy.
The error budget turns a political argument into an arithmetic one. As long as the service has budget left, the team ships features at full speed and accepts the risk that comes with change. When the budget is exhausted, an error budget policy, agreed in advance with product owners, takes effect: feature releases pause (security fixes continue), engineering effort moves to reliability work, and releases resume when the budget recovers. The policy matters more than the number, because it is what makes the SLO change behaviour.
Choosing SLOs is a business decision, and the “five nines” reflex is usually wrong for OSS/BSS. A real-time charging function or a network-facing policy system may justify 99.99%. A product catalogue administration interface used by marketing does not, and engineering it to 99.99% wastes money. Good practice is to set SLOs per user journey, start from the reliability the service actually achieves, and tighten only where users or the business notice the difference.
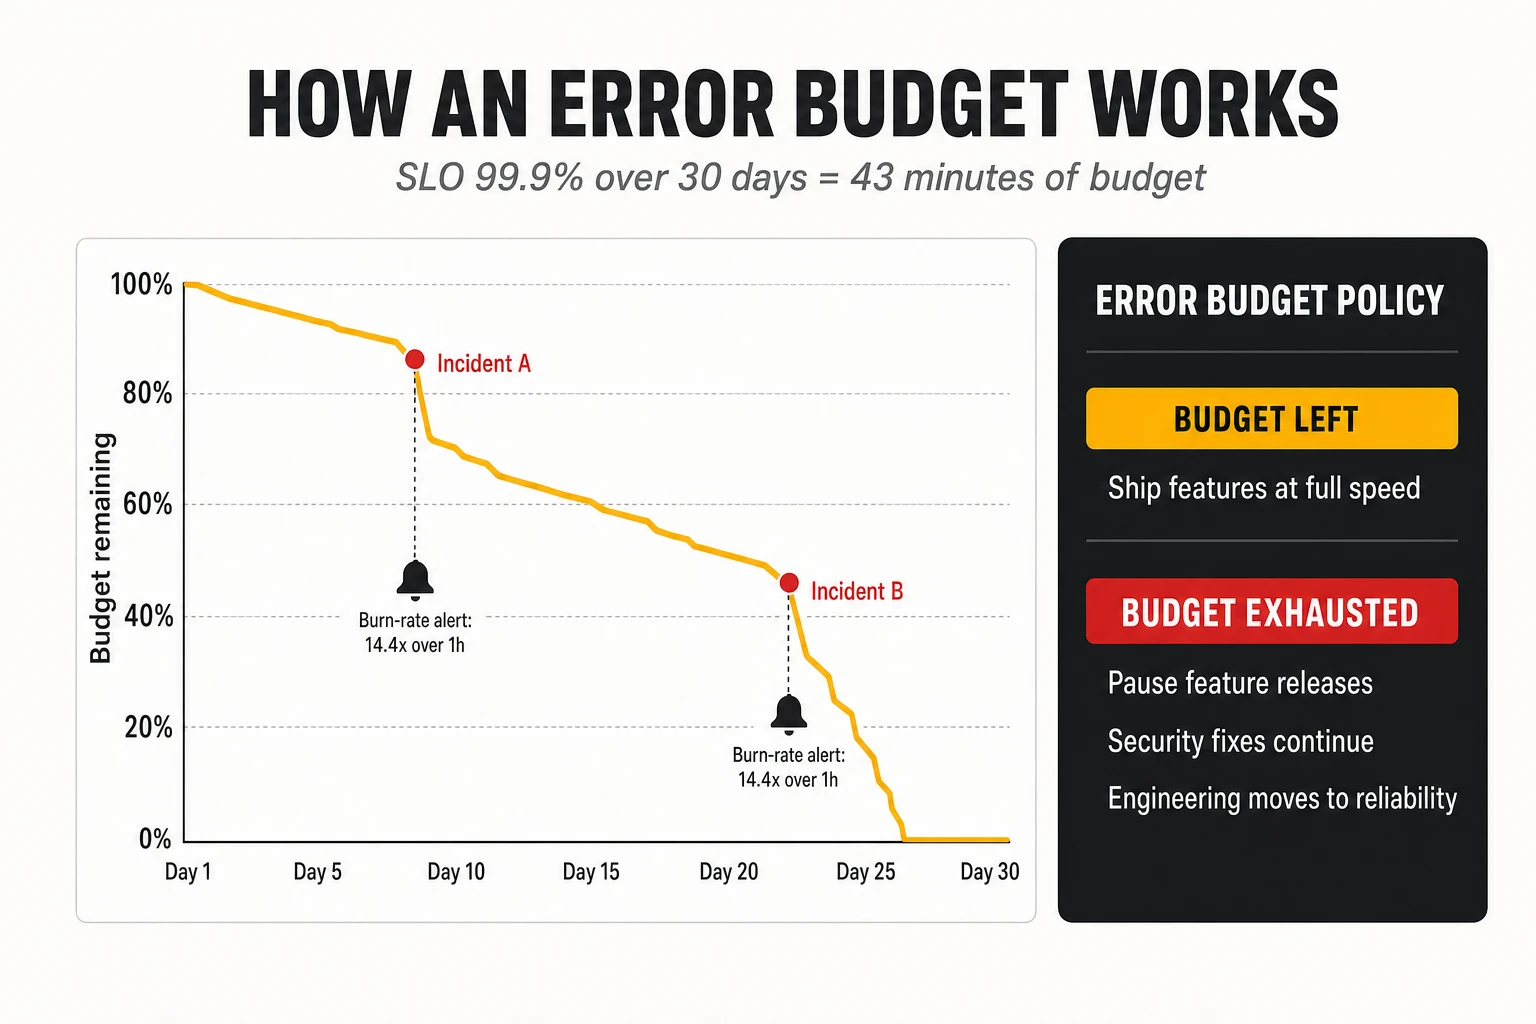
9.3 Alerting on SLOs: burn rates
SLO-based alerting pages a human only when users are being hurt fast enough to threaten the objective. Traditional alerts fire on causes (CPU high, a pod restarted), which generates noise that trains engineers to ignore pages. SLO alerts fire on symptoms measured against the error budget.
The burn rate is the speed at which the budget is being consumed relative to plan. A burn rate of 1 consumes exactly the budget over the window; a burn rate of 14.4 sustained for one hour consumes 2% of a 30-day budget. The SRE Workbook recommends multiwindow, multi-burn-rate alerts: page when the burn rate exceeds 14.4 over the last hour and also over the last five minutes (the short window confirms the problem is still happening), and open a ticket for slower burns, such as a rate of 1 over three days.
The alert rule below implements the fast-burn page for a TMF622 ordering API with a 99.9% availability SLO. It uses recording rules for the error ratio over each window, which is how these rules are normally structured in Prometheus.
groups:
  - name: tmf622-slo
    rules:
      - record: slo:order_api_errors:ratio_rate5m
        expr: |
          sum(rate(http_server_request_duration_seconds_count{service="tmf622-ordering",http_response_status_code=~"5.."}[5m]))
          /
          sum(rate(http_server_request_duration_seconds_count{service="tmf622-ordering"}[5m]))
      - record: slo:order_api_errors:ratio_rate1h
        expr: |
          sum(rate(http_server_request_duration_seconds_count{service="tmf622-ordering",http_response_status_code=~"5.."}[1h]))
          /
          sum(rate(http_server_request_duration_seconds_count{service="tmf622-ordering"}[1h]))
      - alert: TMF622ErrorBudgetFastBurn
        expr: |
          slo:order_api_errors:ratio_rate1h > (14.4 * 0.001)
          and
          slo:order_api_errors:ratio_rate5m > (14.4 * 0.001)
        labels:
          severity: page
        annotations:
          summary: "TMF622 ordering is burning its 30-day error budget 14x too fast"
          description: "At this rate 2% of the monthly budget is consumed every hour."
SLOs should be defined as code, next to the service. Generators such as Sloth and Pyrra take a short SLO declaration (indicator, objective, window) and produce the recording rules, the multi-burn-rate alerts and the dashboards, which removes the error-prone arithmetic. The OpenSLO specification provides a vendor-neutral format. The same SLO definitions feed the error budget gate in the delivery pipeline (section 8.8): before promotion, the pipeline queries the remaining budget and blocks feature releases for a service that has exhausted it.
9.4 Toil
Toil is operational work that is manual, repetitive, automatable, tactical, without enduring value, and that grows linearly with the size of the service. Restarting a stuck job every morning, manually fixing order fallouts, copying data between systems to complete a provisioning step and handling the same alarm by hand every week are all toil. The definition is precise on purpose: an on-call engineer analysing a new failure is not doing toil; one following the same runbook for the hundredth time is.
Google’s SRE teams cap toil at 50% of each engineer’s time, as described in the “Eliminating Toil” chapter; the rest must be engineering work that reduces future toil or improves the service. The cap is a forcing function: if toil exceeds it, work is pushed back to the development team or automation is prioritised.
Order fallout handling is the archetypal OSS/BSS toil. In many operators, teams of people manually resolve orders that fail between systems: a mismatch between catalogue and inventory, a timeout in activation, a missing characteristic. Measuring fallout volume and the time spent on it, classifying root causes and fixing them in the software (idempotent retries, better validation at order capture, automated compensation) is often the highest-return SRE investment in a BSS/OSS stack.
9.5 Resilience, redundancy, failover and recovery
Resilience is the ability of a system to keep serving, perhaps in degraded form, when parts of it fail, and to recover quickly when it cannot. It is designed at several levels:
- Redundancy: no single instance, node, zone or site whose loss stops the service. Redundancy must include dependencies that are easy to forget: DNS, identity providers, certificate authorities, the secrets store, the container registry, the Git server used by GitOps.
- Graceful degradation: when a dependency fails, serve a reduced function rather than nothing. An order capture flow can accept orders and queue them when inventory is unavailable, instead of rejecting customers.
- Failover: automatic switching to standby capacity. Failover that has not been tested recently should be assumed not to work.
- Recovery objectives: the Recovery Time Objective (RTO, how long the service may be down) and the Recovery Point Objective (RPO, how much data may be lost) are set per service and drive architecture. An RPO of zero for a billing ledger requires synchronous replication; an RPO of an hour for an analytics store allows hourly backups.
- Backup and restore: backups are only as good as the last successful restore test. For OSS inventory, restore time for very large databases is often the real limit on RTO.
9.6 Chaos engineering
Chaos engineering is the practice of running controlled experiments that inject failures into a system to verify that it withstands them. Netflix popularised it with Chaos Monkey in 2011, which randomly terminated production instances to force engineers to build services that survive it. The Principles of Chaos Engineering describe the method: define the steady state in measurable terms (for example, the SLIs), hypothesise that it will continue during a failure, inject the failure, and look for differences.
Typical experiments for an OSS/BSS platform: kill pods of the activation service during a burst of orders; add 500 ms latency between the order service and inventory; make the identity provider unavailable; fail one Kafka broker; partition the network between two availability zones; fill the disk of a database replica. Tools such as Chaos Mesh and LitmusChaos (both CNCF projects) run these experiments as Kubernetes resources; commercial platforms such as Gremlin and the cloud providers’ fault injection services offer managed alternatives.
Chaos engineering starts in staging and with game days, not in production. Experiments should begin with a small blast radius, with an abort switch, and with the team watching. Moving them into production, gradually, is valuable once the basics are reliable, because staging never reproduces production load and dependencies exactly.
9.7 Incident management and postmortems
Incident management is the structured response to service disruption, designed to restore service first and understand causes later. Mature practices, derived from emergency services’ incident command systems, define clear roles: an incident commander who coordinates and decides, an operations lead who works on mitigation, a communications lead who informs stakeholders, and a scribe who keeps the timeline. Severity levels determine who is paged and how often updates are sent. Mitigation (rollback, failover, feature flag off) comes before diagnosis.
A blameless postmortem follows every significant incident. It reconstructs the timeline, identifies contributing factors (technical, process and organisational), and produces action items with owners and deadlines. Blameless does not mean without accountability; it means assuming that people acted reasonably with the information and tools they had, and asking why the system allowed the failure. Organisations that blame individuals get less reporting and repeat the same incidents. The Google SRE book chapter on postmortem culture remains the reference.
Incidents increasingly involve automation itself. When closed loops, GitOps agents and AI-driven remediation act on production, the incident process must cover their actions and include a way to pause them. How operations teams organise around AI agents, including decision rights and escalation, is the subject of our article on the NOC/SOC operating model with AI agents.
9.8 DORA metrics: measuring speed and stability together
The DORA metrics are the most widely used evidence-based measures of software delivery performance. They come from the DevOps Research and Assessment programme founded by Nicole Forsgren, Jez Humble and Gene Kim, whose annual surveys, run since 2014 and continued by Google Cloud after its 2018 acquisition of DORA, have collected responses from tens of thousands of professionals. Their central finding, repeated year after year, is that speed and stability are not a trade-off: the teams that deploy most often also tend to have the lowest failure rates and recover fastest. DORA now groups five metrics into throughput and instability.
| Metric | What it measures | Type | How to measure it in an OSS/BSS platform |
|---|---|---|---|
| Deployment frequency | How often changes are deployed to production | Throughput | Count of production deployments per service per day, from the GitOps or CD system |
| Lead time for changes | Time from commit to running in production | Throughput | Timestamp of commit versus timestamp of production sync for the artefact that contains it |
| Change failure rate | Share of deployments that cause a failure requiring remediation (rollback, hotfix, incident) | Instability | Deployments linked to incidents or rollbacks divided by all deployments |
| Failed deployment recovery time | Time to restore service after a failed deployment | Throughput | Time from failure detection to restoration for incidents caused by changes |
| Rework rate | Share of deployments that are unplanned fixes to production issues | Instability | Deployments tagged as hotfixes divided by all deployments |
Caption: The DORA software delivery metrics. Failed deployment recovery time replaced the broader “time to restore service” in 2023, and rework rate was added in 2024 (DORA metrics history).
Reference levels give a sense of what is achievable. The 2024 DORA report, the last to publish performance clusters, described the following levels.
| Cluster (2024) | Deployment frequency | Lead time for changes | Change failure rate | Failed deployment recovery time |
|---|---|---|---|---|
| Elite | On demand (multiple per day) | Less than one day | 5% | Less than one hour |
| High | Daily to weekly | One day to one week | 20% | Less than one day |
| Medium | Weekly to monthly | One week to one month | 10% | Less than one day |
| Low | Monthly to every six months | One to six months | 40% | One week to one month |
Caption: DORA 2024 performance clusters. Survey-based; the high cluster reported a higher change failure rate than the medium cluster, an anomaly the report itself discusses.
The 2025 report changed the model. Retitled the State of AI-assisted Software Development, it replaced the four performance tiers with seven team archetypes that combine delivery performance with factors such as team well-being, friction and product outcomes, reflecting the finding that AI assistance amplifies the strengths and weaknesses teams already have. For an operator, the practical lesson is unchanged: the metrics are best used to track a team’s own trend over time, not to rank teams against an industry table.
DORA metrics and SLOs answer different questions and must be read together. DORA measures the delivery system: how fast and safely changes flow. SLOs measure the service: whether users get the reliability promised. A team can deploy ten times a day with a 2% change failure rate while its service misses its SLO because of capacity problems unrelated to changes; another can have a perfect SLO record because it never ships anything. A balanced scorecard for an OSS/BSS platform therefore shows, per service, deployment frequency, lead time, change failure rate and recovery time next to SLO attainment and remaining error budget, plus two operator-specific indicators: order fallout rate and toil hours. When all move in the right direction together, the engineering model is working.
Metrics must not become targets for individuals. Goodhart’s law applies: a team rewarded for deployment frequency will split deployments; one rewarded for low change failure rate will stop reporting failures. DORA metrics are for teams to improve their own system, not for ranking teams or vendors.
10. Application to modern OSS/BSS architectures
10.1 TM Forum Open Digital Architecture: components, canvas and separation of responsibilities
TM Forum’s Open Digital Architecture (ODA) is the industry’s attempt to apply the technologies in this article to the whole operator software estate. It replaces the idea of large OSS/BSS suites with a catalogue of standard, replaceable software components, each exposing standard Open APIs and events, deployed on a standard Kubernetes-based runtime called the ODA Canvas. ODA organises functionality into functional blocks: Party Management, Core Commerce Management, Production, Intelligence Management, Engagement Management, and Decoupling and Integration. TM Forum reported in 2025 that more than 35 components had been specified, with around 70 planned.
An ODA Component is a software package with a standard shape. Its implementation is entirely up to the vendor or team that builds it (one microservice or twenty, any language, any database), but it must declare, in a machine-readable manifest, four things:
- Core function: the Open APIs it exposes (for example TMF638 for a service inventory) and the APIs it depends on (for example TMF639 resource inventory).
- Event notification: the events it publishes and subscribes to.
- Management function: its observability endpoints (for example a Prometheus metrics endpoint).
- Security function: its roles and permissions, how it is integrated with the identity provider, and its secrets needs.
The ODA Canvas is a set of Kubernetes operators that read that manifest and do the platform wiring automatically. The reference implementation, developed openly on GitHub by operators and vendors, defines a Component custom resource (API group oda.tmforum.org, with v1 as the current storage version) and a growing list of operators, among them:
- Component Management, which decomposes each component into its exposed APIs, dependent APIs and notifications.
- API Management, with implementations for several gateways and meshes (Apache APISIX, Kong, Istio, Apigee, Azure API Management and others), which publishes each exposed API on the gateway with the declared policies (rate limits, API key verification, OpenAPI validation).
- Identity Config, which registers the component’s roles in the identity provider (Keycloak in the reference implementation), and OAuth2 Config and Credentials Management for client credentials.
- Dependency Management, which resolves each dependent API to a component that exposes it, so components discover their dependencies instead of having them hard-coded.
- Event Management and Secrets Management, and more recent operators for disruption budgets and carbon reporting.
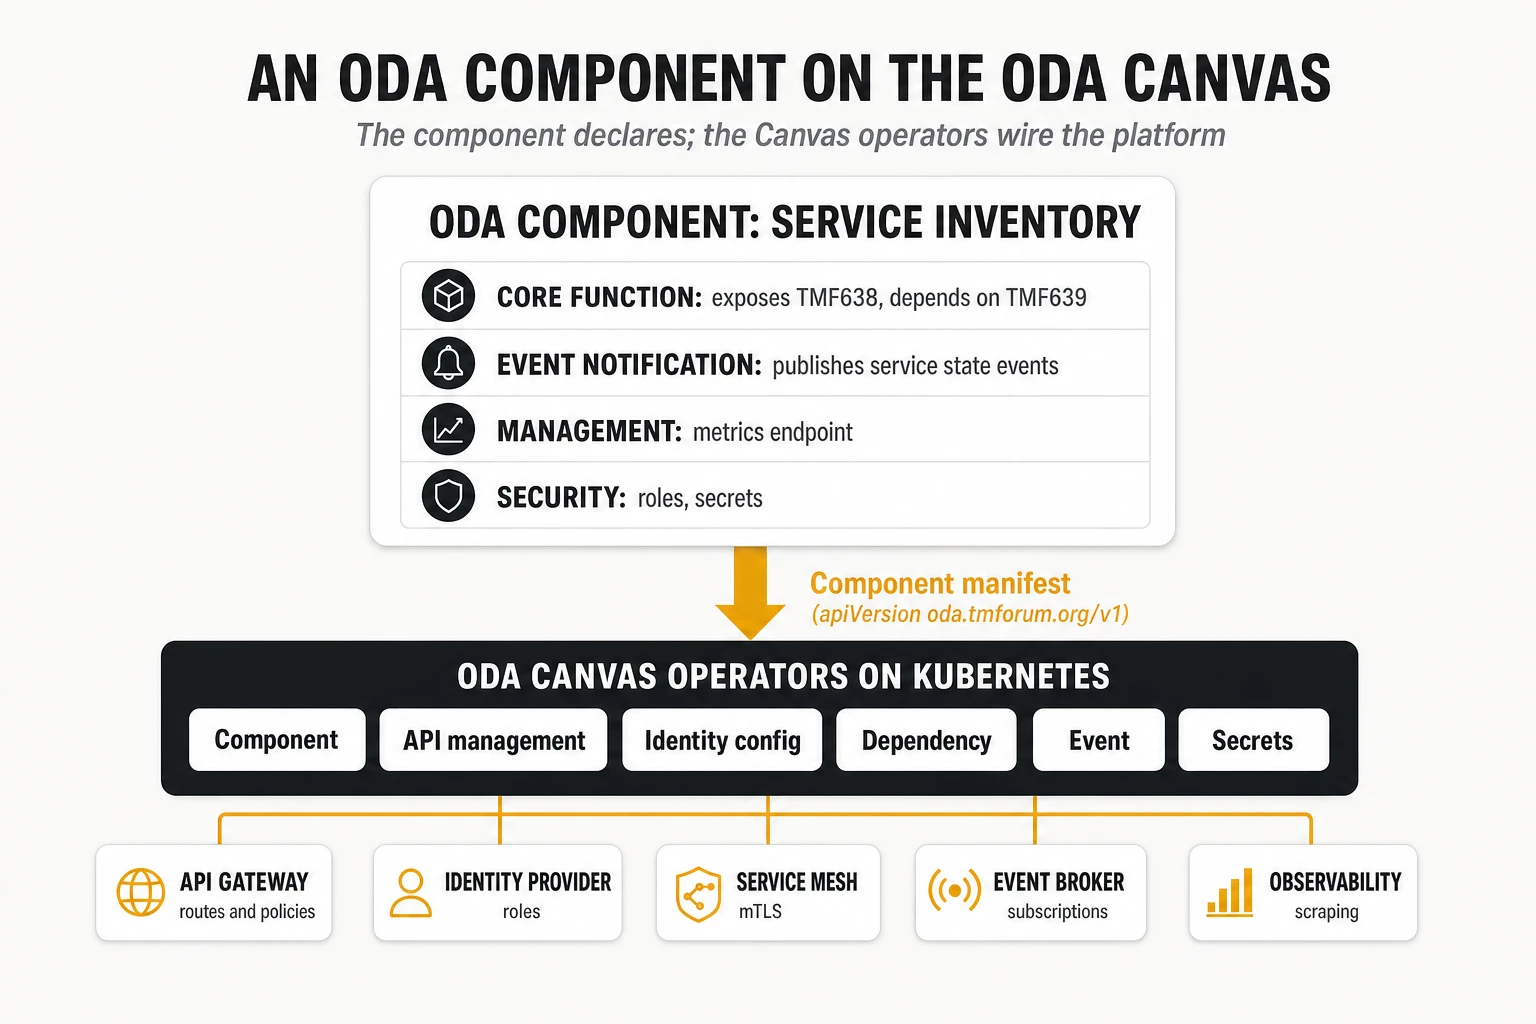
A component manifest for a service inventory looks like the example below. It follows the structure of the v1 Component resource in the Canvas repository; names, paths and the vendor-specific values are illustrative.
apiVersion: oda.tmforum.org/v1
kind: Component
metadata:
  name: acme-serviceinventory
  labels:
    oda.tmforum.org/componentName: acme-serviceinventory
spec:
  componentMetadata:
    id: TMFCxxx # ODA Component ID from the TM Forum directory
    name: serviceinventory
    functionalBlock: Production
    version: 2.3.1
    status: specified
    description: "Service inventory component exposing TMF638."
  coreFunction:
    exposedAPIs:
      - name: serviceinventory
        apiType: openapi
        specification:
          - url: "https://raw.githubusercontent.com/tmforum-apis/TMF638_ServiceInventory/main/TMF638-Service_Inventory_Management-v5.0.0.oas.yaml"
        implementation: acme-serviceinventory-api
        path: /acme-serviceinventory/tmf-api/serviceInventory/v5
        developerUI: /acme-serviceinventory/tmf-api/serviceInventory/v5/docs
        port: 8080
    dependentAPIs:
      - name: resourceinventory
        apiType: openapi
        specification:
          - url: "https://raw.githubusercontent.com/tmforum-apis/TMF639_ResourceInventory/main/TMF639-Resource_Inventory_Management-v5.0.0.oas.yaml"
  eventNotification:
    publishedEvents:
      - name: serviceStateChangeEvent
        apiType: openapi
        implementation: acme-serviceinventory-events
        hub: /acme-serviceinventory/tmf-api/serviceInventory/v5/hub
        port: 8080
    subscribedEvents: []
  managementFunction:
    exposedAPIs:
      - name: metrics
        apiType: prometheus
        implementation: acme-serviceinventory-metrics
        path: /acme-serviceinventory/metrics
        port: 4000
  securityFunction:
    canvasSystemRole: Admin
The architectural value of ODA is the separation of responsibilities it enforces. The component owns business logic and data. The Canvas owns cross-cutting platform concerns: exposure, identity, mTLS, discovery, observability wiring, secrets. The Open APIs and event schemas own the contract between components. Each can then change independently: a vendor can replace its implementation without changing the contract, the operator can change its API gateway without touching any component, and a component can be replaced by another vendor’s implementation of the same APIs. TelcoCrux view: this separation, more than any individual standard, is what makes best-of-breed OSS/BSS economically viable.
ODA is in production, but adoption is uneven. Vodafone Greece reported running ODA Canvas in commercial production on its internal cloud platform, with API gateway configuration for a component reduced from about two weeks of manual work to roughly three seconds through the Canvas operators (operator-reported figure, 2025). Vodafone’s earlier CNCF case study described moving its digital platform to Kubernetes and from one release every three months to tens per day. Swisscom’s sovereign Kubernetes service, documented by the CNCF in 2026, runs more than 600 clusters with Argo CD, Kyverno and Prometheus as core building blocks. Public, quantified results of full ODA Canvas deployments at other large operators remained scarce as of October 2026, and many vendors claim “ODA compliance” based on Open API conformance alone, without Canvas deployability.
The Canvas is also becoming the runtime for AI agents. Recent versions of the Component resource allow mcp as an API type alongside openapi, so that Model Context Protocol tools and AI agents can be packaged, secured and discovered as components. This is consistent with the direction of closed-loop operations: agents that act on OSS/BSS through the same governed APIs as any other component.
10.2 Example A: an inventory platform
Inventory is the system of record for what the network contains and which services run on it, and it is the component whose data quality determines whether everything else can be automated. A modern inventory platform, built with the technologies in this article, typically looks as follows.
Decomposition. Rather than one inventory application, the platform is split by bounded context: a resource inventory (physical, logical and virtual resources, TMF639), a service inventory (CFS and RFS instances and their relationships, TMF638), a topology service that maintains the graph of connections and dependencies, and a reconciliation service that compares discovered reality with recorded state. Each owns its data.
Data stores, chosen per access pattern.
- A relational or document store holds the authoritative entities and their lifecycle state, with optimistic concurrency on updates.
- A graph read model, built from events (CQRS), answers impact and path questions: which services ride on this fibre, which customers are affected if this router fails.
- A search index supports the user interface and free-text lookup.
Integration. TMF638 and TMF639 serve queries and controlled updates from order management and orchestration. Every change emits an event (for example a service state change) on Kafka, keyed by the entity identifier so that changes to one entity stay in order. Discovery collectors publish what they find in the network as events; the reconciliation service consumes both streams, detects discrepancies and either fixes them automatically (low-risk attributes) or raises work items for humans (high-risk changes). Legacy inventories that cannot be retired yet feed the platform through CDC.
Operations. SLOs cover query latency for operational lookups (for example 99% under 300 ms), freshness of the graph read model (events applied within seconds) and reconciliation backlog. Saturation metrics watch database connection pools and consumer lag. Bulk operations, such as importing a new region’s network, are throttled and run as jobs that scale with KEDA so they do not degrade interactive queries.
Where it goes wrong. The recurring failures are not technological: no single owner for each attribute (two systems both “master” the same data), reconciliation treated as a one-off migration rather than a permanent process, and graph models built without the event discipline that keeps them current. The functional landscape of discovery and inventory products, and how they combine with observability, is analysed in our platform comparison referenced above; the graph modelling options in our network digital twin article.
10.3 Example B: a provisioning and activation engine
Provisioning turns a service order into configured network resources, and it is the archetypal long-running, failure-prone distributed transaction in OSS.
Flow and contracts. The BSS submits a service order through TMF641. The order management component validates it against the service catalogue, decomposes it into technical tasks and starts an orchestrated saga: reserve resources in inventory (TMF639), design the service, activate it through TMF640 or domain controllers, update the service inventory (TMF638), and report state back to the BSS through TMF641 events.
Orchestration engine. A durable workflow engine (Temporal, Camunda, or a vendor orchestrator) holds the state of each order, so that if a pod restarts mid-order the process resumes where it stopped. Each step has a timeout, a retry policy and a compensating action: release reserved resources, remove partial configuration, notify the BSS of failure with a reason code. The workflow history is the audit trail of what happened to every order.
Idempotent activation. Southbound adapters talk to network controllers and devices through NETCONF/YANG, gNMI, vendor APIs or SDN controller interfaces. Every activation request carries the order and task identifiers as an idempotency key; adapters read the current configuration, compute the difference with the desired state and apply only that, so a retry after a lost response does not duplicate configuration. Adapters are deployed per network domain and technology and released independently, behind a stable internal contract.
Event backbone. Every state transition is published as an event, which feeds the customer portal (order tracking), the assurance system (new services to monitor), billing (start of charging) and analytics, without the orchestrator calling each of them.
Delivery and reliability. Adapter releases are canaried by scope: a new version of the fibre access adapter is enabled for one region first, with automated comparison of activation success rate and duration against the previous version. The SLIs that matter are business ones: the share of orders activated without manual intervention (“flow-through rate”), activation time per order type and order fallout rate. Fallouts are classified automatically by cause, which turns them from daily toil into a prioritised backlog of software fixes.
10.4 Example C: an assurance system
Assurance detects, diagnoses and resolves service problems, and it is the most data-intensive part of OSS: alarms, performance counters, flow records, probes and logs from the whole network, arriving continuously.
Ingestion and processing. Collectors receive SNMP traps, syslog, streaming telemetry (gNMI), flow records and probe results, normalise them and publish to Kafka topics partitioned by network element or service. Stream processing jobs, typically in Flink, deduplicate alarms, enrich them with inventory and topology context, compute KPIs over time windows using event time and watermarks, and detect threshold crossings and anomalies.
Correlation and diagnosis. A correlation service uses the topology graph to group alarms that share a root cause (a fibre cut that produces thousands of downstream alarms) and to compute service and customer impact. Alarms are exposed through TMF642; problems that require action become trouble tickets through TMF621, integrated with the operator’s ITSM platform. AI-assisted diagnosis and recommended actions increasingly sit on top of this layer.
Closed loops. For well-understood conditions, the assurance system triggers remediation automatically: reroute traffic, restart a function, scale capacity, or open a provisioning task. Each automated action is recorded, rate-limited and reversible, and operations can pause any loop. In ODA terms, the Intelligence Management block hosts the analytics and decision logic; intents (TMF921) express the goals that closed loops maintain.
Engineering the assurance platform itself. The assurance system must be more reliable than the network it watches, especially during the incidents that generate alarm storms. Its own SLOs cover end-to-end latency from event to correlated alarm, consumer lag per topic, and correlation accuracy. Load tests replay recorded alarm storms; chaos experiments fail brokers and Flink task managers during peaks. This is where software observability (section 6.6) and network observability meet: an assurance pipeline that falls behind is itself a service-affecting failure. The data platform behind it is covered in our data layer article, and the operating model for teams running it with AI agents in our analysis of the NOC/SOC operating model.
10.5 One order, end to end
Following a single enterprise order through the platform shows how all the technologies interlock. An enterprise customer orders a 5G network slice with guaranteed latency for a factory campus.
| Step | What happens | Technologies involved |
|---|---|---|
| 1. Order capture | Customer portal submits a TMF622 product order based on a TMF620 offering | API gateway, OAuth 2.0 / OIDC, OpenAPI validation, trace started |
| 2. Decomposition | Order management decomposes the product into service orders sent via TMF641 | Microservice, saga orchestration, outbox pattern, Kafka event |
| 3. Feasibility and reservation | Service and resource inventories checked and resources reserved | TMF638/TMF639, idempotency keys, optimistic concurrency, graph read model |
| 4. Activation | Activation component configures RAN, transport and core domains through controllers | TMF640, workflow engine, NETCONF/YANG and vendor APIs, compensations |
| 5. Inventory update and notification | Inventories updated; state events published; billing and portal react | Event-carried state transfer, schema registry, CloudEvents, consumer groups |
| 6. Assurance onboarding | Slice KPIs monitored against the agreed latency; intent registered | Stream processing, TMF642/TMF621, TMF921 intent, closed loop |
| 7. Observability | One trace links the order API call to the last controller call; SLO dashboards update | OpenTelemetry, W3C Trace Context through Kafka headers, Prometheus, Tempo/Jaeger |
| 8. Change | A fix to the activation adapter ships the next day through the pipeline | GitOps, signed images, admission policies, canary by region, error budget gate |
Caption: A 5G slice order mapped to the technologies discussed in this article.
None of these steps is exotic in isolation; the difficulty is making all of them work together, every day, across components from different vendors. That is the practical meaning of “modern OSS/BSS”.
11. Architecture, technology choices and operational trade-offs
Every technology in this article solves a problem and creates another. The decisions below are the ones that most often determine whether an OSS/BSS modernisation delivers value or merely moves complexity around. For each, the question is not which option is better in general but under which conditions each pays back, and what it costs that does not appear in the business case.

11.1 Monoliths versus microservices
Microservices pay back when many teams change a large domain often; they destroy value when one team owns a stable one. Their hidden costs are concrete: a platform team to run Kubernetes, observability and pipelines; distributed data problems (sagas, consistency, reconciliation); per-service overhead in security reviews, dependency updates and on-call; and the cognitive load of debugging across services.
- Choose microservices for capabilities the operator builds and evolves itself, with several teams, frequent change and uneven scaling needs: order orchestration, catalogue-driven commerce, assurance analytics.
- Choose a modular monolith or a packaged product for stable domains with one owner, such as a vendor’s rating engine or a regulatory reporting system, provided it exposes standard APIs and events and runs on the common platform.
- Warning sign: more services than engineers, or services that are always released together.
11.2 Integration through APIs versus events
APIs are better for questions and for commands that need an immediate answer; events are better for facts that several parties need to know. API-only architectures create long synchronous chains and tight runtime coupling; event-only architectures make simple queries complicated and hide process logic across consumers.
- Use APIs for queries (eligibility, catalogue, inventory lookups), user-facing actions and partner exposure, where TM Forum Open APIs provide the contracts.
- Use events for state changes, notifications, telemetry and alarms, and for feeding read models and analytics.
- Hidden costs of events: schema governance, broker operations, idempotent consumers everywhere, harder debugging and end-to-end tracing through asynchronous hops.
11.3 Kubernetes versus traditional platforms
Kubernetes standardises how software is deployed and operated across vendors and environments; it does not make any individual application simpler. Its hidden costs are the platform team, the upgrade treadmill (several minor versions a year, each requiring vendor certification of every component), multi-cluster management and new skills in networking, storage and security.
- Kubernetes pays back when an operator runs many applications from many vendors and wants one deployment, security and observability model for all, or when it builds software in-house.
- Virtual machines or vendor-managed appliances remain reasonable for a small number of stable, vendor-supported applications whose vendor does not certify containers, or where the vendor operates the system as a managed service.
- Condition for success: a single, standard platform shared by OSS/BSS workloads, not one cluster flavour per vendor.
11.4 Centralised versus distributed integration
Centralised integration (an ESB or integration competence centre) gives control and consistency at the cost of a bottleneck; distributed integration (teams own their APIs and events) gives speed at the cost of governance. The pendulum swung from ESBs to “every team integrates directly”, and many operators are now settling on federated models.
- Recommended model (TelcoCrux view): central ownership of standards, platforms and shared assets (API gateway, event backbone, schema registry, API profiles, conformance tests), and decentralised ownership of the APIs and events themselves by the teams that own each capability.
- Hidden cost of full decentralisation: inconsistent API designs, duplicate data transformations, and no one able to answer which systems consume a given event.
11.5 Commercial software versus open source
Open source removes licence fees and gives freedom to change supplier; it does not remove the cost of running, securing and supporting the software. Kubernetes, Kafka, PostgreSQL, Prometheus and Argo CD are excellent, but someone must patch them, upgrade them, and answer the phone at 3 a.m. That someone is either an in-house team or a vendor selling an open-source distribution with support.
- Open source pays back for horizontal technologies with broad communities and multiple support providers, where skills are available in the market and lock-in risk is high.
- Commercial products pay back for domain functions where vendor expertise and certification matter (charging, network-specific activation), and where the operator does not want to build engineering capacity.
- Licence changes are a real risk in both directions: several open-source infrastructure projects moved to source-available licences in recent years (Terraform, Elasticsearch for a period, Redis for a period), and commercial licence terms can change after acquisitions, as operators using VMware experienced. Projects governed by foundations (CNCF, Apache, Linux Foundation) with many contributing companies are the safest long-term bets.
11.6 Integrated platforms versus best-of-breed
An integrated suite from one vendor reduces integration work and gives one accountable supplier; a best-of-breed architecture combines the best product for each function at the cost of integrating them. ODA and the Open APIs were designed to make best-of-breed cheaper, by standardising the interfaces between components.
- Integrated suites fit operators that want fast time to value, have limited integration capacity and accept the vendor’s roadmap.
- Best-of-breed fits operators with strong architecture and integration teams, differentiated needs in specific domains, and a strategy to keep suppliers competing.
- Hidden costs of best-of-breed: integration testing across vendor release cycles, ambiguous accountability when an end-to-end flow fails (“the problem is in the other vendor’s component”), and the need to own the end-to-end architecture. The realistic outcome in 2026 is a hybrid: a suite for core commerce or core operations, with best-of-breed components where differentiation justifies it, all connected through Open APIs and a shared event backbone.
11.7 Automation versus operational complexity
Automation removes toil but adds a system that itself must be engineered, tested and operated. A GitOps setup, a progressive delivery controller, an SLO generator and a closed-loop remediation engine each reduce manual work; each can also fail, misfire or act at machine speed on wrong data.
- Automate first what is frequent, well understood and reversible: deployments, rollbacks, certificate rotation, scaling, routine order fallout fixes.
- Keep human approval for rare, high-impact or irreversible actions until the automation has a track record, and design every automation with a visible pause switch.
- Measure the automation itself: how often it acts, how often it is overridden, and how often it causes incidents. The broader journey from scripted automation to autonomous operations is mapped in our article on the autonomous networks journey and, for the architecture of closed loops and guardrails, in our autonomous operations blueprint.
11.8 Technological flexibility versus vendor dependency
Every platform choice creates dependencies; the goal is to keep them reversible, not to avoid them. Flexibility has a price: abstracting away from a cloud provider’s managed services, writing to standard APIs rather than proprietary ones, and keeping skills in-house all cost money up front.
- Invest in reversibility at the layers where switching cost grows fastest: data (open formats, exportable schemas), interfaces (Open APIs, OpenTelemetry, OCI, Kubernetes APIs), automation (GitOps repositories owned by the operator) and skills.
- Accept dependency where the value is high and the exit cost is bounded and known, and write the exit into the contract: data export, transition assistance, support for standard interfaces.
- The infrastructure-layer version of this trade-off, with the specific control points held by platform vendors and hyperscalers, is analysed in our telco cloud lock-in article.
11.9 Hidden costs and the talent equation
The licence and infrastructure lines of a modernisation business case are usually the smallest part of its real cost. The items below are those most often missing or underestimated, based on TelcoCrux observation of operator programmes; their weight varies widely by organisation and is not quantified here because public benchmarks are scarce.
| Hidden cost | Where it comes from | Mitigation |
|---|---|---|
| Platform engineering team | Running Kubernetes, the mesh, observability, pipelines and the event backbone as internal products | Standardise on one platform; consider managed services for undifferentiated layers |
| Observability spend | Telemetry volume and cardinality growing with services; ingest-based pricing | OpenTelemetry Collector with sampling and filtering; tiered storage; cardinality budgets |
| Upgrade treadmill | Kubernetes, distribution, mesh, broker and library upgrades several times a year; vendor certification lag | Contractual support for current versions; automated upgrade testing; fewer, standard components |
| Integration testing across vendors | Best-of-breed components on independent release cycles | Consumer-driven contracts; operator API profiles and conformance suites |
| Data migration and reconciliation | Moving from legacy inventories and order systems; running old and new in parallel | Strangler pattern with CDC; reconciliation as a permanent capability, not a project |
| Security and compliance work | SBOMs, vulnerability triage, policy maintenance, regulatory reporting | Central DevSecOps templates; vendor SBOM/VEX obligations in contracts |
| Skills and retention | Scarce cloud-native, SRE and security engineers; competition with tech companies | Internal academies; career paths for engineers in operations; partner model with knowledge transfer clauses |
| Organisational change | Team topologies, on-call duties for developers, new decision rights | Explicit operating model change with the same priority as the technology |
Caption: Hidden costs of cloud-native OSS/BSS and their mitigations. TelcoCrux assessment.
Talent is the binding constraint. A traditional OSS/BSS organisation is built around product specialists, integration developers and operations staff who know specific vendor systems. The model in this article needs platform engineers, SREs, security engineers, API product owners and developers comfortable with distributed systems, and it needs them in the operator, not only in its suppliers. An operator that outsources all of these skills can still run modern OSS/BSS, but it will not be able to judge its suppliers’ work, negotiate from strength or change direction quickly.
12. Conclusions
Modern OSS/BSS is a chain of software engineering capabilities, and the chain is only as strong as its weakest link. Containers and Kubernetes provide a uniform, self-healing runtime. Microservices allow independent change, at the cost of distributed data and partial failure. APIs and events, standardised by TM Forum and the wider industry, connect components without coupling them. Observability makes the resulting system understandable. CI/CD and GitOps make change routine and auditable. DevSecOps keeps fast change safe. SRE decides, with data, how much change the service can absorb. ODA packages all of it into components that a Kubernetes-based canvas can deploy and wire automatically.
Five principles summarise the argument:
- Adopt the chain, not the links. Microservices without observability, or continuous delivery without SLOs, deliver the costs of the new model without its benefits.
- Standardise the platform and the interfaces; let the components vary. One Kubernetes platform, one event backbone, one observability standard (OpenTelemetry), one set of API profiles, and freedom inside each component.
- Put contracts at the centre. OpenAPI and AsyncAPI documents, operator profiles of TM Forum Open APIs, schema registries and consumer-driven tests are what make independent delivery real.
- Treat reliability and security as code. SLOs, alerts, policies, pipelines and infrastructure all live in Git, reviewed and versioned like the application.
- Own the engineering capability. Vendors can supply components and even operate platforms, but the operator must retain the architecture, the standards and enough engineering depth to judge and steer.
What each role should do next
- CTOs and technology directors: fund the platform and the operating model as products with their own teams and roadmaps, not as project overheads; make DORA metrics, SLO attainment and toil visible at management level; and require reversibility (open interfaces, data export, SBOMs) in every OSS/BSS contract.
- Heads of OSS/BSS: identify the two or three capabilities where frequent change creates business value and modernise those first with the full chain; leave stable packaged systems in place behind standard APIs; and make order fallout and manual reconciliation measurable, because they are the clearest indicators of where the software needs fixing.
- Enterprise and solution architects: define the operator’s profiles of the TM Forum Open APIs and event schemas, the platform reference architecture and the golden-path pipelines; decide explicitly which flows go through APIs, events, CDC or batch; and review designs for the distributed monolith anti-pattern.
- Transformation leaders: plan the organisational change (team boundaries aligned with components, on-call responsibility, new roles such as SRE and platform engineering) with the same rigour as the technology, and sequence the programme so that observability, pipelines and SLOs arrive before the number of services grows.
A realistic sequence
The order in which capabilities are built matters as much as which ones are chosen. A sequence that works in practice, in TelcoCrux’s experience, is:
- Platform foundations: one Kubernetes platform, GitOps, a container registry with scanning, secrets management and baseline admission policies.
- Visibility before decomposition: OpenTelemetry instrumentation, a shared observability stack and first SLOs for the most important existing journeys (order capture, activation, alarm handling).
- Contracts and backbone: API gateway, operator profiles of the key Open APIs, an event backbone with a schema registry, and CDC from the legacy systems that are not yet replaced.
- Golden-path pipelines with the full DevSecOps gates, offered to every team and every vendor.
- Targeted decomposition: modernise the high-change capabilities as components, using the strangler pattern around legacy systems.
- Reliability management: error budget policies, chaos experiments, blameless postmortems and toil reduction targets, followed by closed-loop automation where the SLOs and data are trustworthy.
The operators that will move fastest in the next five years are not those that buy the most modern OSS/BSS products, but those that can change their systems safely every day. That is an engineering capability, built over years, and it is the real asset behind every promise of autonomous operations and faster time to market.
Related TelcoCrux analysis
- Telco Cloud and the New Lock-In: the infrastructure layer below OSS/BSS, from NFV and OpenStack to Kubernetes, OpenShift and the edge, and how to keep platform dependencies reversible.
- Network Discovery, Inventory and Observability Compared: the functional OSS platforms that the technologies in this article are used to build.
- The Data Layer of Autonomous Networks: streaming, storage and real-time processing behind network assurance, plane by plane.
- Change Management in Telecom Networks: how automated delivery fits with risk classification, approvals and network change processes.
- Building Autonomous Network Operations: the closed-loop engine, data foundations and guardrails that sit on top of a modern OSS.
- The NOC/SOC Agentic Development Model: how automation scenarios and AI agents are developed, tested and released, applying the delivery discipline described here to operations.
At TelcoCrux, we help operators and the technology companies that sell to them turn OSS/BSS modernisation into engineering decisions that hold up in production: target architectures based on TM Forum ODA and Open APIs, platform and integration choices, DevSecOps and SRE operating models, and contract terms that keep suppliers interchangeable. See how we work and who is behind TelcoCrux, or write to info@telcocrux.com if you want an independent review of your OSS/BSS architecture or modernisation roadmap.