
1. The layer every other layer is bounded by
When a transport ring fails at the busy hour, the data platform of an operations centre has its worst minute of the year. Alarm and log rates can rise by one or two orders of magnitude within minutes, every cloud-native function emits logs about its lost peers, the session records of a few million subscribers change state at once, and the people and agents investigating start querying the platform at the same time as it is trying to absorb all of that. The evidence needed to explain the incident is generated exactly when the infrastructure that should carry it is most likely to drop it, delay it or serve it stale.
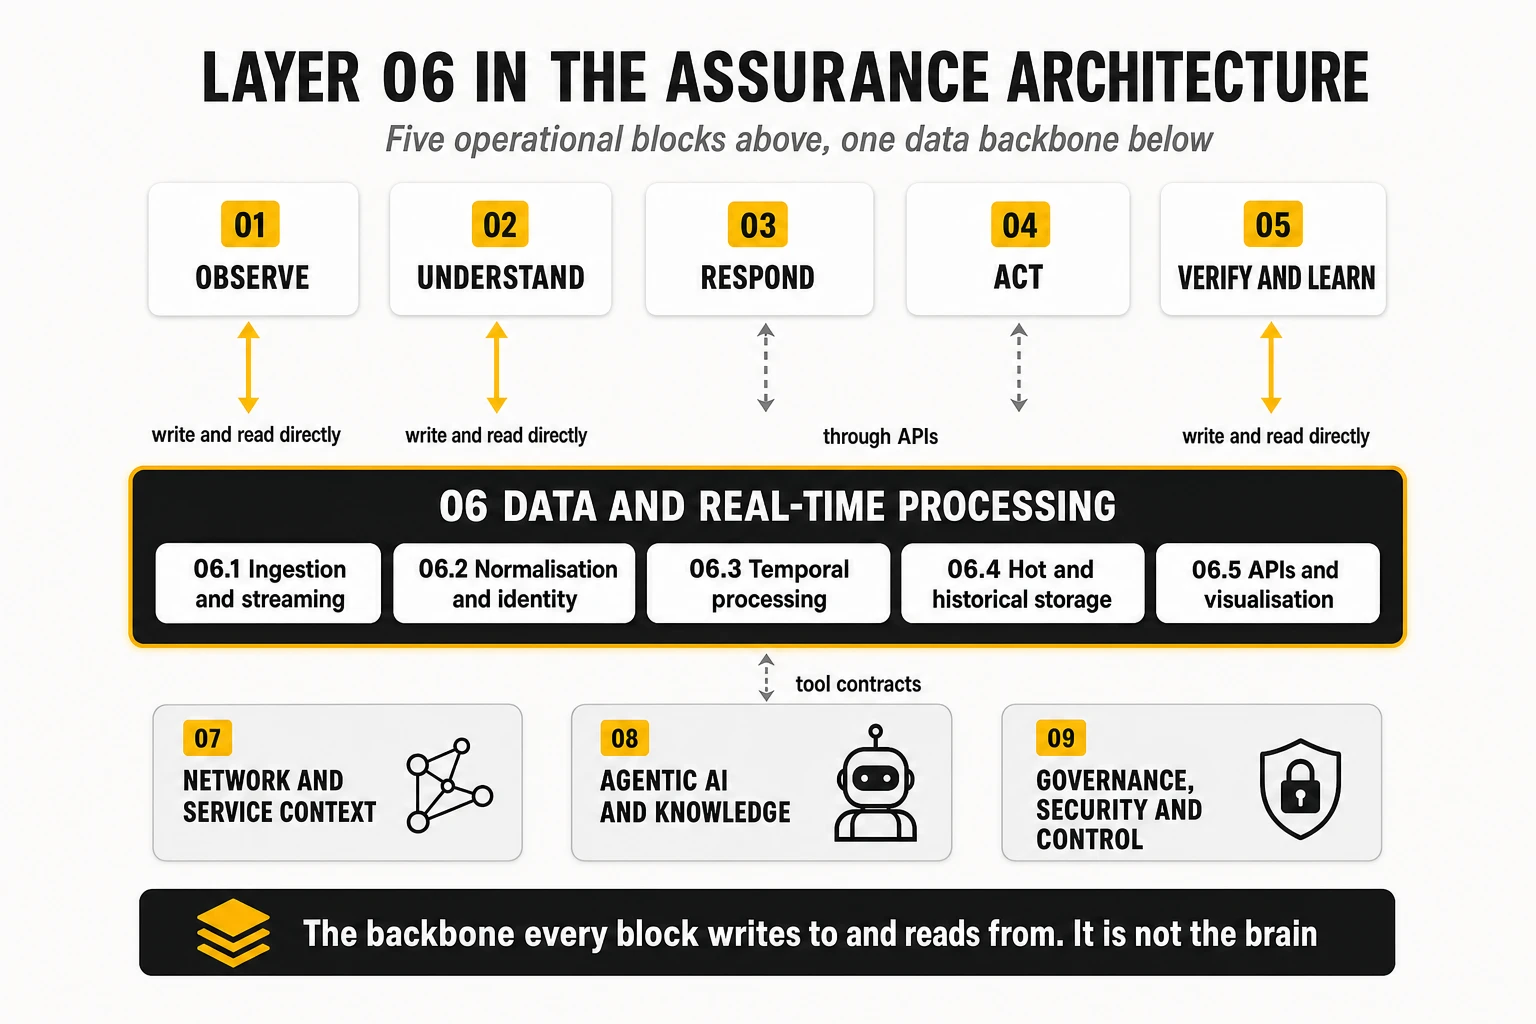
That is the physics of the data and real-time processing layer, and it is why the layer deserves its own article. In our reference architecture for end-to-end real-time network and service assurance, it is layer 06: the backbone that blocks 01 OBSERVE, 02 UNDERSTAND and 05 VERIFY AND LEARN write to and read from directly, and that 03 RESPOND, 04 ACT and 08 AGENTIC AI reach through its interfaces. That article defined the layer in five capabilities and one test — the backbone is not the brain. This one opens the layer up: what makes it hard, which technologies and suppliers now compete for each part of it, how they combine, and how an operator governs the result.
The thesis is that layer 06 should be designed around the decisions it has to support, not around a platform. A detector that must act in seconds, an engineer comparing five user plane functions over the last hour, a planner training a model on three years of degradations and an automation that needs the current configuration of an instance are four different workloads with four different physics. No single engine is best at all four, and the market has stopped pretending otherwise: streaming logs are moving onto object storage, stream processors are learning to keep their state remotely, lakehouse table formats are acquiring streaming semantics, and every large data platform now sells a real-time tier. The convergence is real, but it is a convergence of storage and formats, not of workloads. The operator still has to decide which engine answers which question, and to keep the logical architecture — the contracts, the semantics, the identities and the portability of the data — under its own control while doing so.
The article in brief
What the layer does. Layer 06 moves every signal the network and its systems produce into a durable pipeline, gives it a common meaning and a resolved identity, runs the continuous calculations that turn events into indicators, stores the result for the present and for history, and exposes it through stable interfaces. It executes calculations; it does not own the logic that decides what is an anomaly, what caused it or what to do about it. Those belong to the blocks that consume it.
Why it is hard. It has to be designed for the incident, not for the normal day: the moment when events, queries and actions multiply at once. And its hardest problems are semantic and temporal — the same entity under many keys, clocks that disagree, the same counter meaning different things, the absence of data that looks like the absence of a problem — before they are about throughput.
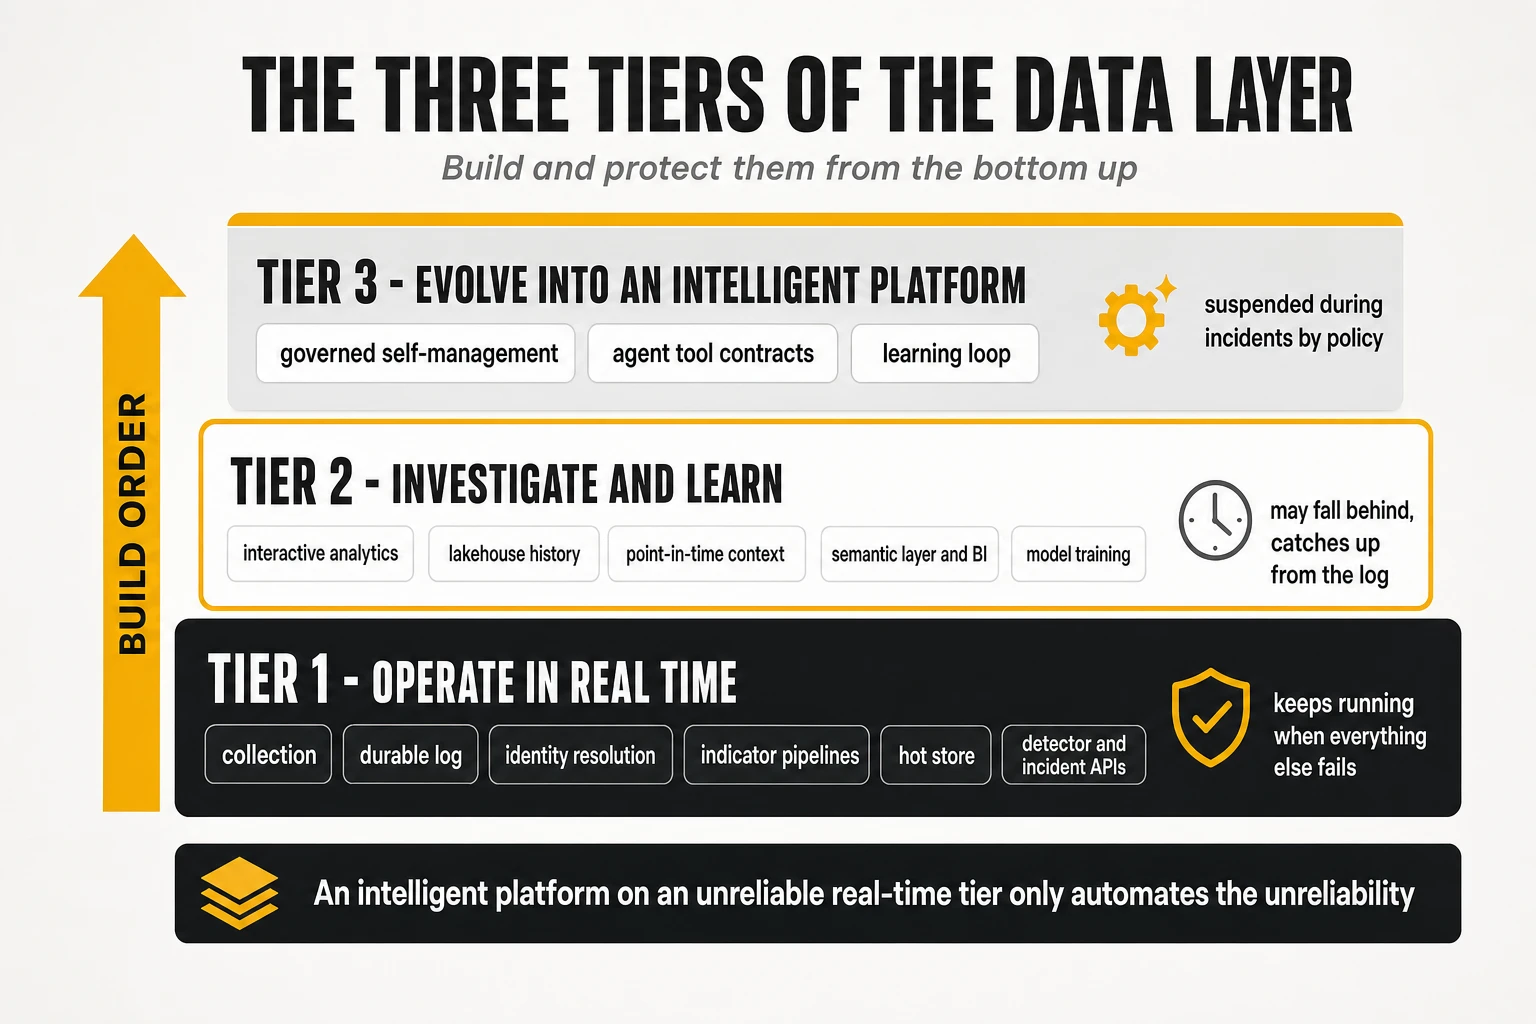
The thread of the article: three tiers. Everything in the layer belongs to one of three tiers, and they should be built and protected in this order.
- Tier 1 — Operate in real time. What the operations centre cannot work without: collection, the durable log, normalisation and identity resolution, stream processing of indicators, the hot stores that detection and verification read, and the interfaces they use. It must keep running when everything else fails.
- Tier 2 — Investigate and learn. What turns evidence into understanding: interactive investigation over recent data, history in the lakehouse, point-in-time context, analytics, reporting and model training. It can fall behind during an incident and catch up afterwards.
- Tier 3 — Evolve into an intelligent platform. What makes the layer adapt: governed self-management of capacity, storage and cost, data products exposed to AI agents, and the learning loop. It is valuable only on top of a solid tier 1 and tier 2.
The decisions that matter most. A latency budget per decision rather than a “real-time” label; where identity is resolved and who owns it; a separated critical path; the right store for each kind of question; and control of the logical architecture — contracts, semantics, identities and the portability of data. Open table formats and an independent catalog are the lakehouse part of that control, not the whole of it.
How to assemble it. Four models recur: the corporate platform as the core, a composable open stack, a hybrid of an operational backbone with the corporate lakehouse, and an integrated telecom platform. For a large convergent operator, the hybrid is the one to evaluate first.
How to govern and test it. Twelve master keys — data products, latency budgets, owned semantics, contracts, portable history, a protected critical path, a storm policy, data observability, change control over the platform, cost per decision and purpose-based access — and seven acceptance tests run on the operator’s own incidents.
The nine categories, in one list
The assurance reference architecture numbers every part of the operational system, and this article keeps the numbers. Five operational blocks perform the work; four shared layers support all of them.
- 01 OBSERVE — capture the evidence: alarms, counters, events, logs, traces, probe and quality data.
- 02 UNDERSTAND — detect anomalies, correlate, find the probable root cause and the service impact.
- 03 RESPOND — event intelligence, incident response and the ticket or master record in ITSM, the IT service management platform.
- 04 ACT — select, approve, orchestrate and execute remediation.
- 05 VERIFY AND LEARN — confirm that the service has recovered and feed the lessons back.
- 06 DATA AND REAL-TIME PROCESSING — the subject of this article: the backbone the blocks write to and read from.
- 07 NETWORK AND SERVICE CONTEXT — discovery, inventory, topology and the graph of dependencies.
- 08 AGENTIC AI AND OPERATIONAL KNOWLEDGE — agents, retrieval over operational knowledge, tool access.
- 09 GOVERNANCE, SECURITY AND CONTROL — identity, policies, autonomy limits, audit.
Where this article sits in the series
Layer 06 cannot be discussed in isolation, but it can be discussed in focus. The adjacent topics have their own articles, and this one refers to them rather than repeating them.
- The end-to-end model. End-to-End Real-Time Network and Service Assurance defines the five blocks and four layers, numbers every capability from 01.1 to 09.4 and maps the suppliers to them. The numbering used here is the same.
- The network as a graph. The Network as a Queryable Graph covers layer 07 in depth: network digital twins, Spanner Graph versus Neo4j, and how a graph is built from inventory exports. Section 8 of this article explains where the graph ends and the data layer begins.
- Change. Network change management covers the governed lifecycle of a change. Here, change matters as a data stream: the event that most often explains a degradation.
- Operations and agents. The autonomous operations blueprint, the NOC/SOC operating model with AI agents and its agentic development model cover who consumes the layer and how.
- Autonomy levels. The autonomous networks journey places all of this on the TM Forum level scale.
A note on sources and assessments. Product capabilities, versions and dates are taken from public documentation and release notes, linked in the text, and were checked in October 2026; this market moves quarterly, and a version number cited here should be re-verified before it is written into a requirement. Latency and throughput figures published by suppliers are reported as supplier figures, not as planning assumptions. Assessments of fit, strengths and limits are TelcoCrux views. The worked example in section 9 uses illustrative figures, labelled as such.
How to read the article. It moves from problem to solution to control.
- Section 2 follows one signal from a network function to an agent and to history, defines what the layer is responsible for, and lists the sources of a convergent operator. Section 3 sets out the ten challenges that make the layer hard. Both are vendor-neutral and are the part to read first.
- Section 4 turns the challenges into a reference architecture of eight functional planes, organised in the three tiers, including the governed self-management loop.
- Sections 5 and 6 go through the technologies plane by plane and then the platforms and suppliers, and what each one brings.
- Section 7 describes four ways to assemble the layer and which to evaluate first.
- Section 8 draws the boundaries with the graph, change management and agents; section 9 follows one incident through the layer.
- Section 10 covers the infrastructure underneath; sections 11 and 12 give the twelve master keys of governance and the tests to evaluate a proposal; section 13 concludes.
2. What layer 06 is responsible for
2.1 One signal, end to end
Before the capabilities, the challenges and the products, it helps to follow a single signal through the layer. Take the packet loss measured by one user plane function (UPF) in a 5G core — the function that forwards subscribers’ traffic — reported once a minute. The same journey applies, with different sources, to an optical level on a PON port, a latency measurement on a transport link or a failed call on a voice platform.
- Generated. The UPF exposes the counter through its vendor’s streaming interface every minute, stamped with the time of measurement and the UPF’s own name.
- Collected. A collector receives it, adds the source identifier and the collection time, and checks it against the expected schema. Nothing is interpreted yet.
- Logged. It is written to a Kafka topic, keyed by the stable source identifier so that all measurements from that UPF stay in order. It is retained for days, so it can be replayed.
- Normalised and resolved. An enrichment step maps the vendor counter onto the operator’s KPI definition (“user plane packet loss”), resolves the source name to the operator’s entity for that UPF instance, and attaches what every later step needs: host, site, software version, slices served. If the event carries subscriber identifiers, they are replaced with tokens here.
- Processed. A stream processor such as Flink computes, in event time and per minute, derived indicators — the loss for this instance, the median for its peer group of the same release, the deviation between the two — and publishes them as a data product.
- Used for detection. The detection logic of block 02 consumes those indicators and decides, with its own models and thresholds, whether the deviation is an anomaly. Layer 06 computed the numbers; block 02 owns the judgement.
- Served hot. The normalised measurements and indicators land in a real-time analytical store at full granularity for the last weeks, and the latest value in a low-latency cache for the operations centre’s screens.
- Queried. An engineer, or an AI agent through a governed tool, asks for “packet loss for this UPF and its peers over the last six hours” through a data product API and receives the answer with its provenance: which data product, which version, how fresh.
- Kept. The same normalised records are written continuously to an open-format lakehouse table and kept for years, with the identity mapping that was valid at the time, for post-incident analysis, recurrence studies and model training.
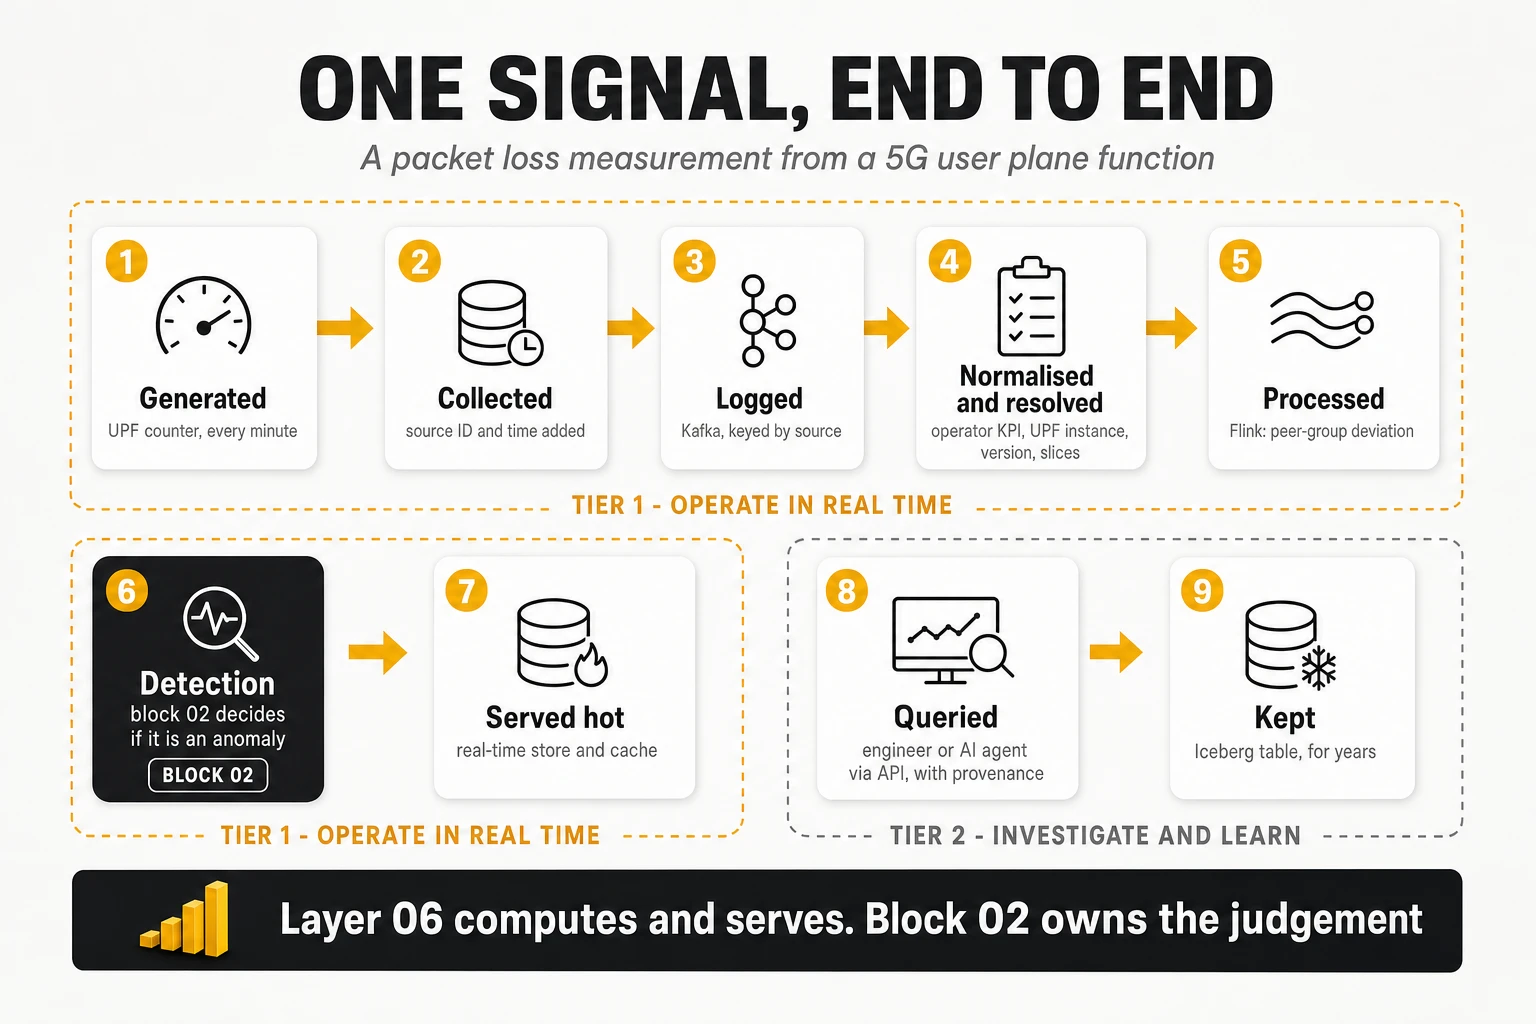
Every section that follows elaborates one of these steps. Steps 1 to 7 are tier 1 — they must work during an incident. Step 8 spans tiers 1 and 2. Step 9 is tier 2, and it is what tier 3 learns from.
2.2 Five capabilities, seven functions, eight planes
The assurance article defined the layer by five capabilities. They remain the backbone of this one, and each is developed further in the sections that follow.
| # | Capability | Responsibility | Developed in |
|---|---|---|---|
| 06.1 | Ingestion and streaming | Move every signal from its source into a durable, replayable pipeline as it occurs; no loss of critical signals at peak, explicit and measured policies for the rest | Sections 3.1, 5.1, 5.2 |
| 06.2 | Semantic normalisation and identity reconciliation | Map every source onto common schemas and common meaning; resolve one entity from many keys | Sections 3.4, 4.3 |
| 06.3 | Temporal processing | Align clocks and windows, keep state, compute aggregates, sequences and joins continuously | Sections 3.2, 5.3 |
| 06.4 | Hot and historical storage, search and analytics | Serve recent state at the granularity of the fast loop; keep history at the depth of learning | Sections 5.4, 5.5 |
| 06.5 | APIs and visualisation | Expose the evidence to engines, agents, incident platforms and people through stable contracts | Section 5.6 |
The same layer is often drawn as seven functions, and this article works it in eight technical planes. The three views describe the same thing at different resolutions; the table below is the translation between them, with the tier each function belongs to.
| Function | Capability | Planes (section 4) | Tier |
|---|---|---|---|
| Massive ingestion and streaming | 06.1 | 1 Collect, 2 Durable log | 1 |
| Normalisation and enrichment | 06.2 | 3 Normalise and reconcile, 4 Process | 1 |
| Identity resolution | 06.2 | 3 Normalise and reconcile | 1 |
| Real-time processing and analytics | 06.3 | 4 Process | 1 |
| Hot and historical storage | 06.4 | 5 Serve hot (tier 1), 6 Persist history (tier 2) | 1 and 2 |
| APIs and data access | 06.5 | 7 Expose | 1 and 2 |
| Visualisation and exploitation | 06.5 | 7 Expose | 1 and 2 |
| Platform self-management | 06 with 09 | 8 Self-manage | 3 |
Working the layer in depth surfaces three responsibilities that the five capabilities imply but do not name. They are the ones operators most often discover after go-live, so this article treats them explicitly.
- Operational state, as distinct from analytics. “What share of sessions failed in the last five minutes?” is an analytical question. “Which instance is active, what is its current configuration and which topology version should the automation use?” is a question about state, with consistency requirements an analytical engine is not built to meet. The layer has to serve both, usually from different stores.
- Data quality and data observability. The layer must know when it is wrong: a source that went silent, a schema that changed, an identity that failed to resolve, a window that closed before late data arrived. The absence of data has to be distinguishable from the absence of a problem.
- Self-management of the platform. Compaction, clustering, retention, scaling and cost control are continuous work. They can increasingly be automated, but the automation of the data platform is itself a change process, with its own risk model, and it must not compete with the network for resources during an incident. Section 4.6 describes it as a governed loop.
2.3 What layer 06 is not
The boundaries matter as much as the scope, because most failed data programmes in operations failed by absorbing a neighbouring responsibility they could not carry. Five boundaries are worth stating at the outset.
- It is not the brain (02). A stream processor that finds that session failures rose after a deployment has found a correlation, not a cause. Diagnosis needs topology, domain knowledge and causal reasoning with a stated confidence.
- The engine is not the responsibility. The same Flink cluster may run calculations that belong to layer 06 — windows, aggregates, peer-group deviations, derived indicators — and detection logic that belongs to block 02. Sharing a platform does not merge the responsibilities: layer 06 is accountable for the correctness, freshness and availability of the computation; block 02 is accountable for what counts as an anomaly, the models and thresholds, the correlation and the probable cause.
- It is not the network model (07). The layer carries identities and change events to the graph and keeps the history the graph needs for point-in-time queries; the graph itself, its ontology and its traversals belong to layer 07.
- It is not the agent (08). The layer exposes evidence through contracts an agent can call. It does not decide what an agent may do with it.
- It is not its own governor (09). Access policies, autonomy limits and audit are specified in layer 09 and enforced by the layer, not invented inside it.
2.4 Beyond the 5G core: the sources of a convergent operator
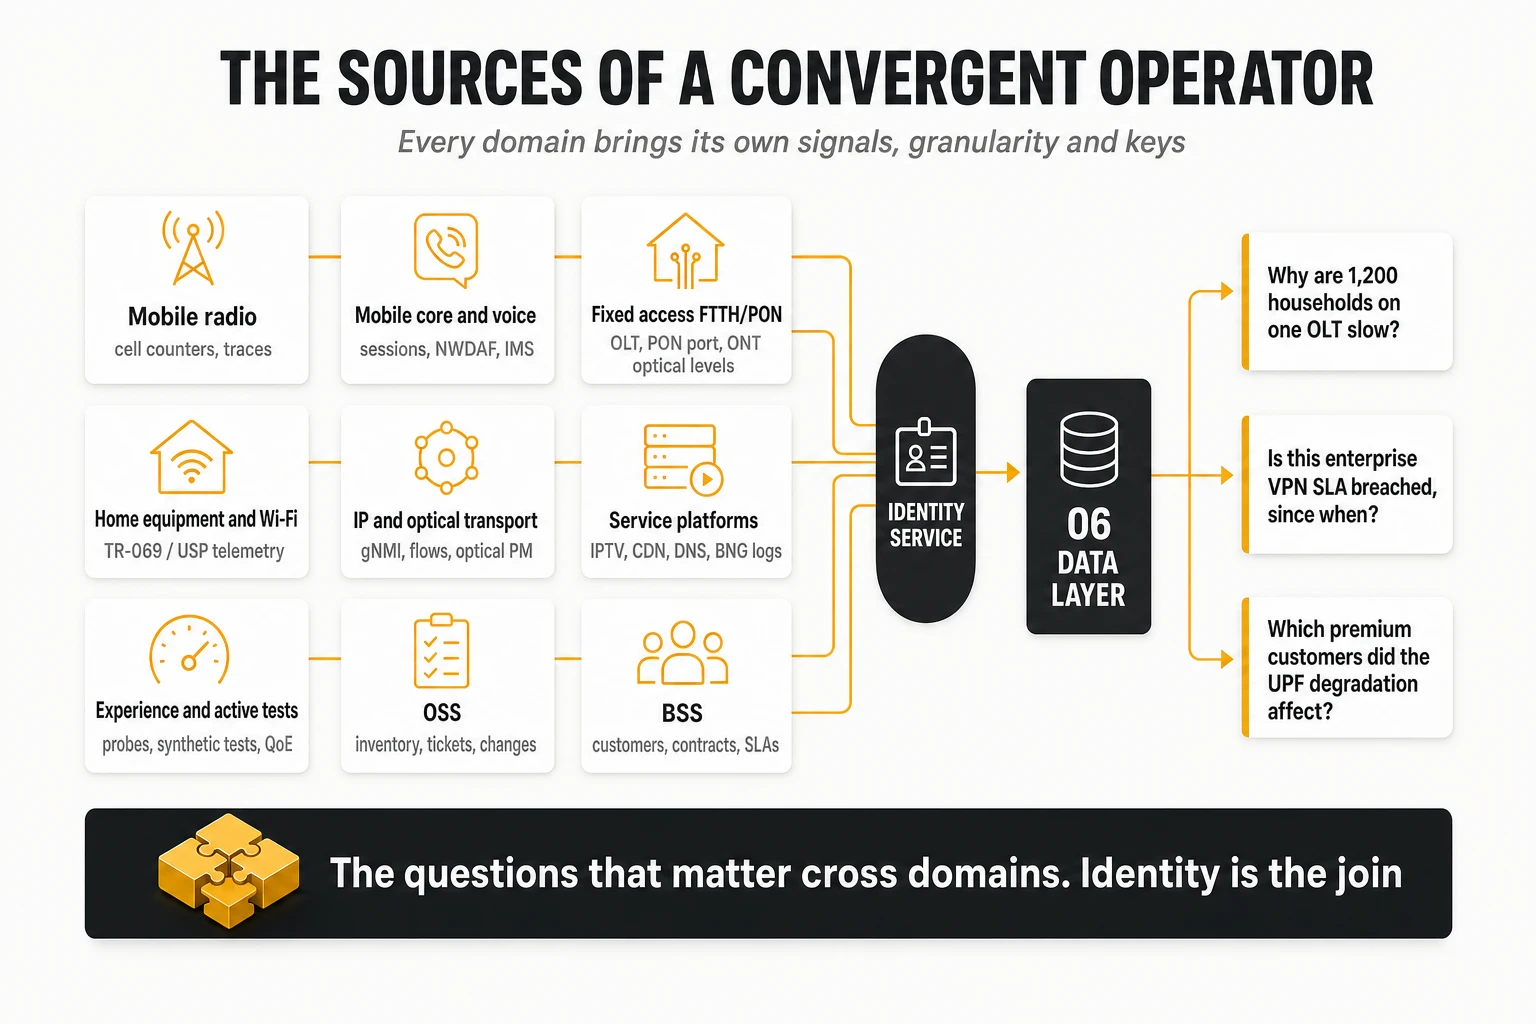
The examples in this article lean on the 5G core because its data problems are the most visible, but the layer has to serve the whole operator. A convergent operator runs mobile and fixed access, IP and optical transport, service platforms, home equipment and enterprise services, each with its own signals, collection methods and identity keys.
| Domain | Typical signals | Typical collection | Character of the data | Identities to reconcile |
|---|---|---|---|---|
| Mobile radio (RAN) | Cell counters, alarms, configuration, traces, interference and coverage measurements | Vendor management systems, performance files, streaming interfaces, O-RAN data services | Very high cardinality (cells, carriers, beams); 1–15-minute granularity | Cell global identity, vendor names, site, planning name |
| Mobile core and voice (5G/4G, IMS) | Function counters, session and signalling events, NWDAF analytics, call records | Vendor streaming, Kafka-native events, 3GPP collection functions, probes | High event rates; per-session and per-subscriber detail | Function instance, pod, slice, DNN, pseudonymised subscriber |
| Fixed access (FTTH/PON) | OLT and PON port counters, ONT optical levels, alarms, line state | Access management systems, NETCONF/YANG, SNMP, files | Millions of ONTs; slow-changing levels with sudden faults | OLT, PON port, splitter, ONT serial, household, customer |
| Home equipment and Wi-Fi | Router and Wi-Fi telemetry, connected devices, speed tests | TR-069 or TR-369 (USP) device management, vendor clouds | Per household; periodic and on demand | CPE serial, line, household, customer |
| IP and optical transport | Interface and queue counters, flows, routing state, optical performance | gNMI streaming, SNMP, IPFIX/NetFlow, BGP-LS, controllers | Sub-minute telemetry; large flow volumes | Device, interface, link, circuit, optical channel |
| Service platforms | IPTV, CDN, DNS, AAA/BNG, messaging and voice platform logs and metrics | Logs, metrics, platform APIs | Text-heavy logs plus metrics | Service instance, platform node, session |
| Experience and active tests | Probes, synthetic tests, application QoE, crowdsourced measurements | Probe platforms, test agents, partner feeds | Sampled; the strongest signal of customer impact | Test point, location, service, customer |
| OSS | Inventory, topology, faults, tickets, changes, orders | Database CDC, APIs, exports | State that changes slowly and must be point-in-time | Inventory references, ticket and change numbers |
| BSS | Customers, products, contracts, SLAs, segments | CDC, APIs, batch | Sensitive; slow-changing; essential for impact | Account, contract, service ID, customer segment |
The value of the layer appears when questions cross these domains. Three examples show the joins involved.
- Fixed access. “Why have 1,200 households on one OLT reported slow broadband since last night?” needs PON port and ONT optical levels, CPE and Wi-Fi telemetry, the inventory chain from OLT to splitter to ONT to household, the tickets opened and any change on the OLT — joined on reconciled access identities.
- Enterprise services. “Is this customer’s VPN SLA breached this month, and since when?” needs transport telemetry and active test results for the circuits, the service inventory that maps circuits to the customer’s service, the SLA terms from the contract in BSS, and the change history of the path.
- Mobile. “Which enterprise and premium customers were affected by the user plane degradation?” needs core and session data, the slice and DNN mapping, and the commercial segment — with subscriber identities pseudonymised and re-identified only through a controlled service.
2.5 Terms used in this article
The layer sits between two vocabularies, and readers usually know one of them better than the other. The terms below are used throughout; each is also explained where it first matters.
| Term | Meaning in this article |
|---|---|
| Durable log | A store of events in order, kept for a retention period, that many consumers can read and re-read independently. Kafka is the reference implementation |
| Stream processing | Continuous computation over events as they arrive: windows, aggregates, joins, pattern detection, with state kept between events |
| Event time, watermark | The time an event actually happened, and the processor’s running estimate of how complete the data is up to a given time |
| CDC (change data capture) | Publishing every insert, update and delete in a database as an event stream, so other systems stay current without bulk reloads |
| OLAP (online analytical processing) | Engines built for fast aggregation and filtering over large volumes of structured data, typically storing data by column |
| Lakehouse, open table format | Analytical tables stored as files on object storage, with metadata (Iceberg, Delta, Hudi, Paimon) that adds transactions, snapshots and schema evolution |
| Catalog | The service that records which tables exist, where their metadata is and who may access them |
| Data product | A dataset with an owner, a published schema and meaning, freshness and completeness objectives, access rules and lineage |
| ETL | Extract, transform, load: the classic batch pipeline that copies data between systems |
| Hot, warm, cold | The operational present, recent investigation and long-term history; responsibilities rather than products |
| UPF, PFCP | The 5G user plane function that forwards subscriber traffic, and the protocol the core uses to control it |
| NWDAF | The 5G network data analytics function, which collects data from network functions and produces standard analytics |
| DNN, slice | The data network a session connects to (the 5G equivalent of an APN), and a logical network with its own characteristics |
| IMSI, SUPI | Permanent subscriber identifiers in 4G and 5G; personal data |
| RIC, rApps | The O-RAN RAN intelligent controller and the applications that run on its non-real-time part |
| ITSM | IT service management: the incident, problem and change records, for example in ServiceNow |
3. The challenges, before the technology
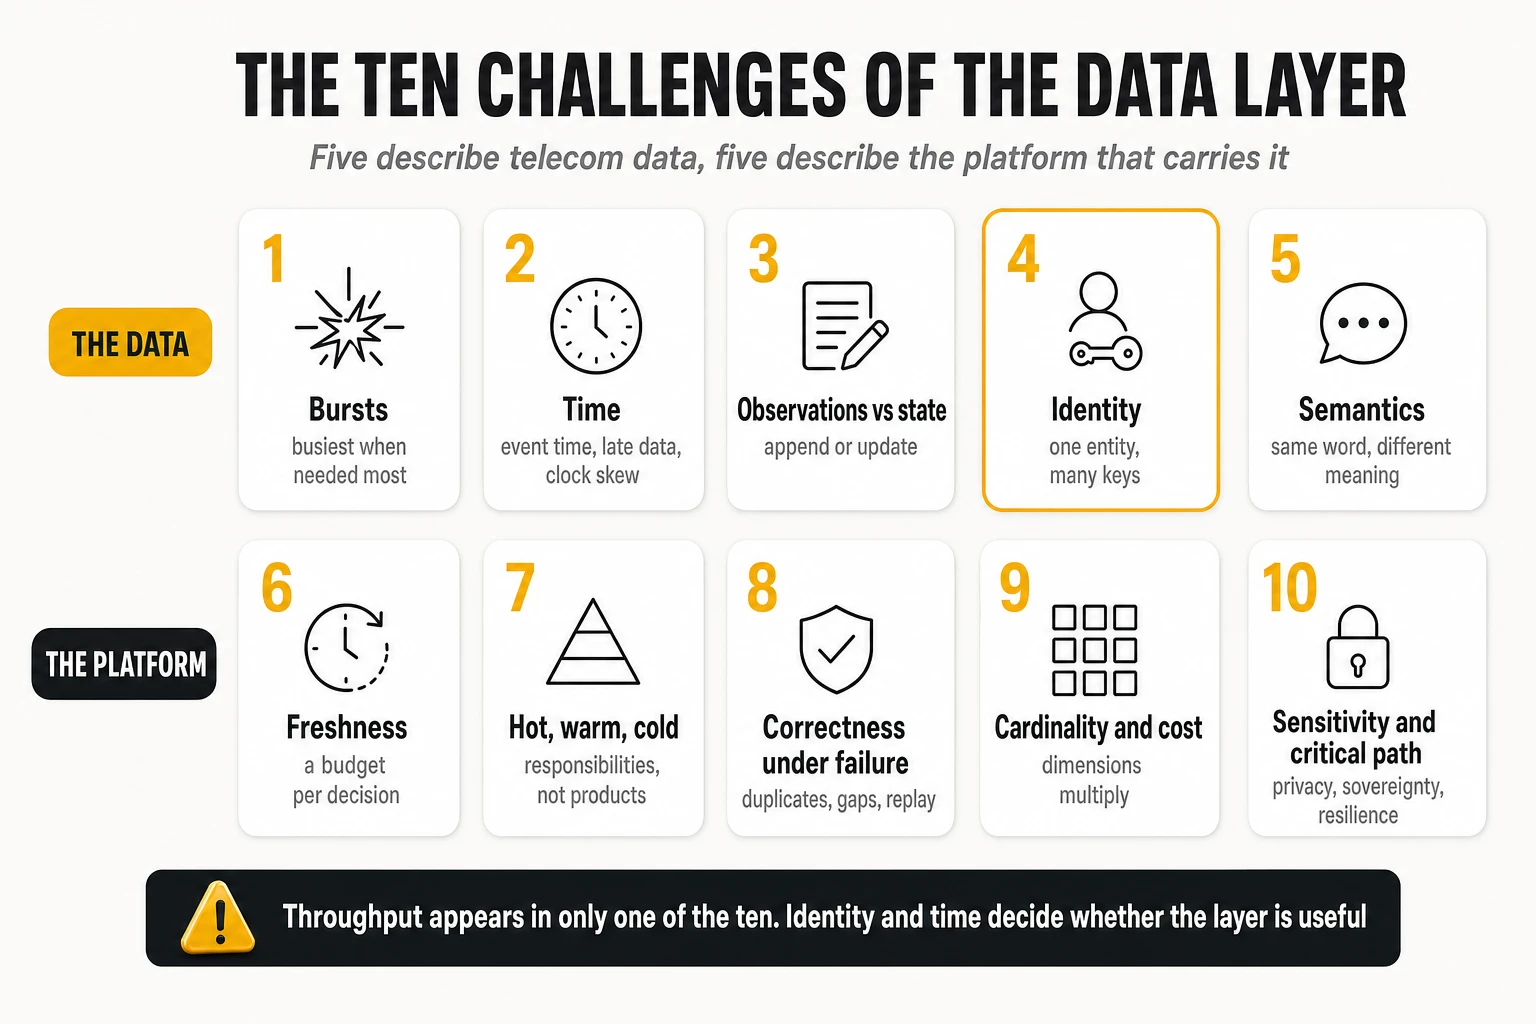
Most comparisons of data platforms start with engines. This one starts with the problems, because the problems are stable and the engines are not. Kafka, Flink and Iceberg will be on different major versions in two years; the fact that a 5G core emits events whose clocks disagree will not have changed. Ten challenges define the layer. The first five are about the nature of telecom data; the last five are about operating a platform that carries it.
3.1 Bursts: the platform is busiest when it is needed most
Telecom signal volume is not a steady flow with a peak; it is a steady flow with storms. A failure in an aggregation layer produces alarms from every element behind it, logs from every function that lost a peer, retries from every user equipment, and session state changes for every subscriber affected. The ratio between an ordinary busy hour and an incident minute is routinely one to two orders of magnitude for alarms and logs, and the incident minute is the one that matters.
Three properties follow, and each has to be designed in rather than tuned later.
- Absorption. The transport layer must buffer the burst durably — on disk or object storage, not only in memory — so that no consumer’s slowness causes producers to drop data. For critical signals this is a strict guarantee: no loss, at any rate the operator has planned for.
- Priority. Not every signal deserves the same lane. Alarms, heartbeats, change events and the counters the detectors depend on need a protected path; verbose debug logs can be delayed, sampled or shed first. A platform with a single undifferentiated pipe sheds the wrong data under pressure. Shedding non-critical telemetry is legitimate only when it is an explicit, documented policy, applied in a known order, and measured — so that every gap is visible afterwards rather than discovered during an investigation.
- Back-pressure with intent. When a consumer cannot keep up, the platform should slow it down, scale it out or degrade it deliberately, according to a written policy, rather than silently fall behind until the detectors are reading data from ten minutes ago.
The test is simple and rarely run: replay the worst incident of the last year at three times its original rate and measure loss, lag and query latency at the same time. Section 12 turns it into an acceptance criterion.
3.2 Time: event time, processing time and the clocks that disagree
An event has at least three timestamps: when it happened, when the source emitted it and when the platform processed it. In a distributed network they can differ by seconds or minutes: element managers batch alarms, counters arrive on fifteen-minute granularity periods, collectors buffer during congestion, and some sources stamp events with their own clock while others leave it to the receiver.
Correlating by arrival time produces false coincidences and missed ones. Two faults that occurred a minute apart can arrive together after a collector recovers; a cause can arrive after its effect. Stream processors such as Flink model this explicitly with event-time windows and watermarks — a running estimate of how complete the data is up to a given time — and with a policy for data that arrives after the window it belongs to has closed.
The design decisions that matter are policy, not technology.
- Which timestamp is authoritative for each source, and how clock quality is monitored (PTP or NTP status of the sources is itself a signal).
- How long a window waits for late data before emitting a result, per use case: a detector that must alert in seconds cannot wait for fifteen-minute counters, and a daily SLA report must.
- What happens to late data: discarded, emitted as a correction, or routed to a side output for reconciliation.
- Where ordering is guaranteed. Logs such as Kafka guarantee order within a partition, not across a topic. Keying by the entity whose sequence matters — the function instance, the cell, the session — is a modelling decision with consequences for scale.
A global order of all events in a distributed network does not exist, and an architecture that assumes it will produce confident wrong answers.
3.3 Two kinds of data: observations and state
Most telemetry is append-only: a counter value, a log line, a session record, the raising or clearing of an alarm. Each record is never updated; it is superseded by the next observation. Much of the context is state: the current version of a function, its placement, its administrative status, the current membership of a slice, the open change on an element. State is updated in place, and what matters is its latest value and, for investigations, its value at a given past moment.
Alarms show why the distinction matters. Every alarm event — raised, acknowledged, severity changed, cleared — is immutable and should be kept as such. The alarm itself, however, has a lifecycle, and “which alarms are active on this element now” is state reconstructed from those events. A design that stores only the events forces every query to replay the lifecycle; one that stores only the current state loses the sequence an investigation needs. Both are required, kept consistent by the same stream.
Engines are built for one or the other. Append-only data suits logs, columnar OLAP engines and time-series databases. Mutable state suits transactional and key-value stores, and — increasingly — table formats and OLAP engines with primary-key semantics that turn updates into an ordered changelog. Forcing state into an append-only store produces queries that have to reconstruct the latest value every time; forcing high-rate observations into a transactional store produces cost and contention.
The streaming lakehouse technologies discussed in section 5.5 exist largely because of this distinction — Apache Paimon, a table format designed for streaming updates, and Apache Fluss, a streaming storage system that tiers into such formats. They give state a native home in the same storage as history, with a changelog that downstream consumers can follow.
3.4 Identity: one entity, many keys
The same user plane function arrives from the orchestrator, the network repository function, the Kubernetes cluster and the inventory under four different keys. The same cell has a global identifier, a vendor-internal name, an inventory reference and a planning name. The same enterprise customer is an account in billing, a set of circuits in service inventory and a list of slices in the core. Nothing downstream — correlation, impact, verification — works until the layer knows these are one entity.
Identity reconciliation is the capability operators discover late and underfund most. It has three parts that should be designed separately.
- Resolution: matching the keys, deterministically where an authoritative mapping exists, probabilistically where it does not, with the confidence recorded.
- Propagation: carrying the resolved identity through the pipeline, so every event is enriched once, at ingestion or in the first processing stage, rather than re-joined in every query.
- Correction: re-resolving when sources disagree or change — a function rescheduled to a new pod, an inventory record fixed — and recording which version of the mapping each result used.
The measure is the share of an incident’s entities that were merged correctly without manual mapping. It is the most informative single number in the assessment of a data layer, and almost no vendor demonstration reports it.
3.5 Semantics: the same word, different meanings
Common fields are not common meaning. “Session establishment failure”, “drop”, “availability” and “latency” are computed differently by different vendors, releases and probes. A data layer that normalises formats but not semantics produces dashboards in which two regions served by two vendors are not comparable, and detectors whose baselines shift when a software release changes a counter definition.
Semantic normalisation needs an owned, versioned vocabulary. Standards help: 3GPP defines performance measurements for the 5G system in TS 28.552 and end-to-end KPIs in TS 28.554, and the management data analytics of TS 28.104 and the NWDAF analytics define standard outputs. They do not cover every vendor-specific counter, every probe metric or every enterprise service KPI, and the operator’s semantic layer has to close the gap, with the definition of each metric versioned alongside the data.
3.6 Freshness: a latency budget, not a latency figure
“Real time” is not a requirement; a latency budget per decision is. The end-to-end delay that matters is the time from the moment an observation is generated to the moment a decision can use it, and it has components that belong to different teams:
- capture at the source and the granularity period of the measurement;
- transport and buffering;
- waiting for late data before a window closes;
- normalisation, enrichment and identity resolution;
- the processing step that produces the result;
- the commit or refresh interval of the store that serves it;
- the query or evaluation that reads it.
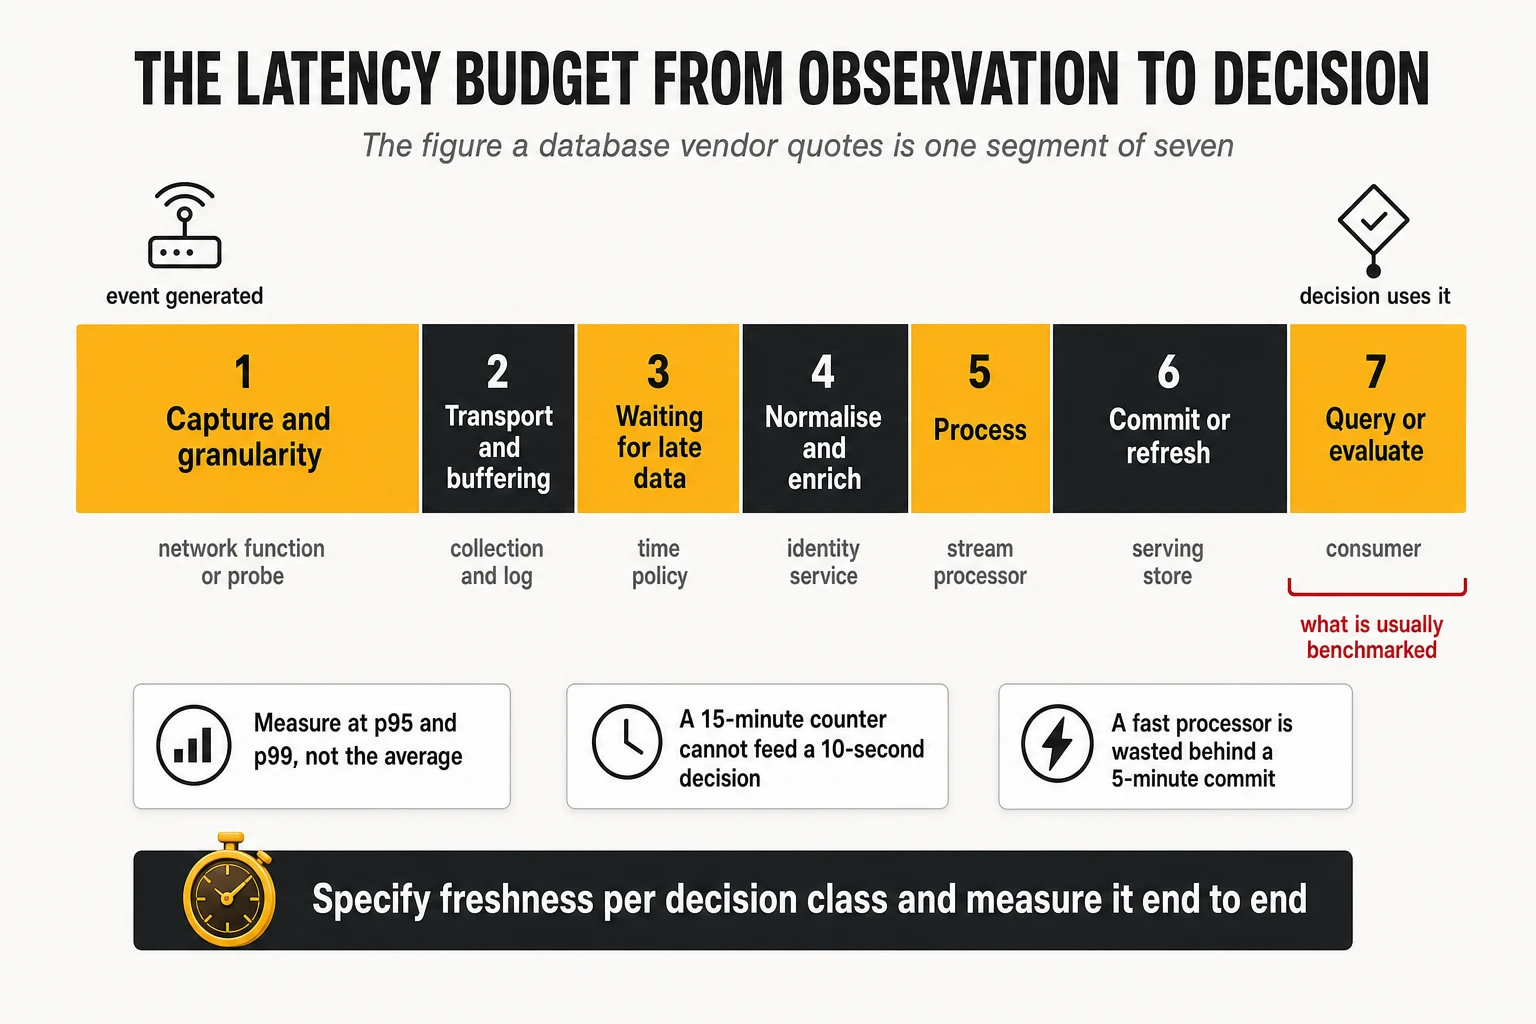
A sub-second database is irrelevant if the counter it serves has a fifteen-minute granularity period, and a fast stream processor is irrelevant if the table it writes becomes visible only when a commit runs every five minutes. The budget has to be specified per decision class and measured at the 95th and 99th percentiles, not as an average.
| Decision class | Typical consumer | Freshness that makes the decision useful | Dominant pattern |
|---|---|---|---|
| Protection and closed-loop control | Controllers, RIC applications, protection switching | Milliseconds to about a second; usually inside the network function or controller, not the data layer | In-network or edge processing |
| Detection and alerting | Anomaly detectors, correlation engines (02.1, 02.3) | Seconds to a minute | Stream processing computes the indicators; block 02 evaluates them |
| Investigation | Engineers and agents comparing entities (02.4, 08.1) | Data no older than a minute; interactive queries in under a few seconds | Real-time OLAP, search, time-series stores |
| Verification | Recovery checks after an action (05.1, 05.2) | Seconds to minutes, on the same metrics that detected the problem | Stream processing plus hot store |
| Reporting and SLA | Service management, customers, regulators | Minutes to hours; completeness matters more than speed | Lakehouse and warehouse |
| Learning | Model training, problem management, planning (05.4) | Hours to days; depth and reproducibility matter most | Lakehouse with snapshots |
The first row is a deliberate boundary. Decisions that must be taken in milliseconds — protection switching, radio scheduling, near-real-time RAN control — belong in the network function, the controller or the RAN intelligent controller, close to the source. A central data layer that tries to serve them adds risk without adding value. Its job is the second row downwards.
3.7 Hot, warm and cold: responsibilities, not products
A useful way to organise storage is by three horizons of use. The terms describe responsibilities, not three databases, and modern architectures increasingly serve more than one horizon from the same copy of the data.
- Hot — the operational present. Windows, state and aggregates that feed the detectors; recent observations at full granularity. Latency, burst absorption and recovery dominate.
- Warm — recent investigation. Hours to weeks of data that engineers and agents query interactively: compare five user plane functions, trace a degradation through the last six hours, line up changes and events. Concurrency, flexible queries and fresh data dominate.
- Cold — historical intelligence. Months to years of history, kept cheaply and reproducibly, for model training, recurrence analysis, capacity planning and the reconstruction of past incidents. Open formats, governance, reproducibility and cost per terabyte-year dominate.
The cost of the hot/warm/cold split is copies. Each horizon traditionally had its own store, and data moved between them through pipelines that duplicated it, delayed it and introduced inconsistencies. The most significant architectural change of the last three years is the attempt to collapse those copies: streaming logs that write directly into lakehouse tables, OLAP engines that query lakehouse tables in place, and table formats with streaming semantics. Section 5.5 assesses how far that attempt has succeeded.
3.8 Correctness under failure: duplicates, gaps and replay
Distributed pipelines deliver data at least once unless they are engineered to do better, and they lose data when they are engineered carelessly. Exactly-once processing is available end to end in specific combinations — Kafka transactions with Flink’s two-phase commit sinks, for example — but in practice most telecom pipelines are effectively-once: at-least-once delivery plus idempotent writes and deduplication by key.
Three capabilities are more important than the delivery guarantee on paper.
- Replay. The ability to reprocess a period from the durable log or from history, after a bug fix, a new detector or a corrected identity mapping, and get the same answer as if the fix had been there at the time.
- Backfill. The ability to load late or recovered data from a source that was disconnected, without corrupting aggregates that have already been published.
- Completeness tracking. Knowing, per source and per window, how much of the expected data arrived. A detector that sees no failures because the source stopped reporting is the most dangerous failure mode in the layer.
The absence of data must be distinguishable from the absence of problems. That single sentence justifies a whole capability — data observability — which section 11 places at the centre of governance.
3.9 Cardinality and cost
Telecom data is high-cardinality by nature. Per-cell, per-slice, per-DNN, per-subscriber and per-flow dimensions multiply quickly: a metric with a few labels can become millions of time series. Time-series databases price and perform by series count; OLAP engines by rows scanned; search engines by indexed volume; streaming logs by retained bytes and, in the public cloud, by the network traffic between availability zones.
Cost is therefore an architectural property, not a procurement outcome. Which dimensions are kept at full granularity and for how long; which are aggregated at the edge; which logs are indexed and which only stored; where replication crosses a zone or a region — these decisions are taken by engineers and appear later as invoices. The streaming market’s move towards object storage, described in section 5.2, is driven as much by the cost of inter-zone replication as by any technical elegance.
3.10 Sensitivity, sovereignty and the critical path
Network data is personal data more often than network teams assume. Session records, location-bearing measurements, IMSI- or SUPI-keyed events and per-subscriber quality metrics fall under data protection law, lawful-interception rules and, for many operators, sector-specific security codes. The European NIS2 directive (Directive (EU) 2022/2555) and its implementing acts add risk management and incident obligations on the systems that operate the network, which include the data layer that observes it.
Three design consequences follow.
- Minimise and pseudonymise at ingestion, so that downstream analytics and agents work on tokens and only a controlled service can re-identify.
- Decide residency deliberately: which data can leave the country or the operator’s premises, and which must be processed at the edge or on sovereign infrastructure.
- Protect the critical path. Detection and verification must keep working, within stated objectives, when the lakehouse, a public cloud region, a catalog service or the dashboards are unavailable. A data layer whose detection path depends on the availability of the analytics estate has made the least critical component a single point of failure for the most critical one.
4. A reference architecture for the layer
The ten challenges translate into eight functional planes. They are functions, not products: one product can cover several planes, and one plane is often served by more than one product. Naming them separately is what lets an operator see which plane a vendor proposal actually covers and which it leaves to integration.
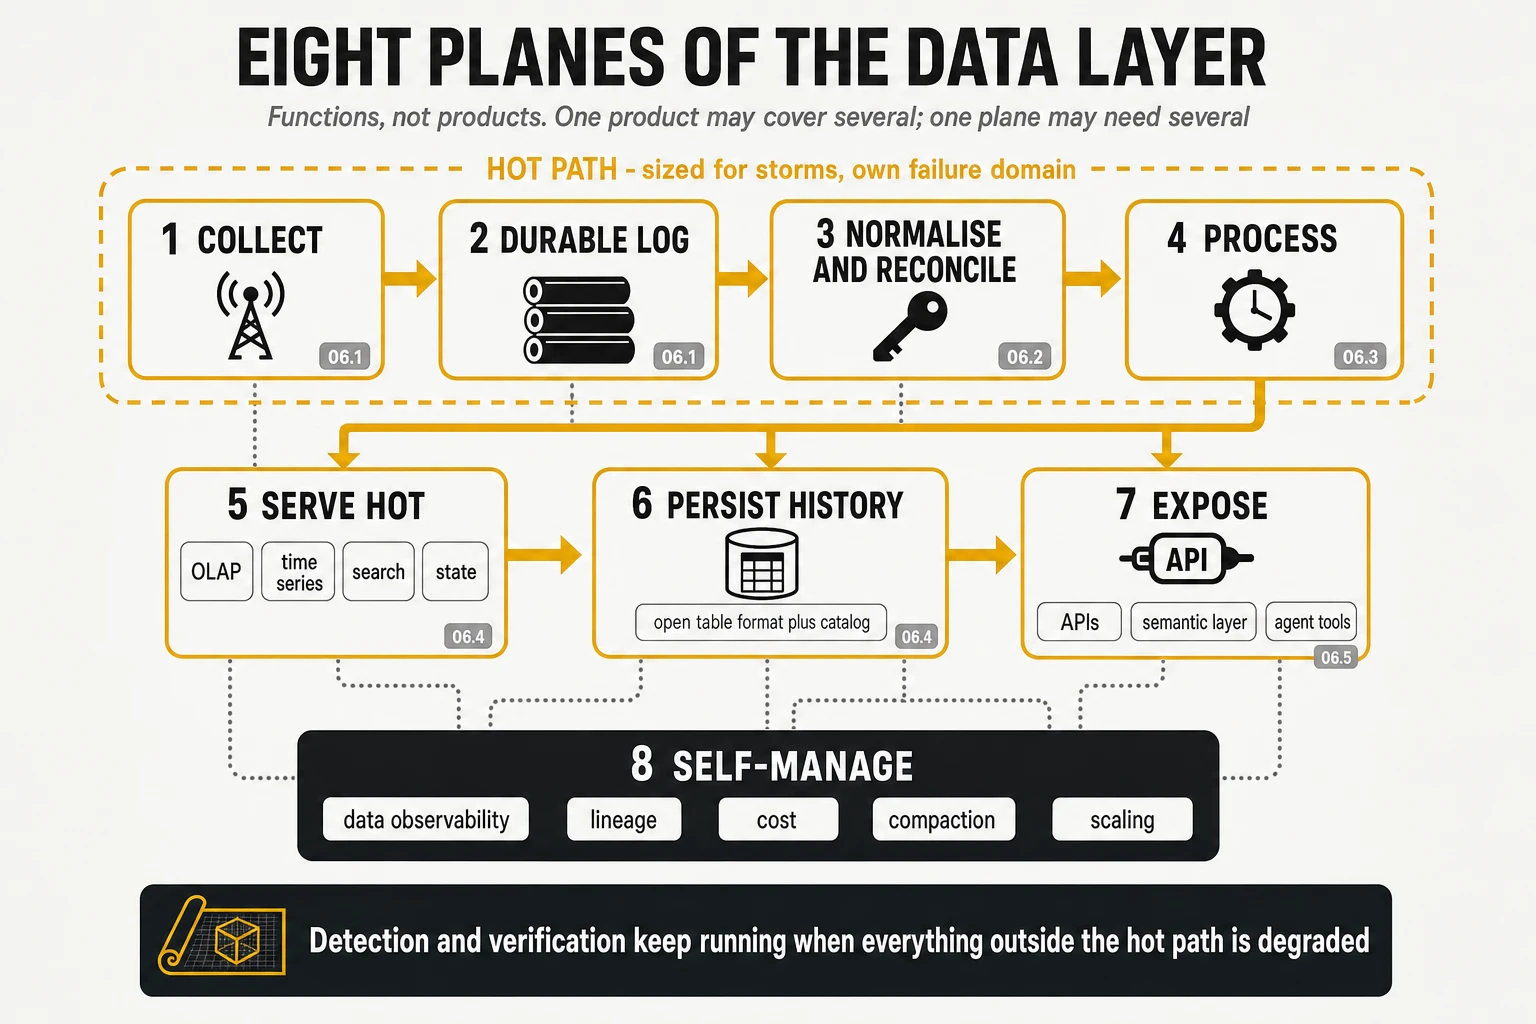
| Plane | Function | Capability | Key design question |
|---|---|---|---|
| 1. Collect | Pull or receive signals from network functions, element managers, probes, controllers, clouds and IT systems | 06.1 | Which protocols and granularities, and where is data reduced? |
| 2. Durable log | Buffer, order per key, retain and distribute events to many consumers; allow replay | 06.1 | Retention, partitioning key, priority lanes, inter-zone cost |
| 3. Normalise and reconcile | Map to common schemas and semantics; resolve identities; pseudonymise | 06.2 | Where identity is resolved, and who owns the mapping |
| 4. Process | Windows, state, aggregates, sequences, joins, enrichment, feature computation | 06.3 | Event-time policy; state size; recovery time |
| 5. Serve hot | Interactive queries over recent data: OLAP, time series, search, operational state | 06.4 | Freshness, concurrency, update model |
| 6. Persist history | Open table format on object storage with a governed catalog | 06.4 | Format, catalog ownership, compaction and retention |
| 7. Expose | APIs, semantic layer, query federation, tool interfaces for agents, dashboards | 06.5 | Stable contracts; access control; agent access |
| 8. Self-manage | Data observability, lineage, quality, cost control, optimisation, scaling | 09 with 06 | What is automated, when, and under which change controls |
4.1 Three tiers: operate, investigate and learn, evolve
The planes are organised in the three tiers introduced at the start, and the tiers decide priority, resilience and investment order.
| Tier | Purpose | Planes and parts of planes | Must keep working when | Typical first investments |
|---|---|---|---|---|
| 1 — Operate in real time | Supply detection, verification and the operations centre with fresh, resolved, trustworthy indicators | 1 Collect; 2 Durable log; 3 Normalise and reconcile; 4 Process (indicators); 5 Serve hot (verification, screens, recent investigation); 7 Expose (detector and incident interfaces) | The lakehouse, BI, a cloud region or the catalog are unavailable | Storm-proof log, identity service, indicator pipelines, hot store, freshness monitoring |
| 2 — Investigate and learn | Turn evidence into understanding: interactive investigation, history, point-in-time context, reporting, model training | 5 Serve hot (interactive analytics); 6 Persist history; 7 Expose (BI, federated query, agent tools) | It may fall behind during an incident and catch up from the log | Lakehouse in an open format, temporal context, semantic layer, data product APIs |
| 3 — Evolve into an intelligent platform | Make the platform adapt and make its data usable by AI agents under control | 8 Self-manage; agent-facing parts of 7; the learning loop over 6 | It is suspended or throttled during incidents by policy | Data observability, governed optimisation, agent tool contracts, labelled incident history |
4.2 The hot path and the rest
The most important line in the architecture is the one around the hot path. Collection, the durable log, the first normalisation and enrichment step, the stream processing that computes the indicators detection depends on, and the hot store used for verification are the critical path — tier 1. They must be sized for storms, deployed with their own failure domains and able to run when everything else is degraded. Everything else — the lakehouse, batch transformations, model training, dashboards, reporting — is important but deferrable: it can fall behind during an incident and catch up afterwards from the durable log.
Two consequences are frequently missed. First, the hot path should not depend on a catalog service, a metadata store or an identity mapping that is only available from the analytics estate; it needs a local, cached copy that tolerates their absence. Second, reprocessing and backfill jobs must not share capacity with the hot path, or a well-intentioned replay after an incident becomes the next incident.
4.3 Where identity and semantics are resolved
Identity and semantics should be resolved once, as early as practical, and carried. Resolving them in every query multiplies cost and produces inconsistent answers; resolving them only in the lakehouse means the detectors work on unresolved data. The usual pattern is an enrichment stage in the stream processor, immediately after the log, that joins each event with a reference table of identities and topology, kept current from the inventory and the orchestrators through change data capture. Events enter the log keyed by a stable source identifier — the only key available before resolution — and, once enriched, are re-keyed by the resolved entity for the processing that needs per-entity order.
Where that reference table lives is an engineering choice with consequences. Small tables can be broadcast to every stream processing task and kept in its state; larger ones are usually held in a low-latency key-value store — Redis or Valkey are the common choices — that the processor queries for each event and that operational screens also read for the “latest state” of an entity. That store is fast, but it is a cache of the present: it holds no history, so it cannot answer what an identity or a relationship was an hour ago, and it must be rebuilt from the change stream if it is lost. Its contents should therefore be treated as a projection of authoritative sources, not as a source of truth.
That reference table is the bridge to the graph in layer 07. It holds keys and the most frequently needed relationships — function to host, cell to site, slice to customer — not the whole model. Deep traversals stay in the graph; the enrichment stage needs only what every event needs. Section 8 develops the division.
4.4 Four patterns, and why the debate has moved on
Data architecture has argued for a decade about how batch and streaming should relate. Four patterns now coexist, and an operator’s layer 06 will usually contain more than one.
- Lambda: a streaming path for speed and a batch path for correctness, reconciled later. It works, and it doubles the logic. Most operators have one by accident.
- Kappa: one streaming path; history is reprocessed by replaying the log. It removes the duplication and makes the log the system of record, at the cost of long log retention and careful state management.
- Streaming lakehouse: the stream processor writes continuously into open lakehouse tables that support updates and changelogs; the same tables serve batch, interactive and incremental streaming reads. It is the pattern behind Apache Paimon and Apache Fluss and, in different forms, behind the real-time tiers of the large data platforms.
- Shift-left and zero-copy: the streaming platform itself materialises topics as lakehouse tables, or analytical engines read operational sources without a pipeline. It reduces the number of copies, and it moves responsibility for data quality towards the producers.
The debate has moved from “batch or streaming” to “how many copies, in which formats, governed by whom”. That is the frame used to assess the technologies in section 5.
4.5 Data products: the unit of governance
The unit an operator governs should be the data product, not the pipeline or the table. A data product is a dataset with an owner, a published schema and meaning, an objective for freshness and completeness, access rules and a lineage — for example “user plane function performance, per instance, per minute”, “cell availability with resolved site identity”, or “change events normalised across all domains”.
Thinking in data products resolves three recurring arguments. It decides who fixes a broken counter definition (the product owner, not the platform team). It makes freshness a published commitment rather than a hope. And it gives agents and incident platforms a catalogue of things they are allowed to call, which is what the exposure plane — plane 7 above — is built on. Section 11 turns this into the first of the master keys.
4.6 Self-management: a governed loop, not autoscaling
A platform that scales is not the same as a platform that adapts. Autoscaling adds capacity when a metric crosses a threshold. A self-managing data platform observes its own load, cost and data quality continuously, proposes changes to how it runs, checks them against policy, applies them in a controlled way, verifies the effect and learns from it. The difference is the policy and the verification, and both are what make the automation acceptable in an operations-critical system.
The loop has six steps.
- Monitor load, lag, freshness, query patterns, storage growth, small files and cost per data product.
- Recommend an optimisation: rebalance partitions, add or remove processing capacity, change a compaction schedule, re-cluster a table, move data to a cheaper tier, postpone a heavy job.
- Validate against policy: is the change allowed now, for this tier, within the budget, outside a declared incident, and within the change-risk class that may be automated?
- Execute under control: staged, reversible, through the platform’s own change process, never competing with tier 1 for resources.
- Verify the effect on freshness, cost and query latency against what was predicted; roll back if it is worse.
- Learn: record the outcome so that the next recommendation is better calibrated, and so that the policy can be widened for change classes with a good record.
Concrete examples make the difference visible.
- Partition rebalancing when one source’s keys concentrate load on a few partitions after a network reconfiguration.
- Processing capacity scaled out ahead of a known traffic event — a major sports final, a national holiday — from calendar signals, not only from lag.
- Compaction and clustering rescheduled to off-peak periods and suspended during incidents, as the managed optimisation services of the large platforms now do on lakehouse tables.
- Storage policies changed from observed access patterns: data products that nobody queries after seven days moved to colder, cheaper storage earlier.
- Deferral of non-critical work — reprocessing, model training, large reports — automatically when an incident is declared, and resumed afterwards.
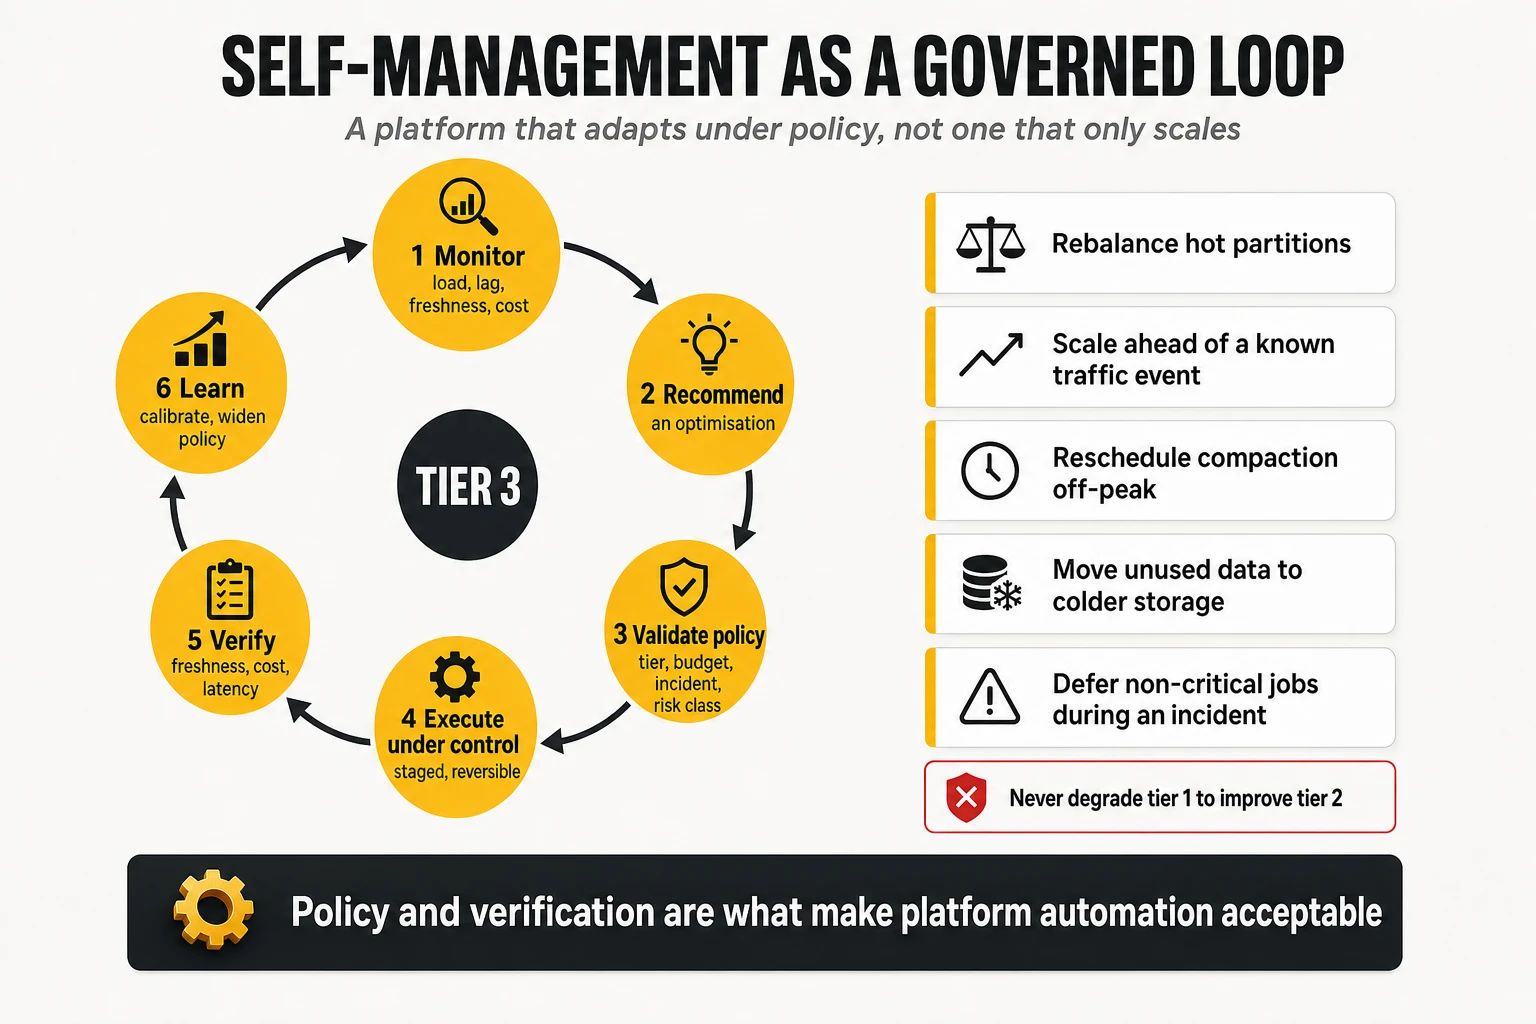
This is tier 3, and it carries a different risk model from network autonomy. Optimising a compaction schedule and changing a network function that carries traffic are not comparable decisions. The platform’s automation should be governed by the same principles as any other — policy, authorisation by risk class, audit — with its own, usually more permissive, thresholds, and with one non-negotiable rule: it must never degrade tier 1 to improve tier 2.
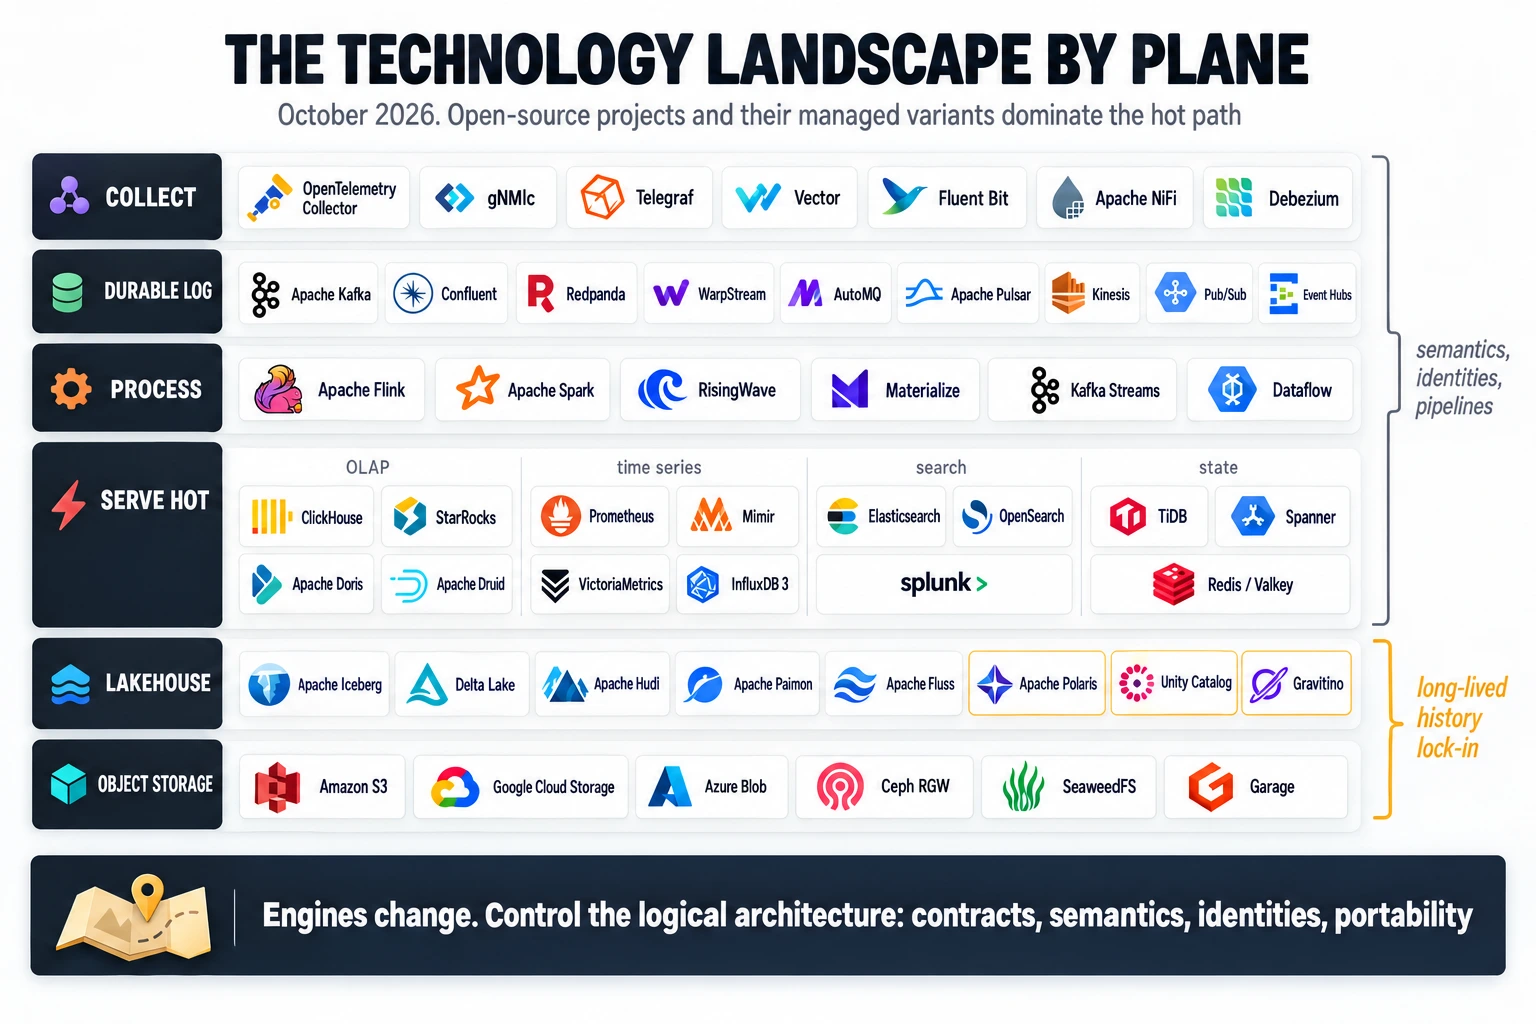
5. The technologies, plane by plane
The market for each plane has changed more in the last two years than in the previous five. Kafka has dropped ZooKeeper and agreed to store topics on object storage; Flink can now keep its state off local disks; Spark has a real-time mode; lakehouse formats have gained deletion vectors, variants and streaming-native siblings; the largest independent streaming vendor has been bought by IBM; and the most widely used open-source object store for on-premises lakehouses has stopped being maintained. This section goes through the planes in order and says, for each, what the options are, what changed and what an operator should verify.
Two reading notes. First, each subsection starts with the principle and then gives the state of the market; versions and dates are a snapshot of October 2026 and will age, while the principles should not. Second, technologies that appear side by side in a table are not equally mature. The classification below is the one used throughout.
| Maturity in 2026 | Meaning | Examples |
|---|---|---|
| Established | In production at telecom scale for years; broad skills market; predictable operations | Kafka (broker-disk mode), Flink, Spark batch and micro-batch streaming, Elasticsearch and OpenSearch, Prometheus, ClickHouse, Redis, Iceberg and Delta for batch history, S3-compatible object storage, Ceph |
| Maturing | Production use growing, fewer telecom references; evaluate with care | StarRocks, Doris, Druid and Pinot in telecom, Pulsar, Paimon, Hudi, RisingWave and Materialize, Kafka share groups, Spark real-time mode, Iceberg REST catalogs (Polaris, Unity Catalog OSS), object-storage-native Kafka implementations |
| Emerging or experimental | Recently released, not yet shipped, or marked experimental by its own project; pilot before committing | Kafka diskless topics (agreed, not shipped), Flink disaggregated state (ForSt), Fluss (1.0 in September 2026), Iceberg v3 features across engines and v4, SQL model inference and vector search inside stream processors, agent tool access to data platforms |
5.1 Collection and integration
Collection is where telecom specificity is highest and product glamour lowest. Signals arrive over SNMP, file transfer of performance measurement files, vendor streaming interfaces, gNMI and gRPC telemetry, syslog, Kafka-native function events, probe feeds, Kubernetes APIs, cloud monitoring APIs and change data capture from inventories and order systems. No single collector handles all of them, and the design objective is not one collector but one contract at the point where data enters the durable log.
Four families of collectors are relevant.
- Telemetry agents and pipelines. The OpenTelemetry Collector has become the default for cloud-native metrics, traces and logs; traces and metrics are stable in most language SDKs, logs are stable in some and still maturing in others, and a profiles signal entered public alpha in March 2026. Vector, Fluent Bit and Telegraf cover log and metric shipping with lower footprints. Prometheus 3.0 added a native OTLP receiver, which narrows the gap between the two metric worlds.
- Network telemetry collectors. gNMIc, contributed by Nokia to OpenConfig, subscribes to model-driven telemetry and can fan one subscription out to Kafka, NATS, InfluxDB and Prometheus outputs at once. It is the practical bridge between routers and optical equipment that stream gNMI and a Kafka-based backbone.
- Flow-based integration. Apache NiFi reached 2.0 in November 2024, with Python processors and a new interface, and was at 2.12 in September 2026. It is strong at moving and transforming data between heterogeneous systems, files and legacy OSS interfaces, with provenance tracking. Snowflake’s Openflow, generally available since May 2025, is a managed NiFi. NiFi is an integration tool, not a stateful stream processor, and should not be asked to do Flink’s job.
- Change data capture. Debezium and Kafka Connect, and Flink CDC for pipelines that go straight into lakehouse tables, capture inventory, order and configuration changes from relational databases as event streams. They are how the graph and the enrichment reference tables stay current.
Telecom standards are building their own data collection planes, and the operator’s layer should integrate them rather than duplicate them.
- 3GPP data management framework. Release 17 added the Data Collection Coordination Function (DCCF), which collects once from network functions and serves many analytics consumers; the Messaging Framework Adaptor Function (MFAF), which connects that collection to an external messaging bus; and the optional Analytics Data Repository Function (ADRF), which stores collected data and analytics. They extend the NWDAF architecture in TS 23.288. For the operator, the MFAF is a natural point of contact between the 5G core’s own collection and the enterprise streaming backbone.
- O-RAN data management and exposure. In the service management and orchestration framework, the Data Management and Exposure (DME) services collect, store and expose RAN data to rApps through the R1 interface, specified in documents published by ETSI as TS 104 228. Overlap with 3GPP exposure work has been flagged by the standards bodies themselves.
- ETSI ZSM. The zero-touch service management architecture separates data services — domain data collection and cross-domain data services — from the management applications that consume them, which is the same separation this article argues for.
Telecom-specific DataOps products sit across this plane. Elisa Polystar’s Kalix DataOps positions itself as the integration, automation and governance layer for network and OSS data, replacing legacy ETL, and was part of a framework agreement signed by Ooredoo Group in February 2026 covering Qatar, Kuwait and Tunisia. Products of this kind earn their place in the parsers, vendor counter models and identity mappings they bring; the operator should verify whether those assets are exportable.
5.2 The durable log: Kafka, its successors and its rivals
The durable log is the heart of the hot path, and Kafka’s protocol has become its de facto standard. The open-source project itself has changed substantially.
- Kafka 4.0, released in March 2025, is the first major release to run entirely without ZooKeeper, with KRaft — Kafka’s own built-in consensus for cluster metadata — as the only metadata mode, which removes a separate cluster to operate, and a new consumer rebalance protocol generally available.
- Tiered storage, which moves older log segments to object storage, was declared production-ready in Kafka 3.9, making long retention for replay economically realistic.
- Queues for Kafka — share groups, which let many consumers process a topic cooperatively without partition assignment — became production-ready in Kafka 4.2 in February 2026. For operations workloads it simplifies work-queue patterns such as enrichment calls or ticket creation that previously needed a separate message broker.
- Kafka 4.3, released in May 2026, continued hardening tiered storage.
- Diskless topics. KIP-1150 was accepted in March 2026: the community agreed that topics can store their data directly in object storage, without broker disks or inter-broker replication. It is a direction, not yet a feature: the implementation proposals were still under discussion and no Kafka release contained diskless topics in October 2026.
The driver of the diskless movement is cost, specifically the network. In a public cloud deployment across three availability zones, every byte written is replicated to two other zones and often read from a third. Confluent’s own analysis estimated that multi-zone networking is likely over 50% of Kafka infrastructure cost, rising towards 90% once tiered storage has reduced storage cost; on AWS, traffic between zones is charged at one cent per gigabyte in each direction. Writing to object storage, which replicates across zones without per-gigabyte transfer charges, removes most of that line at the price of higher write latency — typically hundreds of milliseconds rather than single-digit milliseconds.
A generation of Kafka-compatible systems already ships that trade-off.
| System | Approach | Status and ownership | What to weigh |
|---|---|---|---|
| Apache Kafka | Broker disks plus tiered storage; diskless agreed, not shipped | Apache project; 4.3 in May 2026 | The reference; inter-zone cost in public cloud |
| Confluent Platform and Cloud | Kafka with Tableflow, managed Flink, governance | Acquired by IBM, closed March 2026, about $11 billion | Roadmap under IBM; integration with watsonx.data and IBM’s integration portfolio |
| WarpStream | Stateless agents writing directly to object storage, bring-your-own-cloud | Acquired by Confluent in 2024, now IBM | Higher latency; data stays in the operator’s cloud account |
| Redpanda | C++ Kafka-compatible engine; Cloud Topics on object storage; Iceberg topics | Release 26.1, March 2026; Cloud Topics need an enterprise licence | Vendor claims over 90% less inter-zone replication cost for latency-tolerant topics |
| AutoMQ, Bufstream, Aiven Inkless | Kafka-compatible on shared or object storage | AutoMQ Apache 2.0; Bufstream commercial; Inkless as Aiven’s implementation of KIP-1150 | Maturity, compatibility coverage and support model; vendor-modelled savings |
| Apache Pulsar and StreamNative Ursa | Separate serving and storage (BookKeeper); multi-tenancy, geo-replication; Ursa as lakehouse-native Kafka-compatible engine | Pulsar 4.1, September 2025, 4.0 as long-term support; Ursa GA on AWS in 2025 | Smaller ecosystem; strong multi-tenancy for shared platforms |
| Cloud-native services | Amazon Kinesis Data Streams and MSK, Google Pub/Sub and Managed Kafka, Azure Event Hubs | Managed; Kinesis On-demand Advantage cut usage prices by 60% in November 2025; MSK Express brokers offer up to three times the throughput per broker | Simplicity versus portability; egress and inter-region cost |
| NATS JetStream | Lightweight messaging with persistence | CNCF project | Edge and device messaging rather than central telemetry backbones |
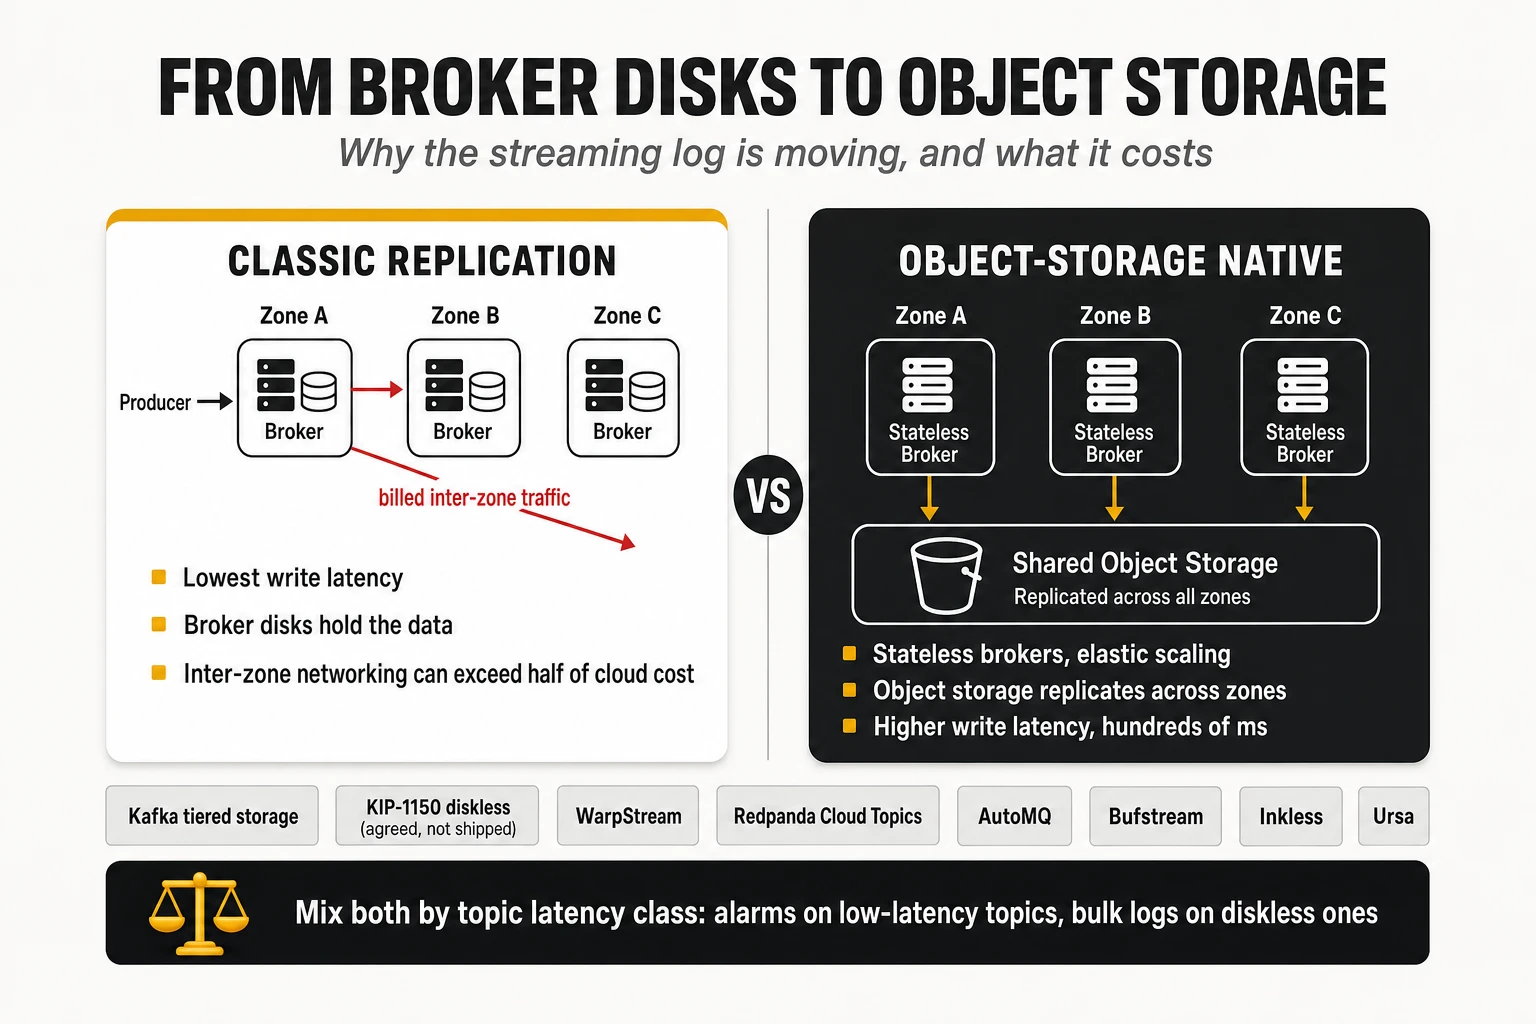
For an operator, the choice is less about the engine than about three parameters. First, where the log runs: on-premises telco cloud, where inter-zone traffic is not billed and broker disks remain economical, or public cloud, where the object-storage designs change the economics. Second, which latency class each topic belongs to: alarms and detector inputs need low-latency topics; bulk logs and session records can tolerate diskless ones, and mixing the two classes in one cluster is now a legitimate design. Third, the ownership trajectory: the consolidation of Confluent and WarpStream into IBM, and the number of start-ups competing on the same protocol, make the Kafka protocol a safer commitment than any single implementation.
Public telecom evidence for this plane is real but mostly vendor-published. BT Group describes a Kafka-based common event broker that carries network events into its service management platform under a 99.999% availability requirement. It is a typical pattern: the log as the neutral junction between network sources and operations systems.
5.3 Stream processing: Flink, Spark and the streaming databases
Stream processing is where events become information: windows, aggregates, joins, sequences, enrichment, features and derived indicators. When detection logic runs on the same engine, it remains a block 02 responsibility executed on layer 06 infrastructure. Three families of engines compete, and they suit different teams as much as different workloads.
Apache Flink: the stateful reference
Flink remains the reference for stateful, event-time processing at scale, and its 2.x line has repositioned it for cloud and AI workloads.
- Flink 2.0 (March 2025) introduced disaggregated state management: state can live primarily in remote or distributed file systems through the new ForSt backend, which shortens recovery and rescaling for jobs with large state. It also removed the DataSet API and legacy source and sink interfaces, so upgrades from 1.x are migrations, not version bumps.
- Flink 2.1 (July 2025) added model definitions and ML_PREDICT for inference from SQL, a VARIANT type for semi-structured data, and delta and multi-way joins that reduce the state held by large streaming joins.
- Flink 2.2 (December 2025) added VECTOR_SEARCH in SQL and extended materialized tables, in which the user declares a query and a freshness and Flink maintains the result.
- Flink 2.3 (June 2026) added changelog conversion functions, richer materialized tables and watermark alignment fixes for backlog processing.
Maturity varies across those features, and managed services lag the open-source releases. AWS’s documentation for Flink 2.3 on Managed Service for Apache Flink describes the ForSt disaggregated state backend as experimental in open source and not supported on the service, and does not support materialized tables either. An operator should treat disaggregated state as a roadmap item to test, not a production assumption, in 2026.
Flink’s event-time model is the reason it fits telecom data. Watermarks, allowed lateness and side outputs for late data implement the time policies of section 3.2 directly, and its complex event processing (CEP) library expresses event sequences — “a configuration push, then a rise in session failures within ten minutes on the same function” — as patterns.
Telecom usage is documented at scale. Bouygues Telecom is listed on the Flink project’s users page with about 30 production applications processing 10 billion raw events per day. China Unicom described at ApacheCon Asia 2023 a Flink platform handling 2.3 trillion records and more than 600 TB per day. Both are self-reported figures from conference and project material, not audited measurements.
Apache Spark: one engine for batch, streaming and now low latency
Spark’s case in layer 06 is breadth: one engine and one skill set for large-scale batch transformation, model feature preparation and streaming. Its Structured Streaming model has traditionally been micro-batch, with latencies of seconds. That changed in two steps.
- Open-source Spark 4.1 (December 2025) introduced a real-time mode for stateless, single-stage queries from Kafka, with per-record processing; the open-source documentation lists aggregations, deduplication, stream-stream joins and arbitrary state as not yet supported. Spark 4.2 (July 2026) extended it to PySpark.
- Databricks made its real-time mode generally available in March 2026, including stateful processing, with customer-reported latencies below 100 milliseconds at the 99th percentile and a vendor claim of being faster than Flink on feature computation in its own tests.
The practical reading is that the latency gap between Spark and Flink has narrowed for simple pipelines, and the gap in event-time semantics and large-state management has narrowed less. An operator whose data engineering already runs on Spark can now meet the detection row of the freshness table with it for many pipelines; an operator with complex event-time correlation, large keyed state and multi-stream joins will still find Flink the more natural tool. The decision should be taken on the operator’s own pipelines, not on either vendor’s benchmark.
Streaming databases: SQL that stays current
A third family offers incrementally maintained SQL views: write a query once and the system keeps the result current as data arrives. For operations teams with strong SQL skills and modest state requirements, they shorten the path from question to running pipeline.
- RisingWave, at version 2.8 in 2026, is PostgreSQL-compatible and reads and writes Iceberg, which places it naturally between the log and the lakehouse.
- Materialize focuses on strong consistency of incrementally maintained views, with a free community edition capped in memory and disk.
- Feldera applies an incremental computation model to arbitrary SQL with explicit lateness handling.
- Arroyo, a Rust stream processor, was acquired by Cloudflare in April 2025 and underpins Cloudflare Pipelines.
- Kafka Streams remains the simplest option for processing embedded in Java services that already live next to Kafka.
| Need | Natural fit | Why |
|---|---|---|
| Event-time correlation across sources, large keyed state, sequences | Flink | Watermarks, state backends, CEP, mature exactly-once sinks |
| One engine for batch, ML features and moderate-latency streaming | Spark (open source or Databricks) | Shared code and skills; real-time mode for low-latency stateless and, on Databricks, stateful paths |
| Continuously maintained SQL views for investigation and dashboards | RisingWave, Materialize, Feldera; Flink materialized tables | Declarative; fast time to value; smaller operational surface |
| Simple per-service enrichment and routing | Kafka Streams | No separate cluster |
| Managed pipelines in a single cloud | Dataflow, Managed Flink, Fabric Eventstreams | Operational simplicity; cloud coupling |
5.4 Hot serving: four kinds of store for four kinds of question
The hot serving plane is where the “one engine” temptation is strongest and most costly. Four workloads have different physics: aggregation over structured telemetry, time-series metrics at high cardinality, search over text, and operational state with consistency requirements.
Real-time OLAP: aggregation over fresh, structured data
Columnar real-time OLAP engines answer the investigator’s questions — which elements degraded most in the last hour, how five thousand cells compare by vendor and software release, what changed between two regions — over billions of rows in seconds, with data a few seconds old.
- ClickHouse is the most widely adopted engine in this class for event and telemetry analytics. It raised a Series D at a $15 billion valuation in January 2026 and, after acquiring HyperDX in 2025, packages ClickStack — an OpenTelemetry collector, ClickHouse and a user interface — as an open observability stack. The best-documented telecom case is Grupo MásMóvil, now part of MasOrange, which moved radio access network counters from about 10,000 nodes, close to 3 TB a day, onto ClickHouse, reporting sixteen times less disk, ten times less CPU and memory, retention extended from 15 days to a year at 15-minute granularity, and KPIs available about 15 minutes after collection instead of about three hours.
- StarRocks emphasises joins, high concurrency and frequent updates through primary-key tables, and queries lakehouse tables in place. Version 4.0 (October 2025) and 4.1 (April 2026) strengthened its shared-data mode on object storage and Iceberg writes. It can union-read fresh data in Fluss with history in Paimon in a single query.
- Apache Doris, from the same lineage, added vector indexes and hybrid vector and full-text search in version 4.0.
- Apache Druid and Apache Pinot remain strong for high-concurrency, time-oriented slice-and-dice over streams, with Druid at release 37 in April 2026.
The selection criteria are the update model, joins, concurrency and how the engine reaches the lakehouse. Append-heavy telemetry favours ClickHouse’s merge-tree model; workloads mixing state updates, multi-table joins and lakehouse federation favour StarRocks or Doris. Both patterns can be valid in one operator.
Time-series stores: metrics at high cardinality
Metrics from cloud-native functions and infrastructure live naturally in the Prometheus ecosystem, and the question is how to scale it. Prometheus itself reached 3.0 in November 2024. For long-term, multi-tenant storage, Grafana Mimir 3.0 moved to Kafka-based ingest storage that separates the read and write paths — a sign of the durable log becoming the spine of observability products themselves. VictoriaMetrics offers a lighter-weight alternative; InfluxDB 3 became generally available in April 2025 on a columnar engine with an embedded Python processing engine; and TimescaleDB continues as a PostgreSQL extension under a company renamed Tiger Data in 2025.
The decisive design parameter is cardinality, not throughput. Per-subscriber or per-flow labels belong in OLAP or the lakehouse, not in a time-series store priced and sized by active series.
Search: text-heavy evidence
Logs, traces, error messages and event text need search, and search engines remain the right tool for exploratory investigation over them.
- Elasticsearch added the AGPL as an open-source licence option in August 2024, and its ES|QL language has gained joins and time-series commands. Verizon Wireless describes an Elastic deployment ingesting more than 4 TB of logs and about 10 billion events a day, with mean time to resolution for the use cases covered falling from 20–30 minutes to 2–3 minutes — a vendor-published figure without a date.
- OpenSearch, now governed by the OpenSearch Software Foundation under the Linux Foundation, reached 3.9 in September 2026.
- Splunk, now part of Cisco, can run federated searches over Iceberg tables in Amazon S3, so that bulk log history can live in the operator’s lakehouse while Splunk remains the search and detection interface. Devo is a cloud-native log analytics platform whose main market is security operations; where an operator already runs it for the security operations centre, sending network events and KPIs to it as well gives the network and security teams one evidence base — provided the division of work with the other log platforms is explicit.
- The observability lakehouse is a visible trend: Snowflake acquired Observe, which reads and writes Iceberg so that telemetry lands in the customer’s own object storage, and ClickStack follows a similar open-format logic.
Many operators end up with two log and event platforms — one bought for security, one for network operations — and that is not necessarily a mistake. It becomes one when the split is not written down. A workable division gives each platform a defined population of data and users (for example, security events and the security operations centre on one; network logs and the operations centre’s investigations on the other), publishes the shared data products once to the durable log so both can consume them, and avoids computing the same KPI in both. Without that division, the operator pays twice to ingest the same data, and the two platforms eventually disagree about the same incident.
The test from the assurance article applies here unchanged: search and aggregation analytics are different workloads. An operator that forces both onto one engine pays in latency, in cost or in both. Search platforms that add correlation and detection features also have to be assessed twice — as stores, and as candidates for the brain in block 02, where they compete on different criteria.
Operational state: the store the automation trusts
The current configuration of an instance, the active topology version, the state of an open change and the outcome of the last automated action need a store with transactional consistency and high availability, not an analytical engine. Options include distributed SQL databases — TiDB, whose 8.5 long-term support line is maintained to 2030, Google Spanner, CockroachDB and YugabyteDB — and key-value stores such as Redis, Valkey and Aerospike for low-latency lookups.
Key-value stores deserve a specific warning, because they are often in the estate already. Redis and Valkey are excellent for the lookups the hot path needs — the reference table for enrichment, the latest value of a KPI for a screen, deduplication keys, rate limits — at sub-millisecond latency. They are caches of the present: they keep no history, their persistence is a recovery aid rather than a record, and their contents should always be rebuildable from the durable log or the authoritative source. They are the right home for “what is true now, fast”; they are the wrong home for anything an investigation or an audit will need to read as it was.
Licensing has moved in both directions and should be checked per component. CockroachDB retired its free core edition in November 2024; ScyllaDB moved to source-available from 2025; Redis added the AGPL as an option in Redis 8 in 2025, after the Linux Foundation’s Valkey fork had become an established alternative. Spanner, which also hosts Spanner Graph, added a columnar engine for analytical scans, generally available in 2026, which narrows the gap between operational state and analytics inside one database.
The rule from section 3.3 is the selection criterion. These stores are chosen when their consistency and availability guarantees are needed for state that automation acts on, not to hold telemetry.
5.5 The streaming lakehouse: formats, catalogs and object storage
The lakehouse plane is where the most durable technical decisions of layer 06 sit. Engines can be replaced in months; history in a format, governed by a catalog, on an object store, stays for years. Durable is not the same as sufficient, as the catalog discussion below makes clear.
Open table formats
Apache Iceberg has become the format most engines read and write, and its specification is advancing quickly. Iceberg 1.10 (September 2025) made the v3 specification usable — deletion vectors for efficient row-level deletes, row lineage, a variant type for semi-structured data, geospatial types and default column values — and 1.12 (September 2026) began shipping parts of v4. Engine support for v3 features is uneven, and an operator should check each engine against the features it intends to use.
Delta Lake reached 4.0 in September 2025, with variant support, coordinated commits and UniForm, which exposes Delta tables to Iceberg readers. Apache Hudi 1.1 (November 2025) added a pluggable table format framework and Flink 2.0 support. The three formats increasingly interoperate at the metadata level, which lowers, but does not remove, the cost of choosing.
Two Apache projects target the streaming problem of section 3.3 directly.
- Apache Paimon is a lakehouse format designed for streaming writes and updates, with primary-key tables organised as log-structured merge trees and changelog production for downstream consumers. It reached 2.0 in August 2026 and 2.1 in October 2026. It can expose its tables to Iceberg readers, with a caveat that matters operationally: Iceberg readers of primary-key tables see only fully compacted data, so freshness depends on the compaction schedule.
- Apache Fluss is streaming storage for real-time analytics: columnar, Arrow-based, with primary-key tables and log tables, designed to sit beside the lakehouse and tier data into it. It graduated to a top-level Apache project and released 1.0 in September 2026, with tiering to Paimon, Iceberg, Lance and Hudi. Its union read merges the sub-second data held in Fluss with the history already tiered to the lake in one query; tiering itself is described as minute-level.
| Technology | What it is | Problem it addresses | Maturity signal in 2026 | Caveat |
|---|---|---|---|---|
| Apache Iceberg | Open table format | Interoperable history, snapshots, schema evolution | Broadest engine and catalog support; v3 usable since 1.10 | v3 feature support differs by engine |
| Delta Lake | Transactional table format | Reliable lakehouse tables, strong Spark and Databricks integration | 4.x; UniForm for Iceberg readers | Richest feature set inside the Databricks ecosystem |
| Apache Hudi | Table format with record-level indexing | Upserts and incremental processing | 1.1; pluggable formats | Smaller engine ecosystem than Iceberg |
| Apache Paimon | Streaming lakehouse format | Updatable tables and changelogs with Flink | 2.x; Iceberg-compatible metadata | Freshness for Iceberg readers tied to compaction |
| Apache Fluss | Streaming storage tiered to the lake | Sub-second state and logs, unified with history | 1.0; top-level project since 2026 | Young operational ecosystem; verify recovery and tooling |
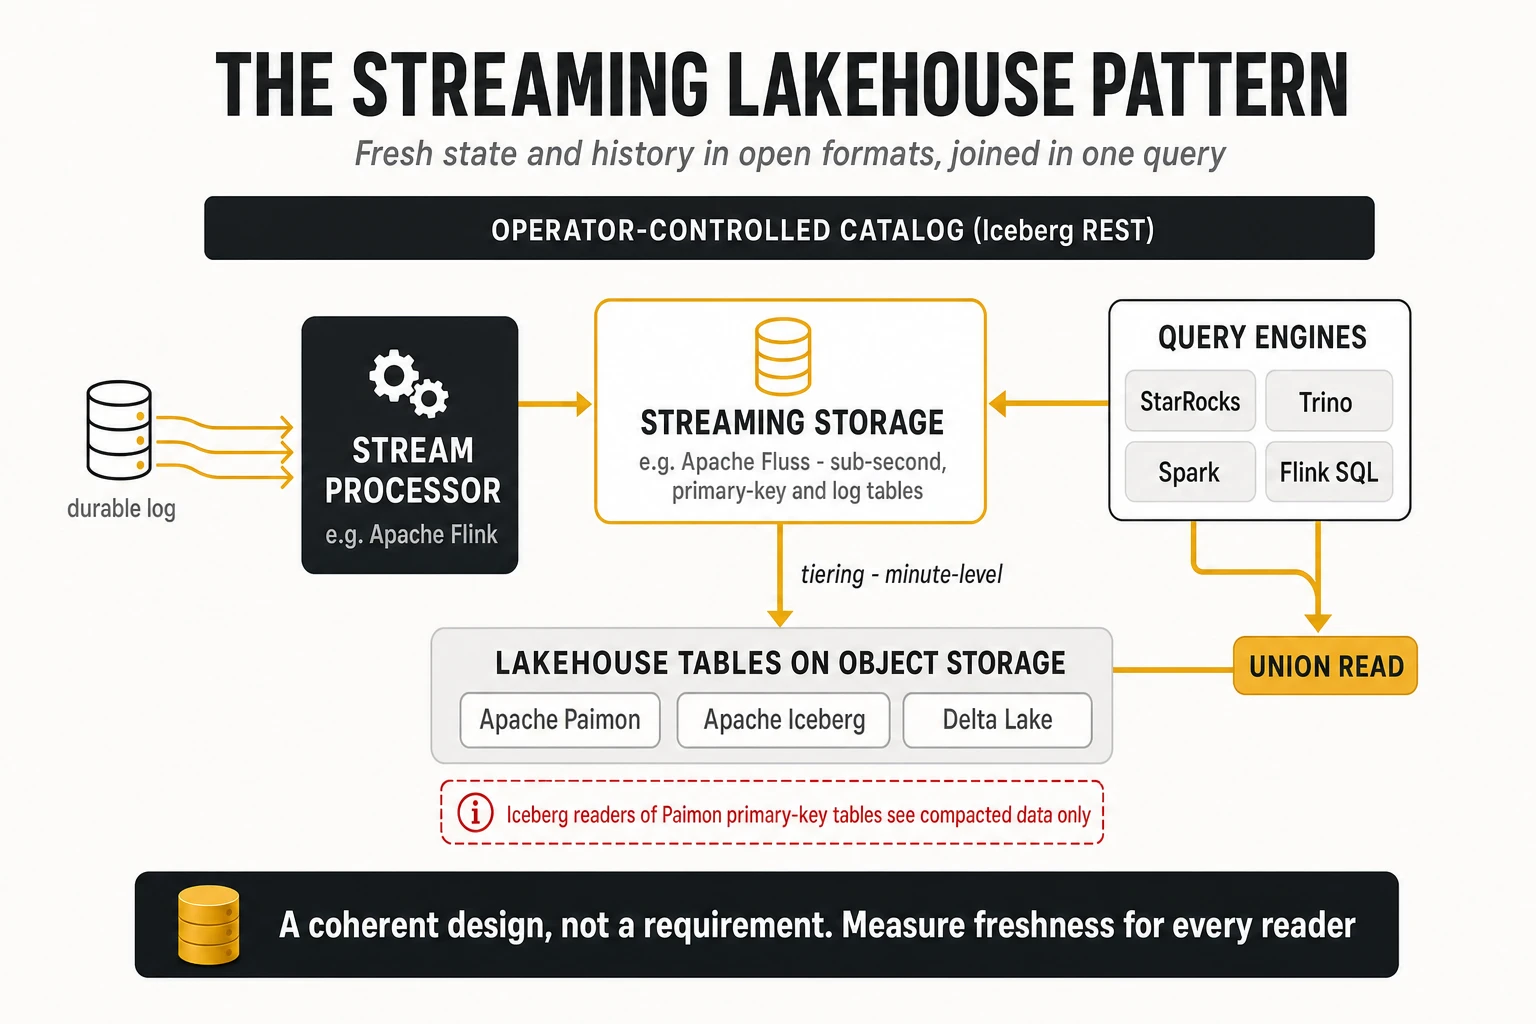
The image of a “hot layer” of Paimon and Fluss over a “cold layer” of Iceberg describes a coherent design, not a requirement. It fits an operator that runs Flink on the hot path and wants state and history in open formats. An operator whose hot serving is ClickHouse or Druid, and whose history is Iceberg written by Spark, has an equally coherent design. What matters is that each format solves a problem the others do not, that freshness is measured end to end and that compaction, snapshot expiry and small-file management are owned.
Catalogs: the new control point
The catalog — the service that knows which tables exist, where their metadata is and who may access them — has become the control point of the lakehouse. Whoever controls the catalog controls access policies, lineage and, in practice, which engines can participate.
- Apache Polaris, an Iceberg REST catalog originally contributed by Snowflake, graduated to a top-level Apache project in February 2026.
- Unity Catalog is Databricks’ governance catalog, with an open-source version under the Linux Foundation that exposes the Iceberg REST interface; Apache Gravitino federates metadata across sources; Lakekeeper is a lightweight Iceberg REST catalog.
- Cloud catalogs — AWS Glue and S3 Tables, which manage Iceberg tables with automatic maintenance and now support v3 types; Google’s BigLake; Microsoft’s OneLake — are convenient inside each cloud.
- Consolidation continues: SAP acquired Dremio, a major Iceberg and Polaris contributor, in 2026.
The governance recommendation is to run, or contract explicitly, a catalog that speaks the Iceberg REST protocol and is not captive to the operator’s primary query engine. It is the cheapest insurance an operator can buy against lock-in of its history.
It is not insurance against lock-in of the whole layer, and the distinction matters. A lakehouse catalog governs tables. It does not govern the Kafka topics and their schemas, the identity service and its mappings, the data held in the hot operational stores, the semantic definitions of KPIs, the pipelines that compute the indicators, or the APIs and tools through which detectors and agents read evidence. Those are where most of an operator’s operational knowledge lives, and they are just as capable of being trapped in one product. Governing the ecosystem therefore means controlling the logical architecture: a data product catalogue that spans streams, hot stores and the lakehouse; schemas and contracts in an operator-controlled registry; the semantic model and identity service as operator assets; pipelines kept as code the operator can run elsewhere; and portability tested, not assumed. The open format and the independent catalog are the part of that control that applies to history.
Object storage: the floor everything stands on
In public cloud, object storage is a utility. On-premises — in the telco cloud estates where much network data must stay for sovereignty, latency or cost reasons — it is a component the operator must choose and operate, and that choice has just become more consequential.
MinIO, the most widely used open-source S3-compatible store for on-premises lakehouses, has left open-source development. During 2025 the community edition lost its administration console, then its published binaries, and in December 2025 it entered maintenance mode; the GitHub repository is archived and points users to the commercial AIStor product. Operators with MinIO in their estates need a plan: a commercial subscription, or migration to an alternative such as Ceph RGW, the most mature open-source option at telecom scale; SeaweedFS, lighter and fast for many small objects; or Garage for smaller geo-distributed deployments.
The lakehouse’s performance and cost depend on object-storage behaviour that is easy to overlook. Small files from frequent streaming commits multiply metadata operations; compaction rewrites data and consumes the same storage bandwidth that queries need; and retention policies only reduce cost if snapshot expiry and orphan-file cleanup actually run.
5.6 Exposure: APIs, semantics, agents and screens
The exposure plane is the one every consumer is built against, and the one least often designed. It has six components, and it serves four kinds of consumption that should not be confused.
- Data product APIs: documented, versioned operations over the hot stores and the lakehouse, with access control and quotas, used by detectors, incident platforms, automation and agents.
- A semantic layer: definitions of metrics, dimensions and entities shared by dashboards, APIs and agents, so that “availability” means one thing everywhere.
- Federated query: engines such as Trino, Dremio or the warehouses’ external tables, for investigations that span stores. Useful for exploration; risky as a production dependency of the hot path.
- Tool interfaces for agents: tool definitions published through the Model Context Protocol or equivalent, mapped one to one onto data product APIs, as discussed in section 8.5.
- Visualisation: Grafana for operational dashboards, Superset, Power BI and Tableau for business intelligence, and the consoles of assurance products. They are consumers of the layer, not part of its backbone. Two business intelligence tools in one operator are common and tolerable if both read the same semantic layer; without it, each tool ends up with its own definition of the same KPI.
- Operational systems: the ITSM platform that opens and updates tickets, the orchestrators and the incident platforms of blocks 03 and 04. They consume detections and evidence through the same contracts, and they write back events — tickets opened, actions taken — that should flow into the durable log like any other source.
The four ways of consuming the layer have different requirements, and putting them on the same engine with the same permissions is a common source of incidents.
| Consumption | Who | Freshness and response | Typical engines | Access and isolation |
|---|---|---|---|---|
| Real-time operations centre screens | NOC and service operations staff | Seconds-old data; screens refreshing every few seconds; predictable load | Hot store and cache, time-series store; Grafana or assurance consoles | Read-only; pre-defined queries; protected capacity in tier 1 |
| Interactive incident investigation | Engineers during and after incidents | Data up to a minute old; ad hoc queries answered in seconds; bursts during incidents | Real-time OLAP, search, time-series; graph for context | Broad read access to recent evidence; workload isolation from screens and detectors |
| Analytical exploitation | Service management, planning, finance, reporting, SLA | Minutes to hours old; completeness over speed; heavy scans | Lakehouse and warehouse through a semantic layer; Power BI, Tableau, Superset | Governed datasets; row and column security; never on tier 1 stores |
| AI agent queries | Investigation and operations agents | Same as investigation; many small queries; bursts | Data product APIs over hot stores, lakehouse and graph; retrieval over incident history | Tool contracts, quotas, purpose-based permissions, provenance on every answer |
In practice the tools combine by tier. Operational dashboards in Grafana or the assurance product’s console read the hot stores and the cache through pre-defined, tested queries. Investigation uses the analytical and search engines directly, with workload limits. Business intelligence tools such as Power BI and Tableau read the lakehouse or warehouse through the semantic layer, never the stores the detectors depend on. Agents use the same data product APIs as people, with tighter quotas and an audit trail.
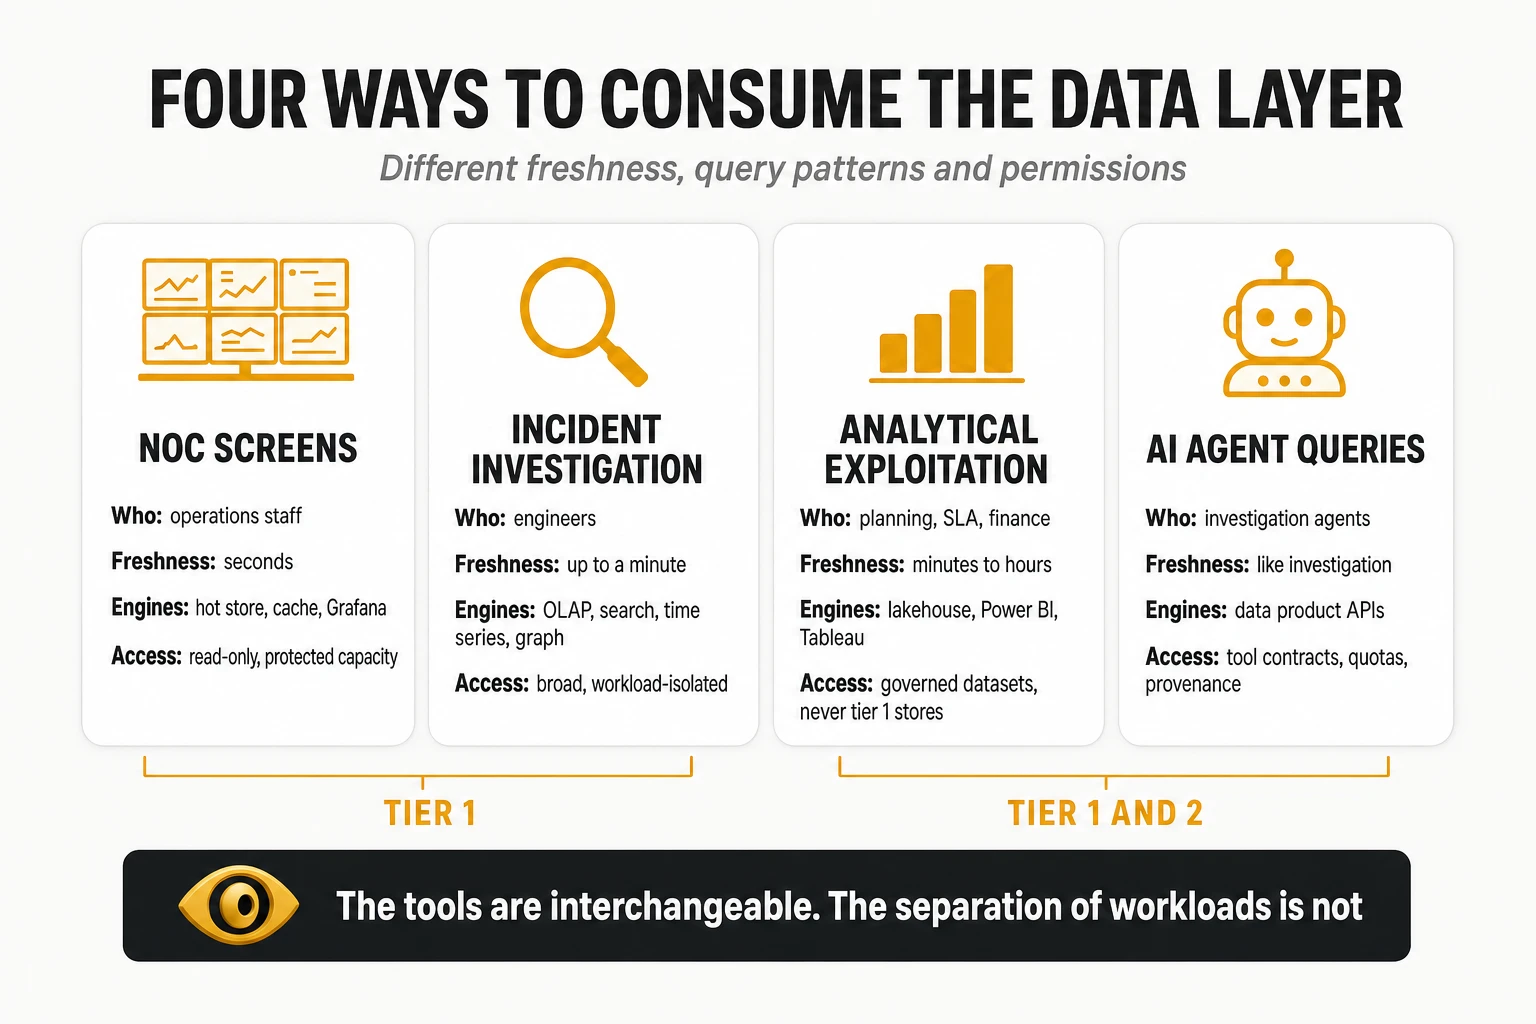
Vector search is becoming part of this plane as agents need retrieval over incident history, runbooks and configuration. It now appears inside many of the stores already discussed — Doris, Elasticsearch and OpenSearch, Flink’s VECTOR_SEARCH, the Lance format that Fluss tiers to, and Amazon S3 Vectors — which argues for adding retrieval to existing data products rather than building a separate vector estate.
5.7 Section 5 in one table
The plane-by-plane analysis reduces to a default per plane and the conditions under which to deviate from it. The defaults are TelcoCrux recommendations for a large operator in 2026, not the only valid choices.
| Plane | Tier | Sensible default | Deviate when | Verify first |
|---|---|---|---|---|
| 1. Collect | 1 | OpenTelemetry Collector for cloud-native, gNMIc or Telegraf for network telemetry, CDC for inventories; integrate 3GPP and O-RAN collection functions | A telecom DataOps product already covers vendor parsers and counter models | Exportability of parsers and mappings |
| 2. Durable log | 1 | Kafka protocol, low-latency topics for alarms and detector inputs | Public cloud with high inter-zone cost: object-storage-native topics for bulk data | Loss and lag at three times the worst storm |
| 3. Normalise and reconcile | 1 | Enrichment stage in the stream processor; reference tables fed by CDC; operator-owned identity service | Rarely; this is where the operator’s knowledge lives | Identity resolution rate on real incidents |
| 4. Process | 1 | Flink for event-time correlation and large state; Spark where the data engineering estate is Spark | SQL-first teams: streaming databases or materialized tables for investigation views | Recovery time of the largest stateful job |
| 5. Serve hot | 1 and 2 | Real-time OLAP for aggregation, Prometheus-compatible store for metrics, a search engine for text, a transactional store for state, a key-value cache for lookups | Small estates can merge OLAP and search on one engine with workload isolation | Query latency under concurrent load and ingestion |
| 6. Persist history | 2 | Iceberg on object storage with an operator-controlled REST catalog | Databricks-centred estates: Delta with UniForm; Flink-centred: Paimon or Fluss for streaming tables | The exit test: read history from a second engine |
| 7. Expose | 1 and 2 | Versioned data product APIs, a shared semantic layer, agent tools mapped onto the APIs | — | Agents and incident platforms reach evidence without bespoke code |
| 8. Self-manage | 3 | Data observability, lineage and automated compaction under change control | — | Silence detection and freeze during incidents |
6. The platforms and the vendors: what each one brings to layer 06
Most operators will not assemble layer 06 only from open-source components. They already own a corporate data platform, run one or more hyperscaler relationships, and operate telecom assurance products that carry their own data estates. The strategic question is not which platform has the longest feature list, but which role each one should play in the eight planes — and which roles it should not be given.
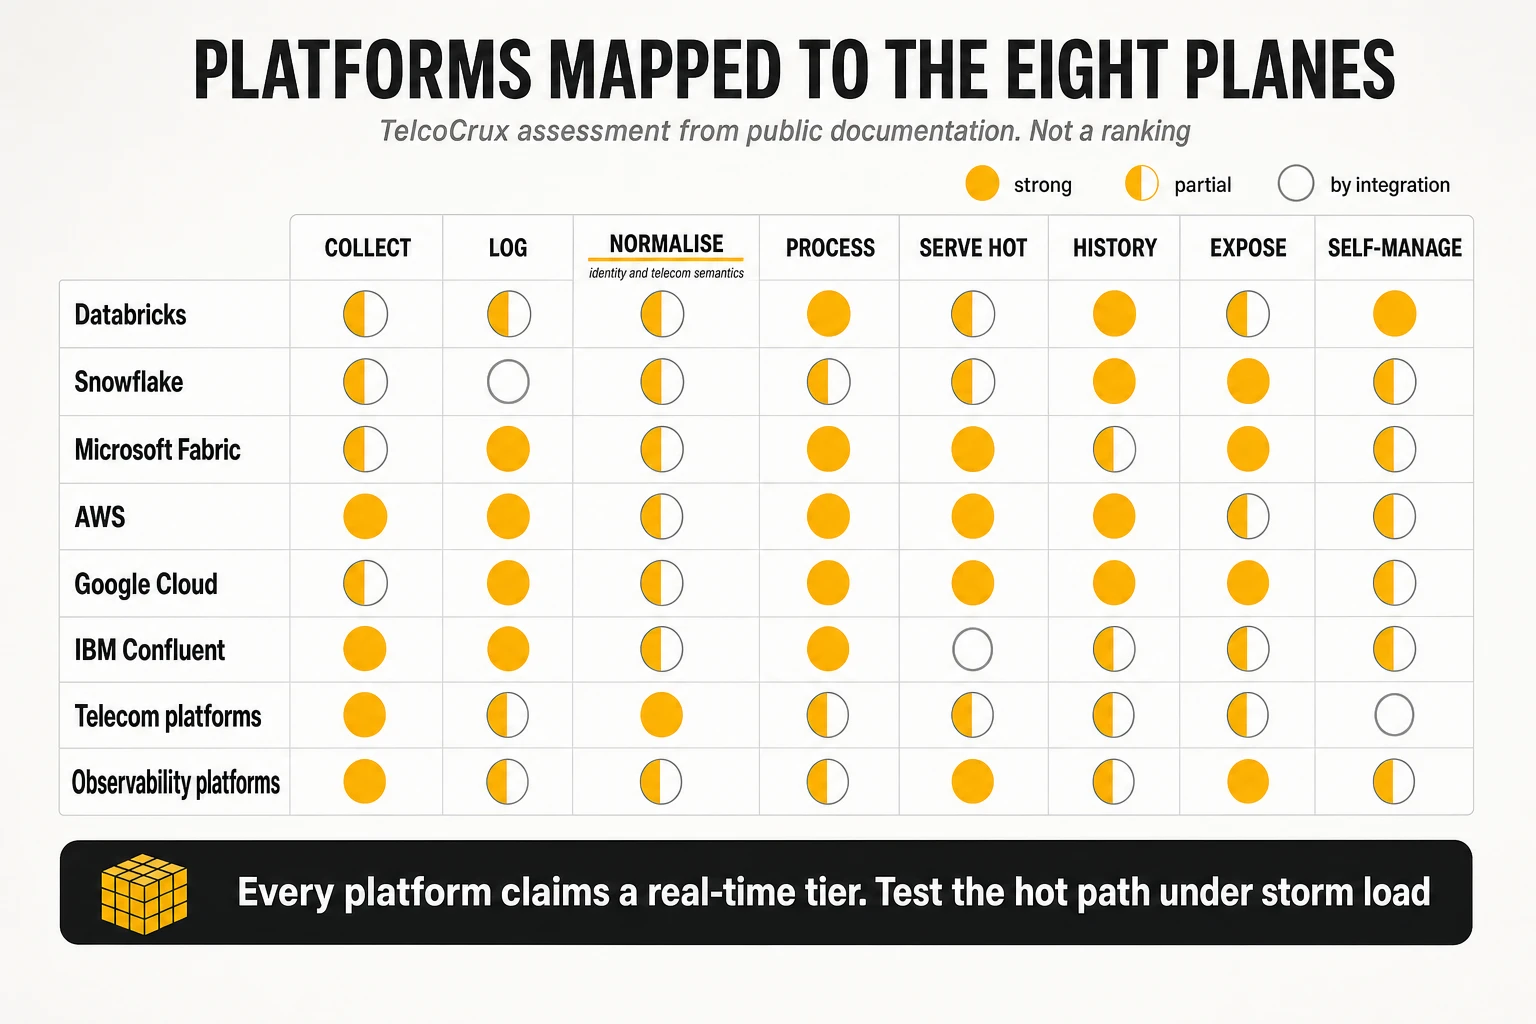
6.1 Databricks: engineering, lakehouse and AI, moving towards real time
Databricks’ centre of gravity is data engineering, the lakehouse and machine learning, and its recent releases push all three towards operational latency.
- Ingestion without a broker. Zerobus Ingest, generally available since February 2026 on AWS and Azure, writes events directly into Delta tables over an API, without a Kafka cluster in between; Databricks cites under five seconds to the table and up to 100 MB/s per connection.
- Low-latency streaming. Spark real-time mode, generally available since March 2026, brings stateful Structured Streaming into the sub-second range on Databricks.
- Declarative pipelines and governance. Lakeflow pipelines, Unity Catalog for governance across Delta and Iceberg, and Predictive Optimization, which runs compaction, liquid clustering, vacuum and statistics automatically on managed tables — a concrete instance of the self-managing platform described in section 2.
- Operational state. Lakebase, a managed PostgreSQL built on the Neon technology acquired in 2025, adds a transactional store synchronised with lakehouse tables.
- Telecom positioning. The Data Intelligence Platform for Communications, launched in January 2024 with AT&T as an early adopter, and a published network performance monitoring reference architecture.
Where it fits in layer 06: history, model training, feature engineering, batch and streaming transformation, and increasingly the investigation tier. What to verify: the storm behaviour of the detection path when it shares a workspace and capacity with analytics; total cost of always-on streaming compute; and that the latency figures — published by the vendor — hold on the operator’s pipelines.
6.2 Snowflake: enterprise analytics with a faster front door
Snowflake’s strength is governed, shared enterprise analytics: joining network data with customer, product and financial data under one security model. That matters for the questions that turn a degradation into business impact. Its streaming capabilities have moved from minutes to seconds.
- Snowpipe Streaming in its high-performance architecture, generally available since September 2025, documents default limits of up to 20 GB/s per table, with data queryable within seconds in favourable conditions.
- Openflow, the managed NiFi service, provides connectors from operational sources.
- Open formats: Iceberg tables and Apache Polaris, which Snowflake originally contributed; operational state: Snowflake Postgres, generally available since February 2026; and observability: the Observe acquisition, with telemetry stored in Iceberg.
Where it fits: the corporate lakehouse in Model C, cross-domain and commercial analytics, reporting and SLA. What to verify: seconds-level ingestion is not a stateful event-time processor; detection and correlation still need a processing plane, and the cost of continuous ingestion and frequent queries should be modelled at operational volumes.
6.3 Microsoft Fabric: real-time intelligence inside the Microsoft estate
Fabric is the platform that has packaged the hot path most explicitly as a product. Its Real-Time Intelligence workload combines Eventstreams for ingestion and transformation, Eventhouse and KQL databases — the Azure Data Explorer engine, strong for time-series and log analytics over fresh data — Activator for event-driven rules and actions, a Real-Time Hub, and OneLake as the shared storage. A digital twin builder, in preview, adds an ontology over OneLake data.
Two facts frame it for operators. Azure Operator Insights, Microsoft’s telecom-specific analytics product, is no longer offered — its documentation now redirects to Azure’s general analytics pages, following the wind-down of the Azure for Operators portfolio — so telecom specificity now has to come from partners or from the operator. And Fabric’s capacity model, in which workloads share purchased capacity units, makes isolation between operational and analytical workloads a design task rather than a default.
Where it fits: operators deeply invested in Azure, Microsoft 365 and Power BI, for investigation, operational dashboards and event-driven automation in Model A or C. What to verify: workload isolation and throttling behaviour under storm load, and the latency of the full path rather than of KQL queries alone.
6.4 AWS: building blocks for every plane
AWS offers a service per plane rather than one platform, which gives freedom and leaves the integration to the operator or a partner.
- Log: Kinesis Data Streams, re-priced with On-demand Advantage in November 2025, and Amazon MSK with Express brokers.
- Processing: Managed Service for Apache Flink, which added Flink 2.3 in 2026 with some open-source features unsupported.
- History: S3 with S3 Tables for managed Iceberg, Athena, EMR, and Redshift with zero-ETL integrations from operational databases.
- Hot serving and state: OpenSearch Service, Timestream for InfluxDB, DynamoDB and ElastiCache; graph through Neptune, which AWS has used for network digital twin root cause analysis.
Where it fits: operators running core and IT workloads on AWS, and Model B built with managed components. What to verify: the cost of inter-zone traffic for streaming, the support lag of managed services behind open-source releases, and the integration and governance effort across services.
6.5 Google Cloud: data plane plus graph plus agents
Google combines a data plane — Pub/Sub, Dataflow, managed Kafka, BigQuery, Bigtable — with Spanner and Spanner Graph for operational state and topology, and packages the combination for operators as the Autonomous Network Operations framework.
- Streaming analytics: BigQuery continuous queries process data as it arrives with SQL; Bigtable continuous materialized views maintain aggregates incrementally for low-latency serving.
- The framework, as updated at MWC 2026, holds the network digital twin as a temporal graph in Spanner Graph, uses BigQuery for federated analytics without ETL, trains graph neural networks in Vertex AI, and includes an open-source telecom data pipeline and data models.
- Operator evidence: Vodafone’s Nucleus platform was announced in 2021 to process about 50 TB of data a day from 5,000 feeds; Deutsche Telekom reports that its RAN Guardian agent, live since November 2025, reduced the time to manage large events from hours to about a minute.
Where it fits: operators that want the data plane, the graph and the agent platform integrated, especially where BigQuery is already the corporate warehouse. What to verify: concentration in one supplier, the editions and reservations required for the features in the design, and deployment options for data that must stay on premises.
6.6 IBM and Confluent: the streaming specialist inside a larger portfolio
Confluent built the commercial ecosystem around Kafka — governed streaming, connectors, managed Flink and Tableflow, which materialises topics as Iceberg or Delta tables in the operator’s storage and registers them in external catalogs. Since IBM completed its acquisition in March 2026, it is part of a portfolio that includes watsonx.data, IBM MQ and webMethods.
Where it fits: the durable log and the shift-left pattern, in any model, as a cloud-neutral streaming backbone. What to verify: roadmap continuity and pricing under the new owner, and the commercial terms of the bring-your-own-cloud options.
6.7 Telecom-specific platforms: domain knowledge as the product
Telecom vendors bring what the general platforms lack: parsers for vendor counters and probe outputs, telecom data models, identity mappings and analytics designed for network operations. Their data planes are increasingly built on the same open components discussed in section 5, and their differentiation lies in the domain layer above.
- Elisa Polystar: Kalix DataOps for integration and governance of network and OSS data, Kalix Analytics and the Osix probing and monitoring platform, deployed at operators including MasOrange and Bouygues Telecom.
- Nokia: the Autonomous Network Fabric, launched in June 2025, includes unified data management that publishes network data as data products on a data mesh with virtual federation, deployable as a service, on premises or hybrid.
- Ericsson: the Intelligent Automation Platform, extended to the core network in June 2026, with its own data collection, streaming and enrichment for rApps and core applications.
- NETSCOUT: positions its packet-derived smart data as an AI-ready source for operators’ data platforms.
- Amdocs, Netcracker and other OSS and BSS suppliers: data and AI platforms beneath their assurance and customer applications, such as Amdocs’ amAIz suite.
- Cisco and Splunk: Provider Connectivity Assurance feeds KPIs and alerts into Splunk, which provides the data and search plane.
Where they fit: collection and normalisation for their domains, domain analytics, and Model D. What to verify: whether the semantic model, the identity mappings and the history are stored in open formats the operator can read without the product, and whether the product can publish into the operator’s backbone rather than only consume from it.
6.8 Who brings what
| Supplier | Strongest planes | Distinctive in 2026 | Role TelcoCrux would give it | Main watch-out |
|---|---|---|---|---|
| Databricks | Process, persist, self-manage | Zerobus, real-time mode, Predictive Optimization, Lakebase | Corporate lakehouse, features and ML; candidate for investigation tier | Detection path isolation and always-on streaming cost |
| Snowflake | Persist, expose | Fast Snowpipe Streaming, Polaris, Postgres, Observe | Corporate lakehouse and cross-domain analytics | No stateful event-time processing of its own |
| Microsoft Fabric | Log, process, serve hot, expose | Eventhouse and KQL, Activator, OneLake | Operational analytics in Azure-centric operators | Capacity sharing and isolation |
| AWS | Every plane, as separate services | Kinesis re-pricing, MSK Express, S3 Tables | Building blocks for Model B in AWS | Integration effort; inter-zone cost |
| Google Cloud | Process, persist, state and graph | Spanner Graph twin, BigQuery continuous queries, ANO framework | Integrated data, graph and agents where Google is the main cloud | Concentration; on-premises options |
| IBM Confluent | Log, shift-left to lakehouse | Tableflow; cloud-neutral streaming | Durable log in any model | Roadmap under new ownership |
| Telecom platforms | Collect, normalise, domain analytics | Vendor parsers, telecom models, identity mappings | Domain components publishing to the operator’s backbone | Ownership and exportability of semantics and history |
| Observability platforms | Serve hot (search, metrics), expose | Federated search over Iceberg, open observability stacks | Search and observability tier | Being mistaken for the brain or for the whole layer |
7. Four ways to assemble the layer
The technologies in sections 5 and 6 combine into four recognisable assemblies. None is universally right. Each fits a starting point, and each has a characteristic way of failing that should be tested for explicitly.
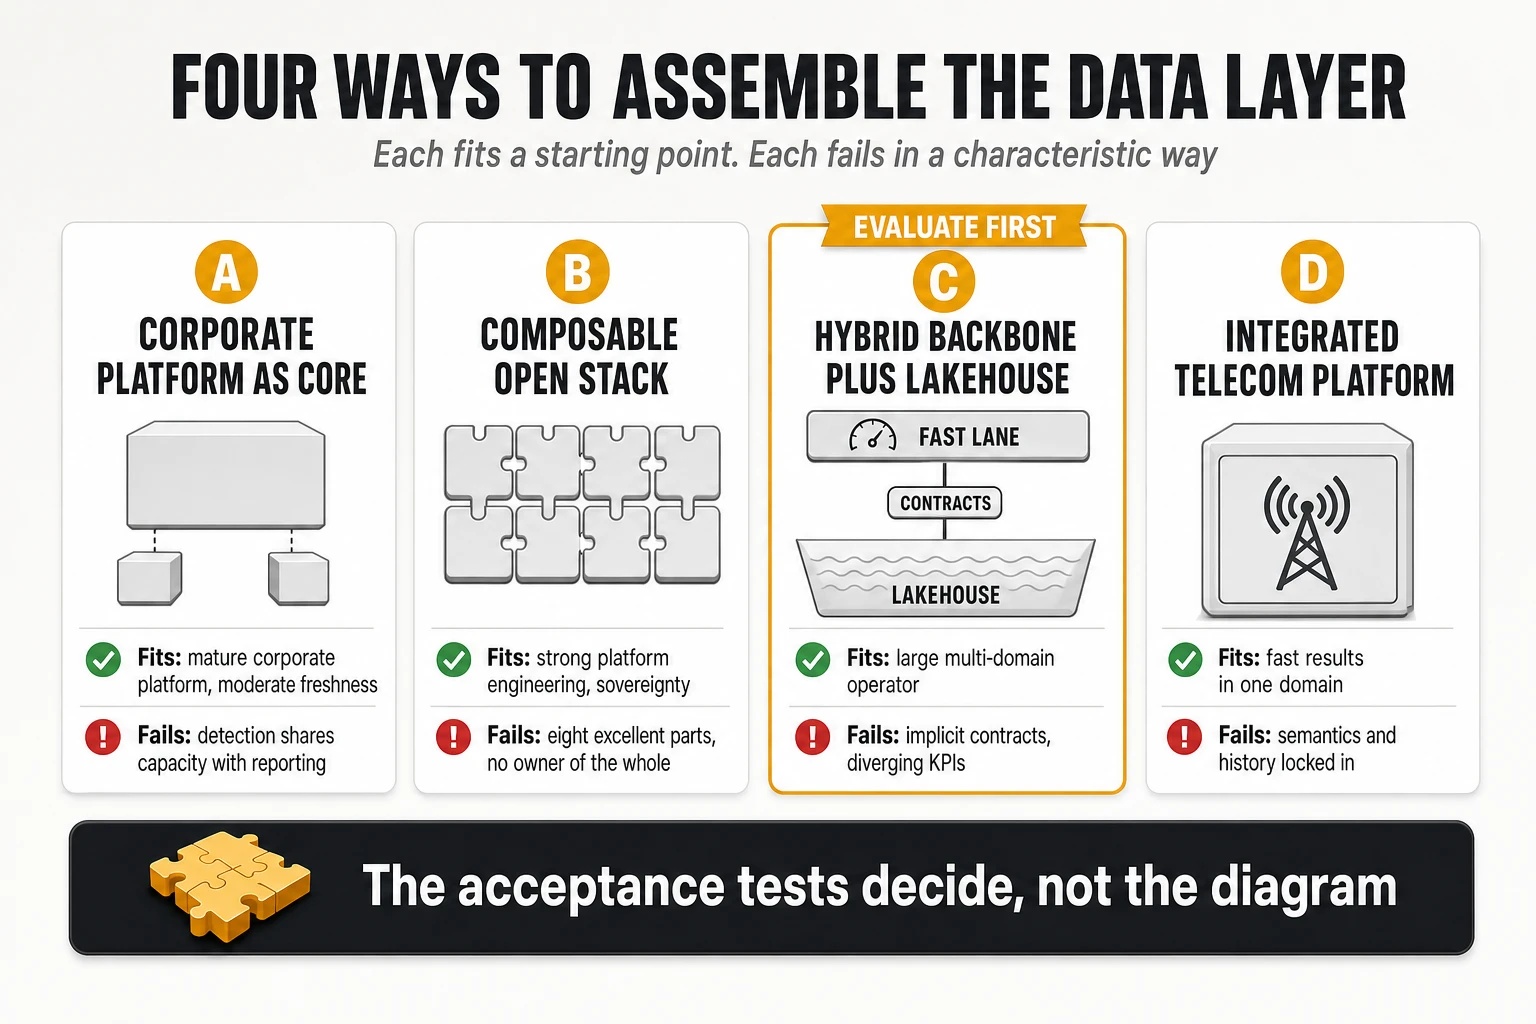
Model A — The corporate platform as the core
The operator uses its corporate data platform — Databricks, Snowflake, Microsoft Fabric, BigQuery or Redshift and their streaming services — as the centre of layer 06, and adds specialised components only where a requirement cannot be met. It reuses skills, security, governance and commercial agreements that already exist, and it keeps network data next to customer and financial data, which matters for impact in commercial terms.
- Fits: operators with a mature corporate platform, a moderate requirement for second-level freshness and a central data organisation that is willing to run an operational service.
- Typical failure: operational workloads that need second-level freshness, storm absorption and independence from the analytics estate are placed on a platform governed, budgeted and maintained for analytics. The first major incident reveals that detection depends on a capacity pool shared with month-end reporting.
- Test first: storm test and partial-failure test (section 12), with detection running on the corporate platform.
Model B — The composable open stack
The operator selects a component per plane: a Kafka-compatible log, Flink or a streaming database for processing, ClickHouse, StarRocks or Doris for hot analytics, a search engine for logs, Iceberg or Paimon on object storage for history, an open catalog, and its own exposure layer. It gives the best fit per workload and the most control over formats and cost.
- Fits: large operators with strong platform engineering, strict sovereignty requirements or on-premises telco cloud estates, and a willingness to run distributed systems as a core competence.
- Typical failure: the integration and operation of eight technologies absorbs the team; upgrades lag; each component is excellent and the whole has no owner. Open source lowers licence cost and moves it into engineering and on-call.
- Test first: the real-cost test, including staff, and the replay and backfill test across components.
Model C — Hybrid: an operational backbone and a corporate lakehouse
The operator runs a dedicated operational path — log, stream processing, hot stores, identity service, exposure — engineered for freshness and resilience, and publishes curated data products into the corporate lakehouse for history, model training and cross-domain analytics, through open table formats and explicit contracts. It separates the operational and analytical lifecycles without duplicating the meaning of the data.
- Fits: most large operators with several domains, an existing corporate platform and an operational requirement for second-level freshness.
- Typical failure: the contract between the two halves is left implicit; identities and semantics diverge; the same KPI computed in both places disagrees, and nobody owns the difference.
- Test first: point-in-time reconstruction across both halves, and the exit test on the shared history.
Model C is the one TelcoCrux would evaluate first for a large, multi-domain operator. The reason is not technical elegance. It is that the operational and analytical halves have different owners, budgets, change rhythms and failure tolerances, and an architecture that acknowledges that difference is easier to govern than one that pretends it away. What keeps the two halves one estate is shared contracts, semantics and identities — and, for history, an open table format with a shared catalog.
Model D — An integrated telecom platform
The operator adopts a telecom-specific assurance or analytics platform that brings ingestion, normalisation, storage, analytics and domain knowledge together, with connectors and models for network sources already built. It shortens the path to the first useful data products, because vendor counters, probe outputs and standard interfaces are already understood.
- Fits: operators that need results in a domain quickly, lack the engineering capacity for Model B, or are replacing an existing assurance stack.
- Typical failure: the semantic model, the identity mapping and the history end up in the vendor’s formats; the platform becomes a second data estate beside the corporate one; leaving it means rebuilding the knowledge it holds.
- Test first: the exit test, and an explicit answer to the question of who owns the data, the semantic model, the rules and the trained models.
Choosing
| Starting point | Evaluate first | Condition for success |
|---|---|---|
| Mature corporate platform; moderate freshness needs; strong central data team | A | Isolated capacity and degraded modes for the operational workloads |
| Strong platform engineering; sovereignty or on-premises constraints | B | A single owner for the integrated platform and a realistic staffing model |
| Large multi-domain operator with an existing corporate platform | C | Explicit data contracts and one catalog across both halves |
| Need for fast results in a domain; limited engineering capacity | D | Contractual ownership and exportability of data, semantics and models |
Whatever the model, the tiers set the order of work. Tier 1 — the storm-proof log, the identity service, the indicator pipelines and the hot store — comes first and is engineered for the incident. Tier 2 follows, and is where the corporate platform, if there is one, contributes most. Tier 3 is added on top, once tiers 1 and 2 are measured and stable. The models differ in who supplies each tier, not in that order.
The models are not exclusive over time. A common and sensible path starts with Model D in one domain to obtain results, builds the operational backbone of Model C in parallel, and moves the telecom platform progressively into the role of a specialised component — connectors, domain models, analytics — that publishes into the operator’s backbone rather than replacing it.
8. The neighbours: graph, change and agents
Layer 06 does not stand alone, and three of its neighbours are frequently confused with it. The graph that models the network, the change process that most often explains a degradation, and the agents that increasingly consume the evidence each depend on the data layer and each impose requirements on it. This section draws the boundaries precisely, because a vendor proposal that blurs them is usually selling one neighbour as if it were the layer, or the layer as if it were the neighbour.
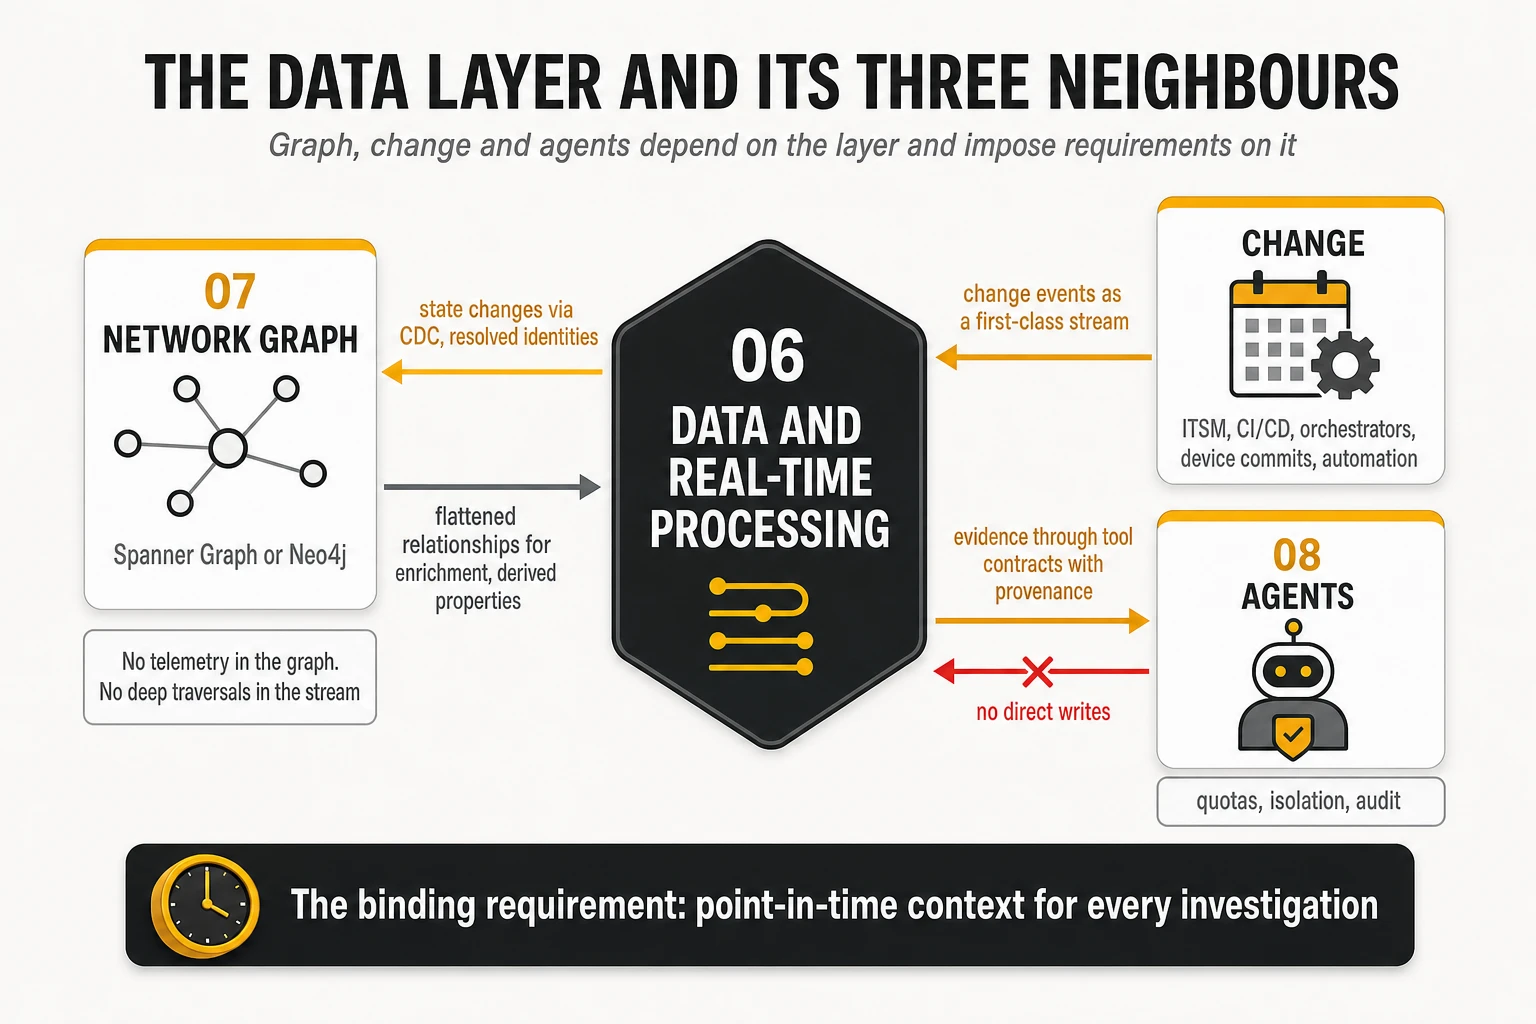
8.1 The graph: what it takes from the data layer and what it gives back
The graph and the data layer answer different questions. The data layer answers “what happened, when, and how much”: counters, events, logs, sessions, at volume and over time. The graph answers “what depends on what”: which functions serve which slices, which slices carry which enterprise customers, which links share a duct. Root cause and impact analysis need both, and the most common architectural mistake is to try to make one store do the other’s job.
Two rules keep the division clean.
- Telemetry does not go into the graph. A graph database holding billions of counter values is an expensive and slow time-series database. The graph holds entities, relationships, state and references; the data layer holds observations, keyed by the same resolved identities so that the two can be joined.
- Deep traversals do not go into the stream. A stream processor that walks five hops of topology for every event recomputes the graph badly. The enrichment stage takes a flattened, frequently refreshed projection of the relationships every event needs; anything deeper is a query to the graph.
The flows between them are specific and should be designed as data products.
- Data layer to graph: state changes from inventories, orchestrators and controllers, delivered through change data capture or event streams, keep the graph current; resolved identities keep its keys consistent with the telemetry.
- Graph to data layer: flattened projections of relationships (function to host, cell to site, slice to customer) for enrichment; derived properties such as criticality or centrality computed by graph algorithms; and the graph’s own change history, which the lakehouse retains for point-in-time reconstruction.
- Joint queries: an investigation that asks “which enterprise customers on slices served by the degraded user plane function saw throughput drop in the last hour” needs the graph for the first half and the data layer for the second. The join key is the resolved identity, and its quality decides whether the answer is right.
8.2 Spanner Graph and Neo4j, seen from the data layer
Our network digital twin article compares Google Spanner Graph and Neo4j in depth as graph engines. From the perspective of layer 06 the relevant difference is narrower: how each one connects to the streaming and historical planes, and what that implies for the rest of the layer.
- Spanner Graph is a graph declared over relational tables in a distributed transactional database. The graph changes when a row is committed, the same data is queryable in SQL and in GQL, and the integration with the data layer is native within Google Cloud: change streams publish every modification for Dataflow to carry into BigQuery, federated queries let BigQuery join live topology with history, and reverse ETL writes computed results back. It is strongest when the operator’s operational state and its graph can live in the same database, and when BigQuery is the historical plane.
- Neo4j is a native graph database fed and drained by connectors. The Neo4j Connector for Kafka consumes topics as a sink and publishes changes as a source, using Neo4j’s change data capture (Enterprise and the higher AuraDB tiers), and the Spark connector moves data to and from Databricks, Snowflake, BigQuery and other warehouses. It is strongest when dependencies are the core of the model and the operator wants to choose its streaming backbone and its warehouse independently of the graph.
The consequence for layer 06 is a choice of coupling, not of quality. Spanner Graph couples the graph to Google’s data plane and removes integration work inside it. Neo4j decouples the graph from the data plane and moves the integration work to Kafka, CDC and Spark connectors, which most operators already run. Either way, the data layer must provide the same three things: a stream of state changes, a stable identity scheme, and history for point-in-time queries.
Two further options deserve a line because they change the data-layer picture. Graph query engines that read lakehouse tables in place, such as PuppyGraph, avoid copying the topology into a separate database and suit analytical traversals over history, at the cost of transactional freshness. Streaming-oriented graph databases such as Memgraph target graphs updated at event rates. Neither removes the need for an owned ontology, which remains a layer 07 responsibility.
8.3 Temporal context: the requirement that binds the two
A degradation must be investigated with the context that existed when it occurred. If a function was rescheduled to another host during a deployment, joining today’s topology with yesterday’s telemetry produces a wrong cause and a wrong impact. Reconstructing the state of the network at a past moment — which functions were active, where they ran, what depended on what, which configuration was in force and which changes had just been applied — is required for root cause analysis, for post-incident review, for audit and for training models on correctly labelled history.
The data layer is where that history is kept, whichever graph engine is used. Three techniques are available, and most operators need a combination.
- Snapshot and time travel in the table format. Iceberg, Delta and Paimon keep table snapshots that can be queried as of a timestamp, within the retention configured for snapshots. The resolution is set by how often commits run and how long snapshots are kept, not by the format: frequent commits give fine resolution at the cost of more metadata and more files. The deeper limitation is that a snapshot records when data was written to the table, not when it was true in the network. A topology change that reached the inventory an hour late is an hour late in every snapshot.
- Validity intervals on state. Slowly changing dimension tables with valid-from and valid-to columns for every entity and relationship, fed by the change stream, allow exact as-of joins at any granularity. Because the intervals can record when a fact was valid in the network as well as when it was recorded, this is the technique that separates the two times. It is the most precise and requires discipline in the pipelines.
- The changelog itself. Retaining the raw stream of state changes in the lakehouse allows any state to be replayed, at the cost of computation at query time.
The test is to replay a past incident with the topology that existed at the time and check that the impact computed then matches the impact computed now. Section 12 includes it among the acceptance tests.
8.4 Change: the stream that explains most degradations
Changes are among the most frequent causes of service-affecting incidents, and they are often the least integrated data in the operations estate. Our change management article covers the governed lifecycle of a change. For layer 06, the requirement is simpler and more often missed: every change, from every source, must arrive as a normalised event, with the same identities as the telemetry, in time for the detectors and the investigators to see it.
Change events come from more places than the change management tool.
- Approved change records and their windows in the ITSM platform.
- Deployment events from CI/CD pipelines, Kubernetes and network function orchestrators — the changes that actually happened, which do not always match the ones approved.
- Configuration commits on network elements and controllers, captured from the devices or from configuration management.
- Software upgrades, licence and feature activations, and parameter changes from optimisation tools, including automated ones.
- Changes made by the operator’s own automation and agents, which must be attributed as precisely as human ones.
Treating change as a first-class stream has three uses in the layer. Detectors can suppress expected excursions during a planned window and, more importantly, flag unexpected ones that begin just after a change. Investigators and agents can line up changes against the onset of a degradation on the same time axis. And the pre-checks and post-checks of a change — the evidence that a change did no harm — read the same hot store that the detectors use, which is why verification of changes and verification of incident recovery should share their data products.
8.5 Agents: evidence through contracts
Agents change how the layer is consumed, not what it must guarantee. An agent investigating a degradation needs the current state of the affected entity, its recent metrics and events, its recent history, its relationships, the changes applied to it, similar past incidents and the policies that limit what it may do. Each of those is a call to a data product.
The exposure plane therefore has to treat agents as first-class, governed consumers.
- Tool contracts, not raw access. Agents should call documented operations — “metrics for entity X over window W”, “changes on entities related to X since T” — with structured inputs and outputs, rather than composing free-form SQL against production stores. The Model Context Protocol is a convenient way to publish such tools; it does not replace the semantic contract, the access control or the consistency guarantees behind them.
- Quotas and isolation. An agent that issues hundreds of exploratory queries during an incident competes with the detectors and the engineers. Agent workloads need their own capacity, limits and priorities on the serving stores.
- Provenance. Every answer an agent uses should carry the data product, the version and the freshness of what it read, so that a recommendation can be audited and a wrong one traced to stale or unresolved data.
- Read and write separation. Agents read from layer 06; their actions go through the orchestration and authorisation of blocks 04 and 09, never through a write into the data layer.
The agentic development model article describes how these contracts are built and maintained. For the data layer, the practical point is that the number of agent use cases an operator can deploy safely is bounded by the number of data products it exposes with a contract.
9. One incident through the layer, step by step
A silent degradation in a 5G core shows how the planes cooperate and where the latency budget is spent. The scenario is the one used in the assurance article, followed here only through layer 06. All timings are illustrative TelcoCrux figures for a well-designed estate, not measurements from a named operator.
The situation. A software release is rolled out to a group of user plane functions at 01:40. At 02:05, during the overnight window, one instance starts to show rising latency and packet loss on part of its traffic without failing. No conventional alarm fires; a few hundred thousand sessions and three enterprise slices are affected.
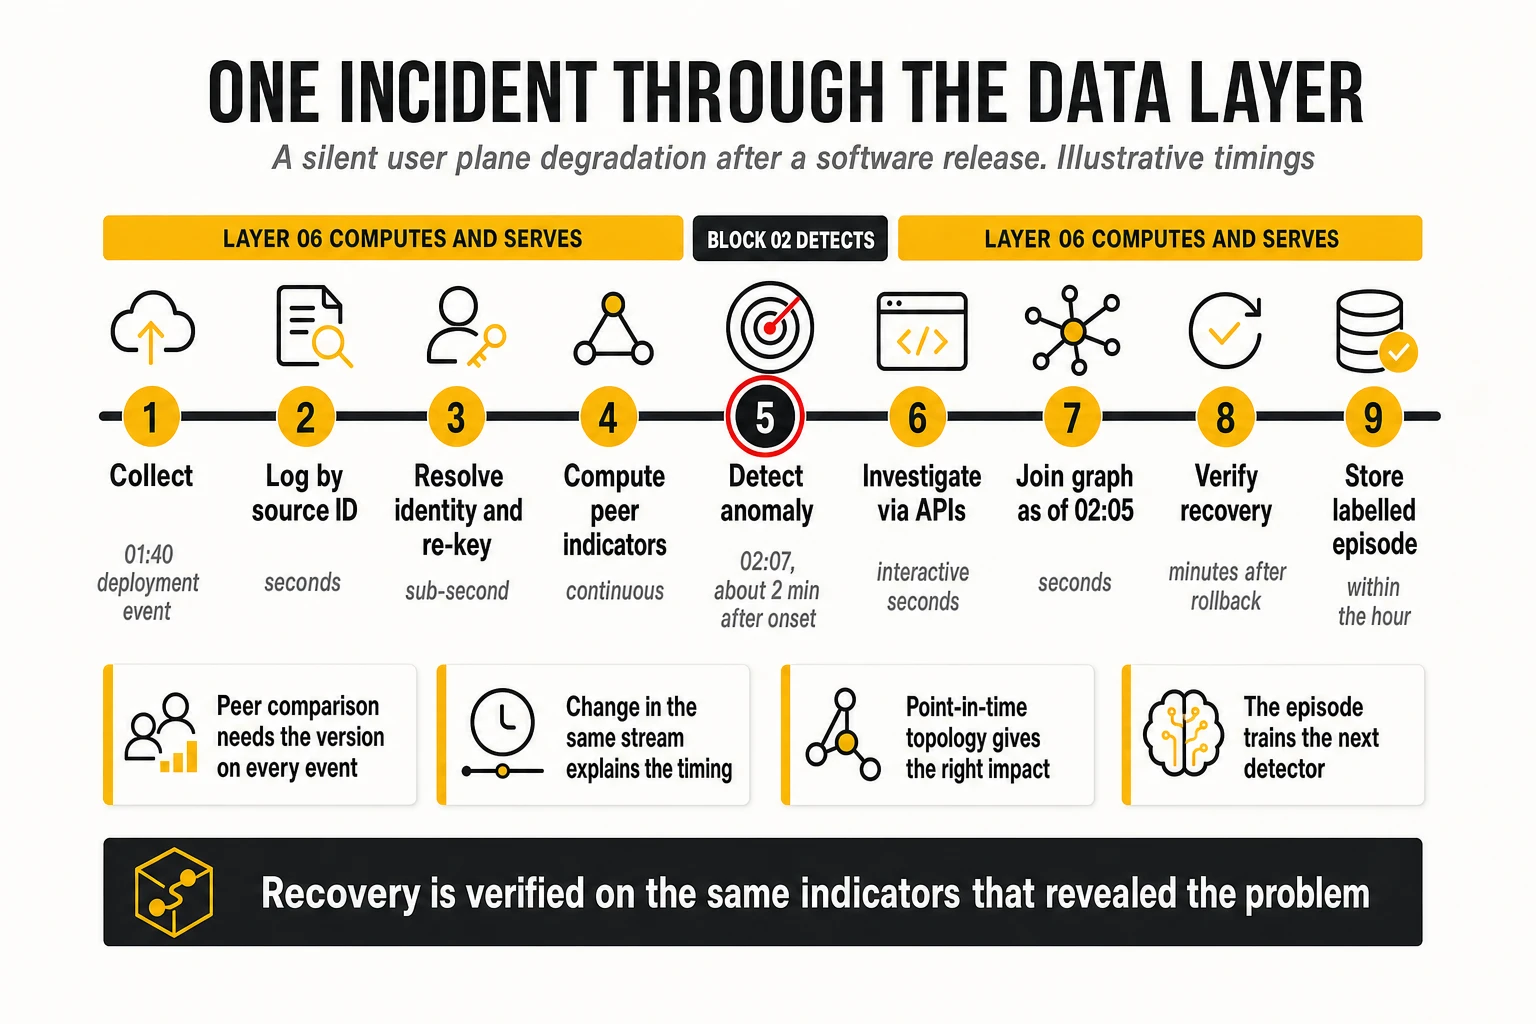
| Step | Plane or block | What happens | Illustrative elapsed time |
|---|---|---|---|
| 1 | Collect (06) | Per-instance user plane counters (one-minute granularity), PFCP and session events, Kubernetes metrics, probe-derived flow statistics and the deployment event from the orchestrator arrive at the collectors | Continuous; the deployment event at 01:40 |
| 2 | Durable log (06) | Events land in topics keyed by their stable source identifier, so that each source’s events stay in order; change events travel in a protected lane | Seconds |
| 3 | Normalise, reconcile and re-key (06) | Each event is mapped to the operator’s KPI definitions and enriched with the resolved instance, its host, its slices and its software version from the reference table kept current by change data capture; it is then re-keyed by the resolved instance | Sub-second per event |
| 4 | Process (06) | A stream job computes, in event time, per-minute indicators for each instance and for its peer group of the same release and region, and the deviation between them, and publishes them with the most recent change on each instance | Continuous; the deviation for one instance grows from about 02:05 |
| 5 | Detect (02) | The detection logic of block 02 evaluates the indicators with its own models and thresholds and, at 02:07, declares a persistent anomaly on one instance, noting the release deployed at 01:40 as a candidate cause | About two minutes after onset |
| 6 | Serve hot and expose (06) | Engineers and an investigation agent query the last six hours for all instances on the new release through data product APIs, with provenance — data product, version, freshness — on every answer | Interactive queries in seconds |
| 7 | Join the graph (06 with 07) | The graph returns the slices and enterprise customers served by the instance as they were at 02:05; the hot store returns their session and throughput metrics | Seconds |
| 8 | Verify (06 for 05) | After block 04 rolls the release back on the instance, the same indicators and the same hot store show the instance back within its peer group and the affected slices recovered; block 05 confirms recovery | Minutes after the action |
| 9 | Persist history (06) | The episode — signals, resolved identities, topology snapshot, change, hypothesis, action and verification — is written to the lakehouse as a labelled record for model training and problem management | Within the hour |
Four lessons from the walk-through are general.
- The detector worked because the peer group was computable. Comparing an instance with its peers on the same release requires the software version to be an attribute of every event, which is an enrichment and identity problem solved in layer 06, before any detection logic in block 02 can use it.
- The change explained the timing because it was in the same stream. Had the deployment event lived only in the orchestrator’s history, the correlation would have been found by a person, later.
- Impact was right because topology was point-in-time. The slices served by the instance at 02:05 are the ones that matter, not the ones served after the rollback rebalanced traffic.
- The episode is valuable twice. Once to resolve the incident, and again as a correctly labelled example for the next detector — but only if it is stored with the identities, versions and topology it was resolved with.
10. The infrastructure underneath
A data layer is a distributed system with its own physical footprint, and its behaviour depends on the compute, storage and network beneath it as much as on the engines above. Five infrastructure questions shape the layer, and several of them link back to the network the layer observes.
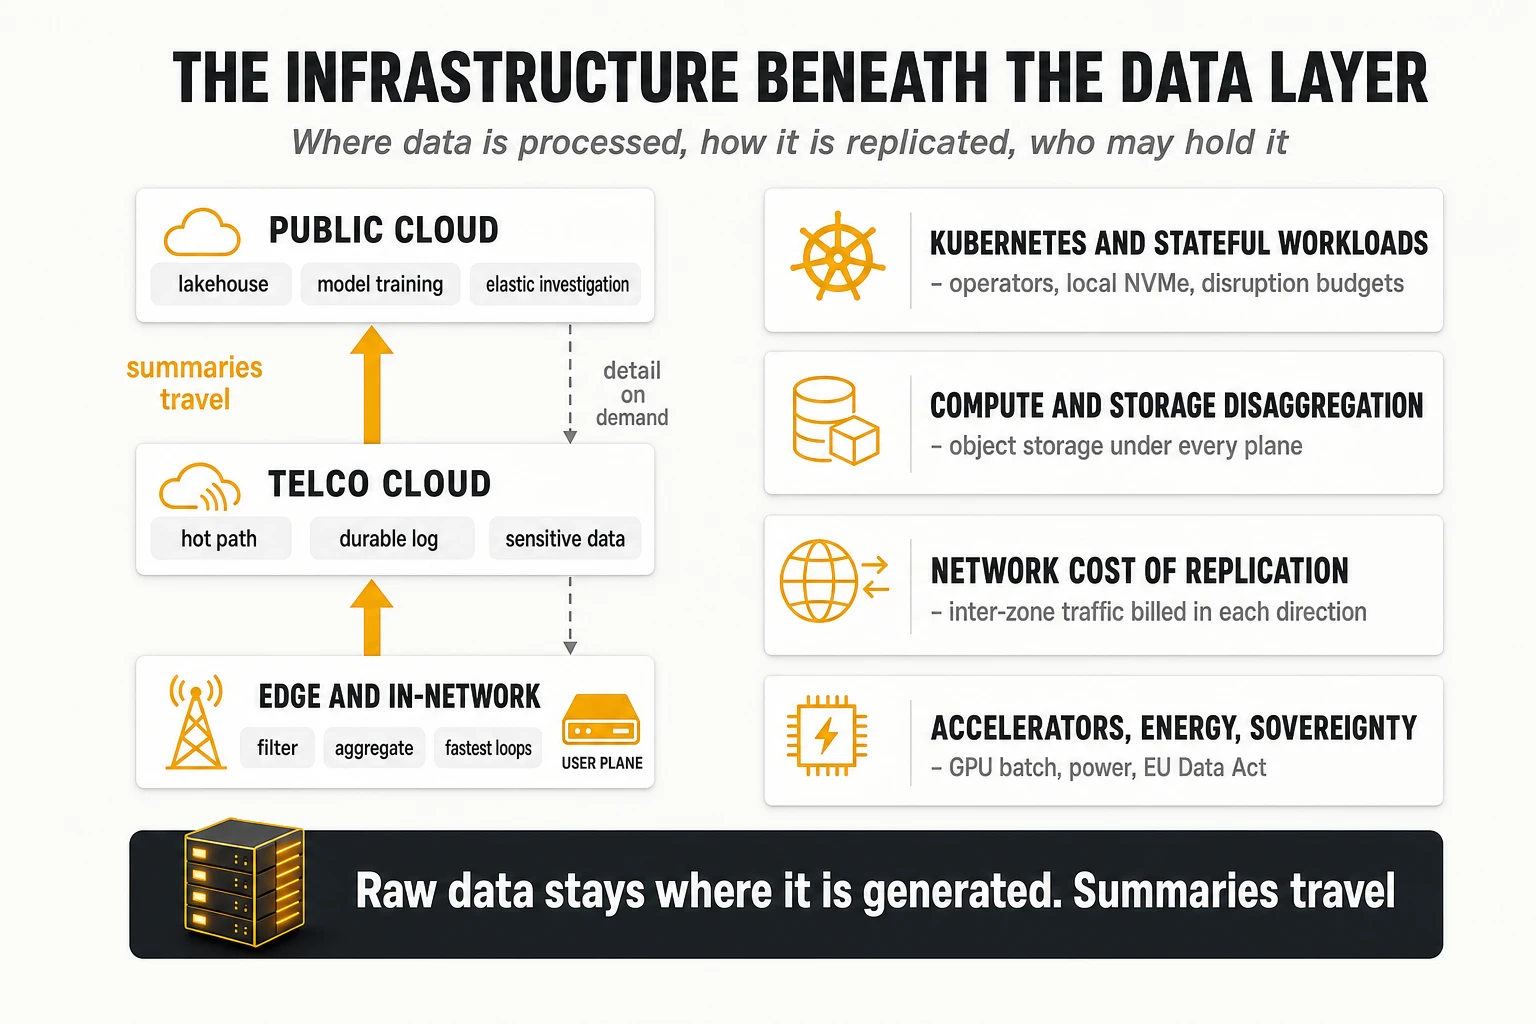
10.1 Where data is processed: edge, telco cloud, public cloud
The volume of network data makes placement an economic decision before it is an architectural one. User plane statistics, radio measurements and packet-derived records are generated at the edge in volumes that are expensive to move in full. Three tiers are emerging.
- Edge and in-network processing, next to user plane functions, RAN and aggregation sites: filtering, aggregation, feature extraction and the fastest control loops, with only reduced streams sent upwards. The O-RAN and 3GPP data collection functions described in section 5.1 sit partly here.
- Telco cloud, in the operator’s own data centres: the hot path for national operations, sensitive data that must stay on premises, and the durable log where inter-zone traffic is not billed.
- Public cloud: the lakehouse, model training, elastic investigation capacity and cross-domain analytics, where elasticity and managed services pay off.
The boundary between tiers should be drawn per data product, by freshness, volume, sensitivity and cost. A useful rule is that raw high-volume data stays where it is generated and summarised data travels; the summaries must be designed so that an investigation can request detail from the edge on demand, which is the data-layer equivalent of the selective capture discussed in the assurance article.
10.2 Kubernetes and stateful workloads
Most components of the layer now run on Kubernetes, through operators that encode their lifecycle. Strimzi, a CNCF incubating project, manages Kafka; the Flink Kubernetes Operator manages Flink jobs; equivalent operators exist for ClickHouse, StarRocks, OpenSearch and the distributed SQL databases. This lets the data layer share the operator’s telco cloud platform, its automation and its skills.
Stateful workloads on Kubernetes need explicit engineering. Local NVMe for low-latency logs and state, pod disruption budgets that respect replication, anti-affinity across racks and zones, and upgrade procedures that do not trigger rebalancing storms. The telco cloud platform team and the data platform team have to agree on those rules; otherwise a routine cluster upgrade becomes an outage of the operations centre’s evidence.
10.3 From local disks to object storage
The common direction of the engines is the disaggregation of compute and storage. Kafka’s tiered storage and agreed diskless topics, Flink’s disaggregated state, the shared-data modes of StarRocks and ClickHouse, and every lakehouse format move durable data to object storage and keep compute stateless or cache-based.
The benefits are elasticity, faster recovery and cheaper retention; the cost is latency and a new dependency. Object-storage writes and reads are slower and more variable than local disk, so the lowest-latency paths still need local storage. And the object store becomes a single dependency for almost every plane — which is why its choice on premises, discussed in section 5.5, and its availability design matter more than they used to.
10.4 The network cost of the data layer
The data layer is a significant network workload in its own right. Replication across zones, regions and sites; collection from edge to core; mirroring between the operational backbone and the corporate lakehouse; and backups all consume transport and data centre interconnect capacity. In public clouds that traffic is priced: on AWS, traffic between availability zones is charged in each direction, which is why it can represent more than half of a streaming platform’s infrastructure bill, as section 5.2 showed.
The operator’s own network planning should include the data layer’s traffic matrix. It is easy to model, rarely modelled, and it peaks during incidents, when collection volumes rise and replication catches up. Our article on why physical network infrastructure is scarce again describes the same pressure from AI workloads; operational data is a smaller but more time-critical contributor to it.
10.5 Accelerators, energy and sovereignty
GPU acceleration is reaching data processing, not only model training. NVIDIA’s cuDF plugin for Apache Spark, formerly the RAPIDS Accelerator, runs Spark SQL and DataFrame workloads on GPUs across the main managed Spark services. For large batch reprocessing — rebuilding a year of features, replaying history after a semantic change — it can change the economics; for the streaming hot path, CPUs remain the norm.
Energy is part of the cost model. Always-on stream processing, frequent compaction and redundant copies consume power continuously. The decisions that reduce copies and shed non-critical processing during peaks reduce energy as well as cost.
Sovereignty decides placement for a growing share of the data. Subscriber-related data, lawful interception constraints, national security codes for telecom networks and the EU Data Act, whose switching rules apply to cloud data processing services and ban switching charges from January 2027, all shape where data can live and how easily it can move. Open formats and an operator-controlled catalog are the technical counterpart of those regulatory rights: the right to switch is worth little if history cannot be read outside the platform that wrote it.
11. Governing the layer: twelve master keys
Technology selection decides what the layer can do; governance decides what it actually does on the night of an incident. The keys below are the ones TelcoCrux would insist on before any engine is chosen. They are deliberately vendor-neutral: each can be implemented on an open-source estate, on a single cloud platform or on a telecom-specific product, and each is checkable.
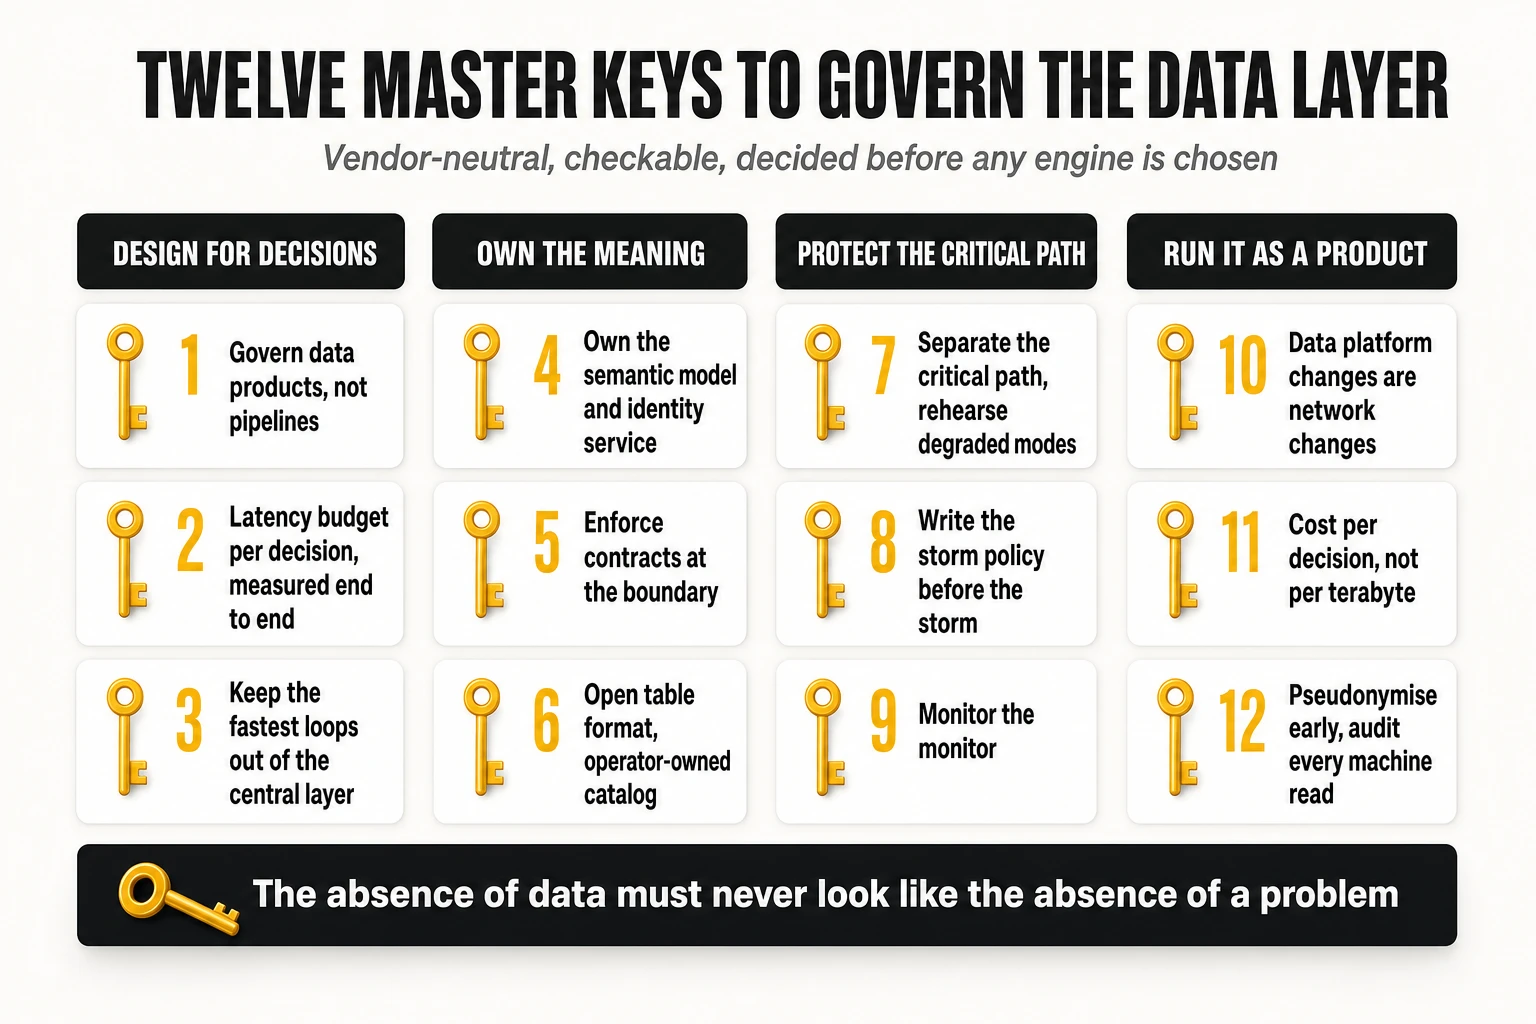
11.1 Design for decisions
Key 1 — Govern data products, not pipelines. Every dataset that a detector, an agent, an incident platform or a report depends on is a data product with a named owner, a published schema and definition, an objective for freshness and completeness, access rules and lineage. The product owner is accountable for meaning; the platform team is accountable for the platform. Pipelines are implementation details that can be rewritten without notice to consumers as long as the product contract holds.
Key 2 — Publish a latency budget per decision class and measure it end to end. For each class in section 3.6, state the maximum age of data at the moment of decision, at the 95th and 99th percentiles, and measure it continuously from source timestamp to consumer. A freshness objective that is not measured is a hope; one measured only inside a database is a vendor benchmark.
Key 3 — Keep the fastest loops out of the central layer. Decisions that need milliseconds belong in network functions, controllers and edge processing. The central layer supports seconds and slower. Writing that boundary down prevents the most expensive kind of scope creep: a data platform redesigned at great cost to meet a requirement it should never have owned.
11.2 Own the meaning
Key 4 — Own the semantic model and the identity service. The vocabulary of metrics and events, the mapping between vendor counters and operator KPIs, and the resolution of entities across sources are the operator’s intellectual property. They should live in operator-controlled repositories, be versioned, and be exportable from any product that uses them. A supplier may implement them; it should never be the only place they exist.
Key 5 — Enforce contracts at the boundary. Producers publish schemas to a registry — Confluent Schema Registry, Apicurio or a cloud equivalent; incompatible changes are rejected or versioned; consumers declare the versions they read. Schema evolution in the table formats is a capability, not a licence to change meaning silently. A counter whose definition changes with a software release is a new version of the data product, not the same one with a surprise.
Key 6 — Keep history in an open table format under an operator-owned catalog. Engines will change; the format and the catalog are what make history portable. They are the lakehouse part of a wider rule — keep the logical architecture under the operator’s control — that keys 4 and 5 apply to semantics, identities, streams and contracts. Choose a format with broad engine support, operate or contract the catalog so that it is not captive to one engine vendor, and test the exit: read the operator’s history from a second engine before signing a long commitment to the first.
11.3 Protect the critical path
Key 7 — Separate the critical path, and rehearse its degraded modes. Collection, the durable log, enrichment, detection and verification run in their own failure domains with cached reference data, and keep working when the lakehouse, the catalog, the dashboards or a cloud region are unavailable. Write the degraded modes down — what still works, with which data, for how long — and rehearse them like any other disaster recovery procedure.
Key 8 — Write the storm policy before the storm. Priority lanes for alarms, heartbeats, change events and detector inputs; explicit shedding or sampling order for everything else; back-pressure rules; and a freeze on non-critical workloads — reprocessing, compaction, heavy exploration — while an incident is declared. The adaptive platforms in the market sell this as an automatic behaviour; the operator should still decide the policy and verify that the automation follows it.
Key 9 — Monitor the monitor. Data observability is a production capability: per-source volume and lag, completeness per window, schema drift, identity resolution rate, late-data rate, and silence detection with expected heartbeats. Lineage — which sources and jobs produced each data product, standardised by projects such as OpenLineage — is what lets an investigator tell whether a wrong answer came from the network or from the pipeline. An alert that a source went quiet should reach the operations centre as quickly as an alert that a network function failed, because from the detectors’ point of view the two can look identical.
11.4 Run the platform as a product
Key 10 — Treat changes to the data platform as network changes. A new detector, a modified enrichment, a schema migration, a compaction policy or a version upgrade of the stream processor can blind the operations centre as effectively as a misconfigured router. They should go through the same governed change process described in our change management article: risk classification, pre-checks, staged rollout, post-checks and rollback. Automated optimisation of the platform — the “autonomous data platform” promise — is acceptable under the same rule: bounded by policy, throttled during peaks and incidents, and audited.
Key 11 — Make cost a design parameter, measured per decision. Track cost per ingested gigabyte, per retained terabyte-month, per query class, per agent investigation and per incident investigated, and allocate it to data products. The decisions that drive cost — granularity, retention, indexing, replication across zones and regions, the number of copies — should be reviewed like capacity decisions, with the owners of the data products in the room. Open-source components lower licence cost and raise engineering cost; the comparison has to be made on total cost over the planning horizon, including operations, disaster recovery and exit.
Key 12 — Pseudonymise early, control access by purpose, and record every read by machines. Subscriber identifiers are tokenised at ingestion; re-identification is a controlled service with its own audit trail. Access is granted by purpose and attribute — investigation, reporting, model training — rather than by system. Agents and automations are identities with their own permissions, quotas and logs, and every answer they use carries its provenance. Retention and residency rules are implemented in the platform, not in a policy document.
11.5 Who does what
The keys only work if accountability is explicit. A compact allocation that has worked in practice in operations data programmes follows; the names of the teams vary, the separation of roles should not.
| Responsibility | Platform team | Data product owners (domain teams) | Operations and assurance | Governance, security and architecture |
|---|---|---|---|---|
| Engines, capacity, upgrades, degraded modes | Accountable | Consulted | Consulted | Informed |
| Schemas, semantics, KPI definitions | Supports | Accountable | Consulted | Informed |
| Identity service and reference data | Operates | Accountable for their domain’s keys | Consulted | Informed |
| Freshness and completeness objectives | Measures | Accountable | Sets the requirement | Informed |
| Storm policy and priority lanes | Implements | Consulted | Accountable | Consulted |
| Access, pseudonymisation, retention, residency | Implements | Consulted | Informed | Accountable |
| Agent tool contracts and quotas | Implements | Consulted | Consulted | Accountable |
| Cost allocation and optimisation | Measures and optimises | Accountable for their products | Informed | Consulted |
| Changes to the data platform | Executes | Consulted | Approves for the critical path | Sets the policy |
The organisational pattern is a platform with federated product ownership. It borrows the useful part of the data mesh idea — domain teams own the meaning of their data — without the part that has failed in many enterprises: every domain running its own infrastructure. In an operator, the radio, core, transport, cloud and service teams own their data products; one platform team runs the backbone they all publish to.
12. How to evaluate the layer: tests, metrics and red flags
Vendor comparisons without the operator’s own workloads evaluate presentations, not architectures. The evaluation should start from the decision classes and the data products the operator needs, and every candidate — a single platform, a composable stack, a telecom product or a hybrid — should face the same tests on the same data.
12.1 Seven acceptance tests
- Event storm. Replay the worst incident of the last year at three times its original rate. Measure loss, duplication, consumer lag, end-to-end freshness at the 99th percentile and query latency for investigators at the same time.
- Investigation under load. Run concurrent interactive queries by engineers and agents while ingestion and detection continue at peak. Measure query latency and detector freshness together; one must not be bought with the other.
- Point-in-time reconstruction. Reproduce a past incident with the topology, configuration and identity mapping that existed at the time. Compare the impact computed now with the impact that should have been computed then.
- Partial failure. Remove the lakehouse, the catalog, a zone and a stream processing job in turn. Demonstrate which capabilities continue, with which data, how state recovers, and what has to be reconciled afterwards.
- Replay and backfill. Deploy a corrected detector or identity mapping and reprocess a week. Verify that published results are corrected consistently and that the hot path is unaffected while the replay runs.
- Exit. Read a month of history and the semantic model from a second engine, without the first vendor’s tooling. Measure the effort.
- Real cost. Price the estate at the planned retention, growth, concurrency and disaster recovery configuration, including inter-zone and inter-region traffic, operations staff and the exit test.
12.2 Metrics that relate the layer to outcomes
The layer’s metrics should connect to the operational results it exists for. Throughput records are not among them.
- Freshness from source timestamp to decision, per decision class, at the 95th and 99th percentiles.
- Loss, duplication and late-data rates per source, and the share of windows closed complete.
- Identity resolution rate: share of an incident’s entities merged correctly without manual mapping.
- Accuracy and age of the relationships used for enrichment, sampled against the graph and the network.
- Time to assemble the evidence for an incident: from detection to a complete, joined evidence set available to engineers and agents.
- Share of incidents whose recovery was verified from data rather than assumed.
- Share of incidents stored as complete, labelled episodes usable for learning.
- Cost per incident investigated and per data product, trended over time.
12.3 Red flags in a proposal
Some statements in vendor proposals should trigger a deeper test rather than a score.
- Latency quoted for one component — a query, an ingestion API — presented as end-to-end freshness.
- “Real-time” with no percentile, no load condition and no mention of the commit or refresh interval.
- A single engine proposed for search, aggregation analytics, time series, operational state and history, without workload isolation.
- Identity reconciliation described as “handled by the platform” with no metric for it.
- History stored in a proprietary format with export offered “on request”.
- Detection that depends on the availability of the analytics warehouse or a remote catalog.
- Agent access offered as direct SQL against production stores, without contracts, quotas or provenance.
- Cost modelled without inter-zone traffic, without replicas, or at a retention shorter than the operator’s requirement.
13. Conclusions
Layer 06 is where the ambition of autonomous operations meets the physics of data. Detection, diagnosis, verification and learning can only be as good as the evidence the layer delivers, and the layer is tested hardest at the moment it is needed most. Six conclusions summarise the argument.
- Design for decisions, not for a platform. Specify the freshness, completeness and resilience each decision class needs, keep the fastest loops in the network and at the edge, and choose engines to meet those budgets end to end.
- Solve identity, time and semantics first. They decide whether the layer is useful. The share of an incident’s entities resolved without manual mapping is a better predictor of value than any throughput figure.
- Separate the critical path. Collection, the durable log, enrichment, the indicators that detection depends on, and verification must work when the lakehouse, the catalog or a cloud region does not, and the storm policy must be written before the storm.
- Use the right store for each question. Real-time OLAP, time series, search, operational state and the lakehouse serve different workloads; the convergence of the market is a convergence of storage and formats, not of workloads.
- Control the logical architecture, not just the storage. Engines will change. What keeps the estate portable and affordable is control of the contracts, the semantics, the identities, the pipelines and the portability of the data — with history in an open table format, under a catalog the operator controls, as the lakehouse part of that control.
- Govern the layer like the network. Data products with owners, contracts at the boundary, data observability, cost per decision, purpose-based access for people and machines, and changes to the data platform treated as network changes.
The market is moving in the operator’s favour on cost and openness. Object-storage-native streaming, disaggregated state and open table formats lower the price of retention and replay and reduce lock-in. They do not remove the hardest work, which is semantic and organisational, and no vendor can do that work for an operator that has not decided who owns the meaning of its data.
The three tiers are the roadmap. Make tier 1 storm-proof first — the log, identity resolution, the indicator pipelines, the hot store, freshness and completeness monitoring — because everything else inherits its reliability. Build tier 2 next — investigation, history with point-in-time context, the semantic layer and data product APIs — because that is where most of the long-term value of the data is realised. Add tier 3 last — governed self-management, agent access and the learning loop — once the first two are measured and stable.
The practical next step is small and revealing. Take the last three significant incidents, list the data products each investigation actually needed, and measure for each one the freshness, completeness and identity resolution rate at the time of the incident. The gaps in that list are the roadmap for layer 06; the acceptance tests in section 12 are how to verify that a proposed platform closes them.
At TelcoCrux, we help operators design and govern the data and real-time processing layer behind assurance and autonomous operations: defining latency budgets per decision, choosing between corporate platforms, composable open stacks, hybrid backbones and telecom products, writing acceptance tests that reproduce real incidents, and keeping data, semantics and history under the operator’s control. If you are planning or reviewing this layer and want an independent read before committing, let’s talk.