

Four independent audits can rank the same broadband market four different ways, and none of them has to be wrong. Inside the same twelve-month window, nPerf’s 2026 barometer crowned Bouygues Telecom the best fixed operator across 35 mid-size countries with 163,038 nPoints, while handing the fastest-download title to Mundo in Chile at 564.19 Mb/s and the best latency to Norway’s Sognenett at 7.82 ms. In the United States, Opensignal’s January-March 2026 measurements gave download speed, consistent quality and video to Comcast (228.6 Mbit/s, 83.7%, 77.9 points), reliability to Charter (761 out of 1,000) and upload to AT&T by a factor of two and a half (120.0 Mbit/s against 46.9). Ookla named Netvigator the fastest and best fixed network in East Asia for the first half of 2026. MedUX, measuring over Ethernet cable inside real homes, scored BT at 4.59 out of 5 in the United Kingdom with 99.88% service reliability.
The divergence is structural, not accidental. One of those four methodologies never touches Wi-Fi; another one measures almost nothing else. One points its traffic at a server inside the operator’s own autonomous system; two others aim at commercial content delivery networks on the far side of the peering edge. One runs unattended every hour of every day; two only run when a human decides to press a button, which is disproportionately when something already feels broken. Each of those choices moves the answer by tens of percent, and each is defensible on its own terms.
The commercial context makes the distinction expensive. FTTH and FTTB networks had passed 191 million homes in the EU27 plus the United Kingdom by September 2025 (76.8% of homes), but only 105 million had subscribed – a take-up of 54.9% of homes passed, according to the figures Opensignal published in May 2026. Coverage has stopped being the scarce asset. Differentiation has moved to two places the access-speed sheet never described: the IP path between the customer and the content, and the last five metres of Wi-Fi inside the home. A survey of 2,000 UK adults published in August 2026 found 36% struggling with their home Wi-Fi connection, 15% of them in several rooms – on access lines that are, by any measurement, fine.
The engineering answer has moved with it. When access capacity was scarce, quality programmes were access programmes. Now that a gigabit line is a commodity in most competitive markets, the measurable difference is built in the segments between the access node and the content: where the recursive resolver sits, where address translation happens, where the subscriber user plane breaks out, which interconnect a destination is reached over, and whether the content is inside the network or across a transit path. That is a distribution problem before it is a capacity problem, and distribution is decided by the platform an operator can afford to run in thirty regional sites rather than in two national ones. Section 4 of this article is about exactly that, because it is the part of the work that decides most of what a customer feels and appears in none of the four headline speed figures.
A benchmark is never a verdict on a network. It is a verdict on a measurement path: a probe, an endpoint, an hour and a scoring function. Operators that lead consistently do not tune themselves to one auditor. They engineer the three segments every auditor eventually touches – the access line, the IP path to content, and the home radio – and they instrument all three before anyone else measures them.
1. How each measurement company actually works
The four methodologies are described here independently and on their own terms, without cross-comparison. Mixing them before each one is clearly understood is the most common cause of bad benchmarking decisions inside an operator: teams argue about who is right when the real question is what each one physically measures. The comparison comes afterwards, in section 2.
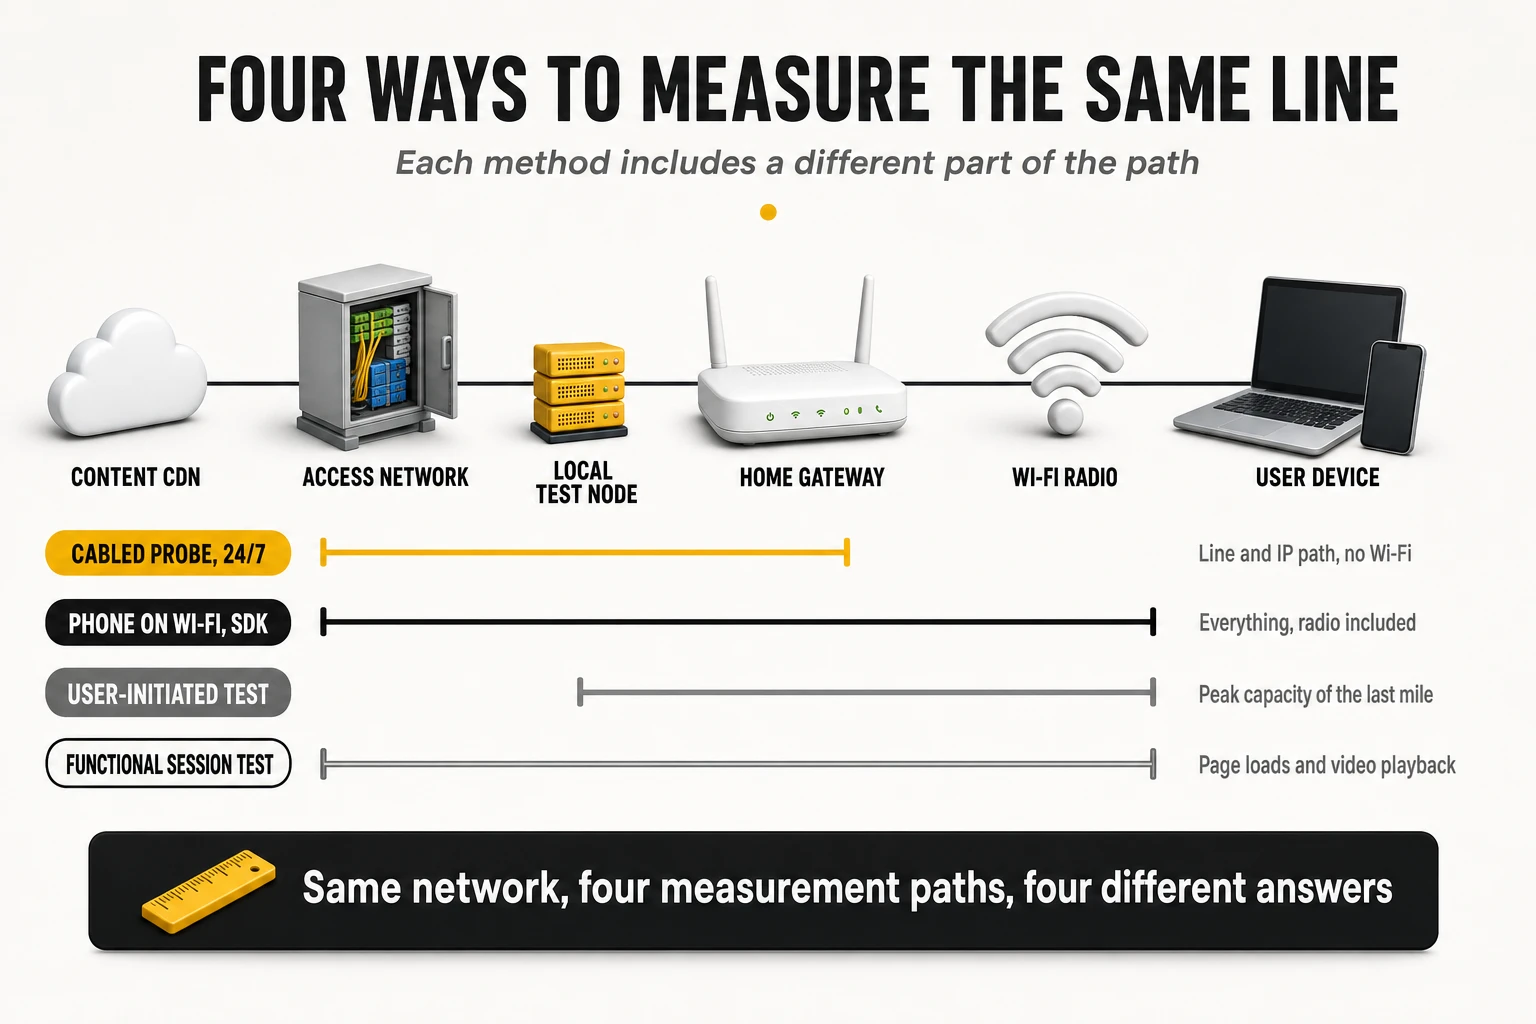
MedUX: dedicated probes, cabled to the router, running around the clock
MedUX measures with hardware it owns, installed in homes it selects. Its probes are low-power mini-PCs running the company’s own operating system, placed inside real subscriber homes and connected by Ethernet cable directly to a free LAN port of the operator’s router. Data acquisition is fully active, automated and scheduled 24 hours a day, seven days a week, with no human in the loop. Nobody decides to run a test because a video stalled; the probe runs the same battery of tests at 03:00 and at 21:00, which is what turns busy-hour degradation into a measurement rather than an anecdote.
The sample is a designed panel, not an organic crowd. Probes are distributed according to a statistical plan that mirrors the real customer base: weighted by access technology (FTTH, HFC, xDSL, fixed wireless) and by contracted speed tier. Volumes per campaign are large even when the panel is small, because each probe tests continuously: the UK campaign ran more than 900,000 tests against a single operator’s network, and the Italian campaign collected over 5 million tests across 16 regions in a single quarter. A 2025 campaign in another national market used more than 200 cabled probes across 15 regions to run over 6 million tests, concentrated on FTTH packages between 600 Mbps and 1 Gbps. The company describes its own statistical approach as closer to television audience panels than to mass crowdsourcing.
What the numbers represent is the operator’s own responsibility, isolated. Because the probe is cabled, the domestic Wi-Fi channel is removed from the measurement entirely: no 2.4 GHz interference from neighbours, no wall attenuation, no weak router radio. What remains is the access line plus the IP path to real service endpoints. That is simultaneously the method’s greatest strength – it certifies what the operator physically delivers to the customer’s own router – and its most important blind spot, because it says nothing about what the customer’s laptop experiences in the back bedroom.
The parameter set is organised by service, not by protocol. The published fixed broadband methodology groups measurements into categories a user would recognise:
- Cloud speed test (download and upload): a multi-thread, multi-server stress test designed to fill the line and expose its true capacity, run against high-volume commercial CDNs.
- Matching the promise: delivered download speed against the speed the customer was sold. This is a commercial compliance metric, not a network metric, and the other three methodologies do not attempt it because they do not know the customer’s tariff.
- Network responsiveness: round-trip latency, jitter and packet loss against reference nodes; the accessibility layer of the score.
- Web browsing and social media: full interactive page loads on popular sites, broken down into DNS resolution time, time to first byte and total browse time per resource.
- Video streaming: real playback sessions scored on startup delay, number and duration of stalls, average resolution achieved and percentage of session time at full resolution.
- Gaming: latency, jitter and packet loss measured against the live infrastructure of major game platforms rather than a generic echo server.
- Cloud services and HTTP transfer: single-thread download and upload of files, which is what most applications actually do, as distinct from the multi-thread speed test.
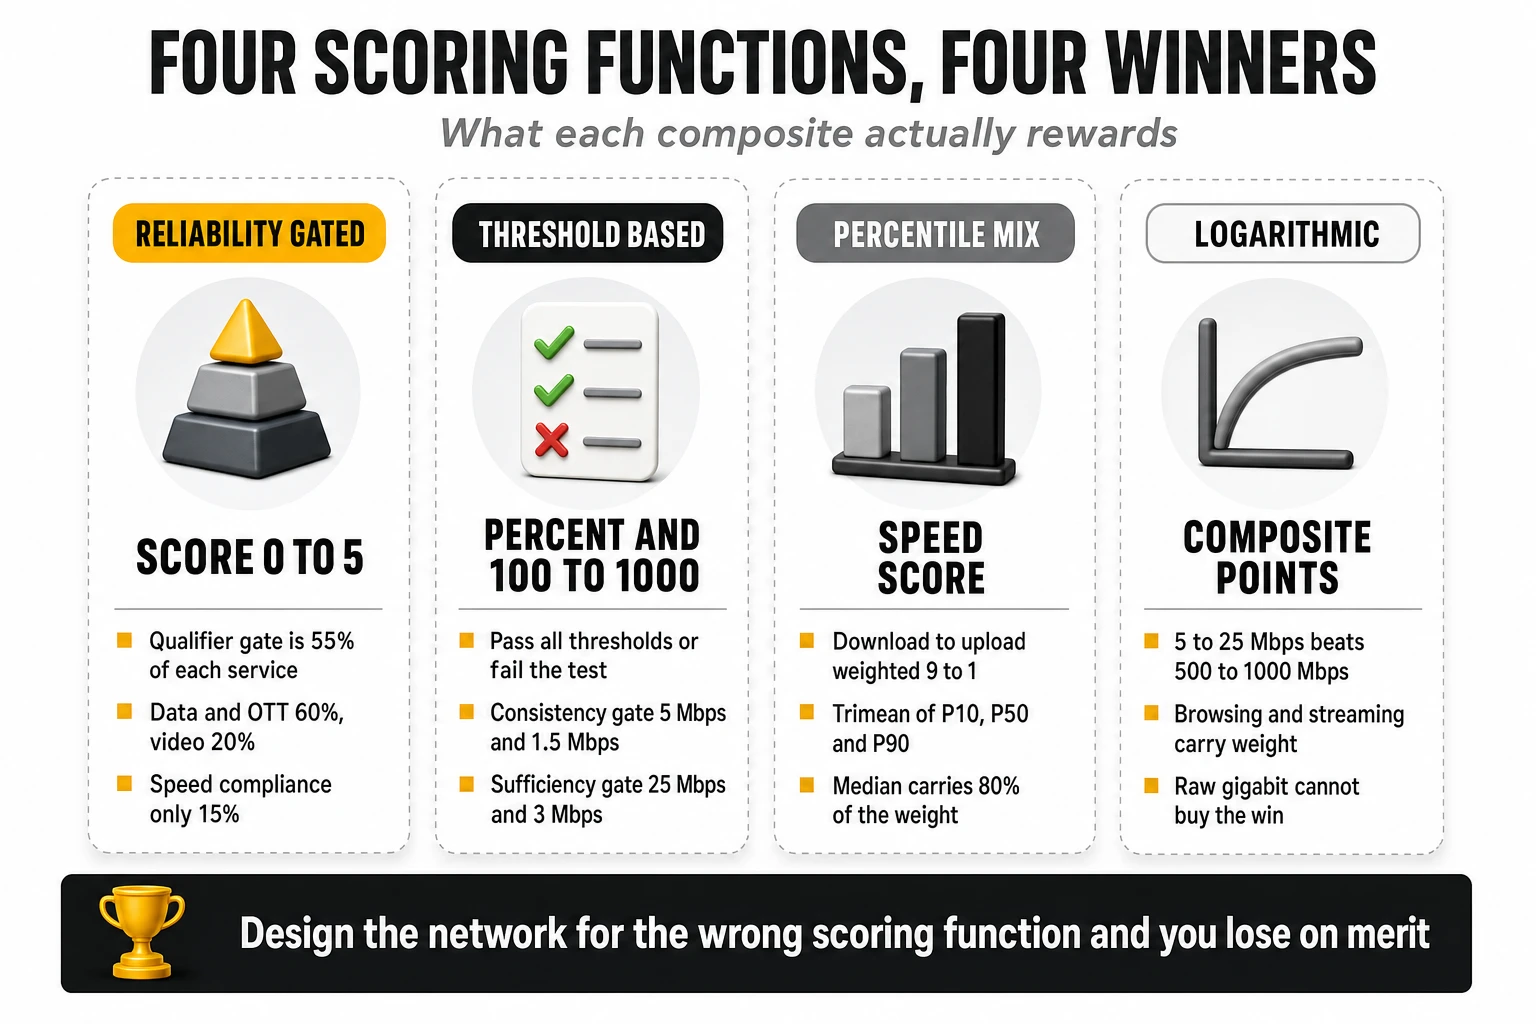
The scoring model is a three-level aggregation, and its structure matters more than its arithmetic. Each test case produces KPIs split into a qualifier and one or more differentiators. The qualifier is a pass/fail gate – the percentage of samples completed without errors that also clear a minimum performance threshold – and it carries 55% of the weight of every service score. The differentiators, which reward performance beyond the minimum, share the remaining 45% (typically 22.5%, 13.5% and 9%). Those KPIs roll up into an opinion score per service, and the service scores combine into a global score on a 0 to 5 scale, aligned with ETSI TR 103 559 and the mean opinion score framework of ITU-T P.800.1. Thresholds are reviewed annually against market and technology trends.
The service weights in the published fixed methodology tell you what the score actually rewards:
| Service category | Weight | Tests inside it |
| Data and OTT | 60% | HTTP download 15%, HTTP upload 15%, web browsing 10%, social media 10%, gaming 5%, cloud services 5% |
| Video streaming | 20% | Streaming session quality |
| Matching the promise | 15% | Multi-thread cloud download versus advertised speed |
| Accessibility | 5% | Network responsiveness: latency and jitter |
Read that table carefully and a non-obvious conclusion appears: this is a reliability scorecard with speed attached, not a speed ranking. Raw throughput enters the global score through a 15% compliance category and through the HTTP transfer tests inside data and OTT. Meanwhile, 55% of every service score is a pass/fail gate on error-free, above-threshold sessions. An operator with a 1 Gbps product and a 2% session failure rate will lose to an operator with a 600 Mbps product that never fails. That is a deliberate design position, and it is the opposite of what a speed index rewards.
Strengths, limits and biases can be stated precisely.
- Strengths: no user self-selection bias; genuine 24/7 coverage including peak congestion; clean attribution of a fault to the operator rather than to the home; and the only one of the four that systematically audits contracted-speed compliance.
- Limits: panels of hundreds of probes rather than millions of devices, so geographic granularity below regional level is weak; panel composition is a methodological choice that materially determines the outcome; and campaigns are periodic and commissioned rather than a continuously published public index.
- Structural blind spot: a weak router radio, a badly placed CPE or a congested 2.4 GHz band are invisible. An operator can win this benchmark and still generate a high volume of “my internet is slow” calls.
Opensignal: the smartphone in the living room, over Wi-Fi, by design
Opensignal collects its fixed broadband data from mobile handsets connected to home Wi-Fi. A software development kit is embedded in thousands of third-party applications and in the company’s own apps, on Android and iOS. Measurement is a hybrid of continuous passive observation – which network the device is attached to, whether connection attempts succeed – and short automated active tests, burst transfers of roughly ten seconds, scheduled pseudo-randomly through the day. The user is never asked to do anything, which removes the largest single source of bias in voluntary testing.
The sample is millions of unique devices, collected organically and assigned to households by geolocation. Analysis windows are typically 90 days, sometimes 30 for fast turnarounds. The May 2026 US report covered five national providers across a full quarter of data and 28 metropolitan statistical areas; the European view covers 18 markets. Because the sample rides on ordinary consumer app usage, it reflects the installed base of handsets, and that matters more than it sounds: the Wi-Fi generation of the phone is part of the measurement.
What the numbers represent is the entire chain, deliberately unseparated. When the phone is on home Wi-Fi, the test necessarily traverses fibre or cable, the router, the radio channel, the neighbours’ interference and the walls of the home. Opensignal does not isolate the access line, and states this as a feature rather than a caveat: it is measuring what the household actually receives. Of the four methodologies, it is the only one whose default reading always includes the last five metres.
The metric set is published in full, with explicit thresholds (Opensignal broadband metrics):
- Download and upload speed experience (Mbps): the average speed a user experiences over Wi-Fi against CDN application hosts.
- Broadband Consistent Quality (%): the proportion of tests that pass every threshold simultaneously – download above 5 Mbps, upload above 1.5 Mbps, latency under 50 ms, jitter under 12 ms, packet discard under 1% and time to first byte under 0.8 s – multiplied by the test success ratio. One failed threshold fails the whole test.
- Reliability Experience (100-1,000): a composite of three components – connectivity (can the device connect at all), completion (can it finish the task once connected) and sufficiency (does the session clear the higher thresholds of download above 25 Mbps, upload above 3 Mbps, latency under 50 ms, jitter under 12 ms and time to first byte under 0.8 s). Opensignal publishes the interpretation bands itself: above 600 users consider the connection highly reliable, 400 to 600 is mixed perception, below 400 is perceived as unreliable.
- Video Experience (0-100 MOS): modelled on ITU work relating streaming parameters to perceived quality, in the family of ITU-T P.1203, built from startup time, resolution achieved, time spent at each resolution and rebuffering. Published bands run from poor (under 48) to excellent (78 and above).
Aggregation uses one device, one vote, and this is a genuine methodological differentiator. Within an evaluation window, the platform first computes the average for each unique handset, then averages across handsets. A power user running fifty tests a week contributes exactly as much as a household that contributes two. This is why these averages are structurally more stable than test-weighted averages, and why they move slowly: a network change has to reach many homes before the number responds.
Rankings are built without a master composite, and ties are declared honestly. There is no blended single score hiding trade-offs; each metric stands alone. To be declared an outright winner, an operator’s 95% confidence interval must not overlap the next operator’s. If they overlap, both are named joint winners, which is why award tables frequently show two names. The “best home internet” designation requires an outright win in one speed metric plus at least a joint win in the other, and an outright win in one of the two consistency metrics. Weighting, in other words, is replaced by a rule about which combination of wins counts.
Strengths, limits and biases.
- Strengths: the only methodology that natively scores the in-home experience at scale; thresholds tied to whether a task is feasible rather than to abstract speed; statistical honesty about ties; very large samples.
- Limits: the operator is judged on a radio channel it may not control when customers use retail routers; handset mix caps results, since a fleet of Wi-Fi 5 phones cannot express a Wi-Fi 7 network; there is no contracted-speed compliance dimension; and the public data cannot be decomposed into line problem versus home problem.
- Threshold compression: consistent quality thresholds of 5 Mbps down and 1.5 Mbps up are trivial for a modern FTTH line, so in mature markets the metric saturates in the low-to-mid 80s and differences between good operators compress into two or three percentage points. Reliability, with its 25/3 Mbps sufficiency gate, discriminates far better, and it is the one to watch.
Ookla and Speedtest Intelligence: peak capacity to the nearest server
Ookla’s data comes from tests that users choose to run. The measurement is active and voluntary, launched from the Speedtest website, desktop applications or mobile apps. The engine opens multiple parallel TCP connections to saturate the line, and the server is selected dynamically as the one with the lowest round-trip time among a global fleet of more than 16,000 nodes – very frequently a node hosted inside the ISP’s own autonomous system or at a local internet exchange point. That server selection rule is the single most important thing to understand about the methodology.
The sample is by far the largest of the four, and the filtering is correspondingly aggressive. Results are consolidated into unified daily samples per user, location and day, so a frustrated customer testing thirty times in one evening does not count thirty times. Ookla also filters by device capability, using results from devices built on modern chipsets when computing scores, so that an ageing device fleet does not artificially depress a network. To qualify for an award in a market, a provider must hold at least 3% of that market’s total Speedtest samples in the period.
What the numbers represent is the peak capacity of the last mile, plus how the line behaves when full. With the endpoint often inside the operator’s own network, the measurement largely excludes transit, peering and international routing. That makes it an excellent capacity meter and a poor end-to-end quality-of-experience meter: an operator with an excellent access network and a congested peering edge will score well here and badly elsewhere. The newer loaded-latency metrics partially offset this by describing behaviour under stress rather than headline throughput.
- Speed Score: the headline composite. It combines download and upload in a 9:1 ratio, and within each direction it uses a modified trimean of the 10th, 50th and 90th percentiles weighted 1:8:1. Eighty percent of the statistical weight sits on the median, which is what most customers see on a normal day; the tails are present but cannot dominate.
- Consistency: the share of samples that meet a minimum of 25 Mbps download and 3 Mbps upload on fixed networks. This is the metric behind “most consistent network” awards, and it is a floor test, not an average.
- Latency under load (download and upload): round-trip time measured while the line is saturated in each direction. This is the bufferbloat metric, and Ookla is the only one of the four that publishes it systematically. It is also the metric most closely correlated with how a video call behaves while somebody else in the house is uploading.
- Video and gaming scores: separate 0-100 indices built from playback start time, absence of rebuffering and resolution achieved, and from game-server latency, jitter and throughput respectively.
- Connectivity Score: the composite used for “best fixed network” awards, weighted 50% network speed, 25% streaming video experience and 25% web browsing experience – a materially different question from “who is fastest”.
Winners are declared with a statistical test, not a leaderboard sort. Ookla applies non-parametric significance testing between the leading providers and requires the difference to be both statistically significant and large enough to matter before naming a single winner; otherwise the award is shared. Combined with the 3% sample-share floor and the exclusion of virtual operators, this makes the award set conservative relative to the raw tables published in the Speedtest Global Index.
Strengths, limits and biases.
- Strengths: unmatched sample volume and geographic granularity; the only systematic public view of latency under load; percentile-based scoring that describes the distribution rather than just the mean; and a country-level index that allows cross-market comparison over years.
- Self-selection bias, in two directions: people test when something feels wrong, which drags results down, and they also test immediately after upgrading to a faster tier, which pushes them up. Both effects are real and neither is corrected by sample size.
- Server placement: a result achieved against a node inside the operator’s own network measures the access line, not the internet the customer uses. This is why an operator can hold the fastest-network award and still lose a streaming or browsing comparison.
- Mixed access medium: the same market mixes desktop tests over Ethernet with phone tests over Wi-Fi. Metadata allows segmentation, but headline figures blend two very different physical paths.
nPerf: functional tests, logarithmic scoring and a published Wi-Fi cut
nPerf also relies on user-initiated tests, but the test itself is a full functional session rather than a throughput burst. Measurements arrive through native applications on iOS, Android, Windows and macOS, and through web widgets embedded in partner media sites. The company operates its own dedicated server fleet, dimensioned for connections up to 10 Gbps, and the complete test sequence chains a download, an upload, a latency measurement, a browsing test and a streaming test.
The annual barometers are built on a disciplined twelve-month cycle. The 2026 edition covers all tests between April 2025 and March 2026, retaining only those that meet the company’s quality and validity criteria, and a provider needs more than 5% of a country’s tests to appear. Results are split between busy hours (18:00 to 23:00) and idle hours to expose congestion, and published separately by access technology – including an explicit FTTH cut and an explicit Wi-Fi cut for the same operators in the same index.
- Download and upload bitrates: net goodput achieved during active TCP saturation against the dedicated server fleet.
- Latency: round-trip delay to the nearest node, with the minimum value used as the reference for the average.
- Browsing performance (%): the load time of the five most popular local sites, fully rendered – HTML, CSS, JavaScript, images and fonts – expressed as a percentage score. This is a perceived-quality indicator, not a bandwidth indicator.
- Streaming performance (%): playback of video at three resolutions, scoring load time and stalls during playback.
- nPoints: the composite that determines the barometer winner. nPerf states that it takes into account measured bitrates, latency and the quality-of-experience tests, and that the points awarded for rates and latency are computed on a logarithmic scale in order to better represent user perception.
The logarithmic transformation is the defining feature of this methodology and it is frequently misread. On a logarithmic scale, moving a customer from 5 Mbps to 25 Mbps produces a far larger gain in points than moving another from 500 Mbps to 1,000 Mbps. The practical consequence is that raw gigabit performance cannot buy a barometer win: an operator with spectacular throughput and mediocre browsing, streaming or latency will be beaten by a more balanced competitor. That is precisely what the 2026 world barometer shows, and it is a deliberate design choice to stop symmetrical multi-gigabit tariffs from distorting national averages.
Strengths, limits and biases.
- Strengths: functional tests that map onto what users actually do; a published busy-hour versus idle-hour split; and – uniquely among the four – a like-for-like Wi-Fi versus FTTH comparison for the same operators inside the same scoring system.
- Composite opacity: nPerf publishes the inputs to nPoints and the fact that a logarithmic scale is applied, but not the exact coefficients. Two operators separated by 2,000 nPoints cannot be decomposed into “how much of that was latency” from public data alone. Treat nPoints as a ranking device, not as a diagnostic one.
- Self-selection: the same voluntary-testing bias as Ookla applies, partially offset by the twelve-month window and the busy/idle split.
- Sample composition: the Wi-Fi sample and the FTTH sample are not the same subscriber set, so the gap between them is indicative of the in-home penalty rather than a controlled measurement of it.
2. What the four have in common, and where they diverge
All four measure the same five families of parameter, and then disagree about almost everything else. Every methodology produces a download figure, an upload figure, a latency figure, a browsing or web indicator and a video or streaming indicator. That common core is why their results look comparable at first glance, and why they are so often misused.
What is exclusive to each methodology
- Only MedUX measures contracted-speed compliance. Matching the promise requires knowing what the customer bought. No crowdsourced methodology can do this, which means regulatory questions about commercial compliance can only be answered from a controlled panel.
- Only Opensignal publishes a composite reliability score with connectivity, completion and sufficiency as separate components. It is the only metric in the set that asks “did the household fail to connect at all”, which is invisible to a probe that is always connected and to a test the user never launched.
- Only Ookla systematically publishes latency under load. Bufferbloat is the most common cause of a gigabit line feeling slow, and three of the four methodologies do not describe it in their public outputs.
- Only nPerf publishes an operator-level Wi-Fi index alongside an FTTH index in the same scoring system. That single design decision makes the in-home penalty quantifiable from public data.
Which one measures what best
- Physical network capacity and commercial compliance: MedUX. Cabled probes remove every variable the operator does not control, which is exactly what an engineering or regulatory audit needs.
- Real in-home experience, including the router: Opensignal. It is the closest proxy available for the reason a customer calls the contact centre.
- Peak capacity of the local loop and behaviour under saturation: Ookla. Largest sample, local endpoints, and the only public loaded-latency series.
- Balanced functional quality of everyday sessions: nPerf. The logarithmic composite plus full-page browsing and multi-resolution streaming is the closest thing to an everyday-use index.
- Stability and consistency: a split decision. Opensignal reliability and consistent quality measure whether sessions clear task thresholds; Ookla consistency measures whether samples clear a speed floor; MedUX qualifiers measure whether tests complete without error. All three are called consistency and none of them is the same quantity.
Why the same operator lands in very different positions
Four structural causes explain essentially all of the divergence, and none of them is a measurement error.
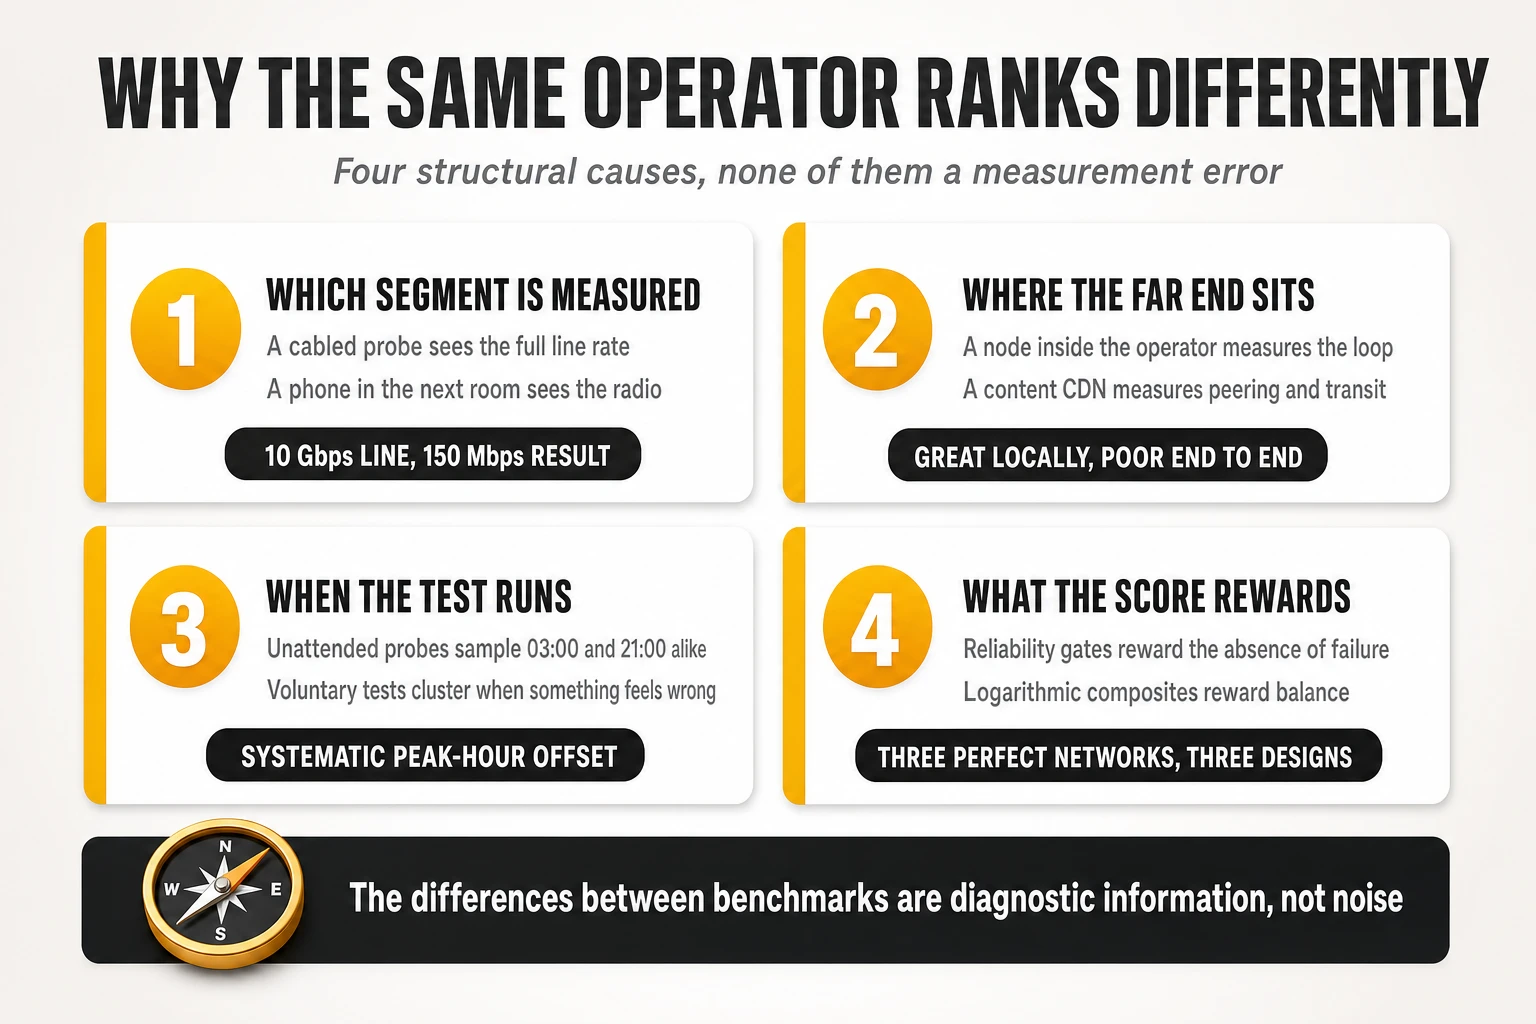
- Which physical segment is inside the measurement. An operator that deploys XGS-PON at 10 Gbps symmetric and then ships a single-band Wi-Fi 5 router will be measured at the full line rate by a cabled probe and at 100 to 150 Mbps by a smartphone in the next room. The same network, correctly measured twice, produces a leadership position and a bottom-quartile position.
- Where the far end of the test sits. A node inside the operator’s autonomous system measures the access line. A commercial CDN on the other side of the peering edge measures the access line plus transit, peering and caching strategy. An operator with an excellent local loop and a saturated interconnect wins the first test and loses the second.
- When the test runs, and who decided to run it. Unattended 24/7 measurement samples 03:00 and 21:00 with equal weight. Voluntary testing over-samples the moments when the customer already suspects a problem, and clusters in the evening peak. The gap between the two is not noise; it is a systematic offset whose size depends on how congested the network is at peak.
- What the scoring function rewards. A reliability-gated scorecard where 55% of each service score is a pass/fail threshold rewards the absence of failures. A trimean of percentiles with 90% weight on download rewards raw capacity. A logarithmic composite rewards balance and penalises nothing so much as a high-throughput line with poor browsing. Three different operators can each design the perfect network for one of those functions.
What is comparable, and what should never be compared
- Safe to compare: the same metric, from the same source, for the same market, across consecutive periods. Trend lines within one methodology are the most reliable signal any of these datasets produces.
- Safe to compare with care: operators within one market inside one report, provided the sample shares are similar and the publisher has not declared a statistical tie. If two operators are named joint winners, they are equal; presenting a two-decimal difference as a victory misrepresents the method.
- Never compare directly: absolute speed figures across methodologies. A cabled probe, a smartphone on Wi-Fi and a desktop hitting an in-network server are three different experiments. A 228.6 Mbit/s Opensignal figure and a 564.19 Mb/s nPerf figure are not evidence of a threefold difference in network quality.
- Never compare directly: metrics that share a name but not a definition. Consistent quality, consistency and reliability mean three different things with three different thresholds, and none of them converts into another.
- Never compare directly: composite scores across markets with different tariff structures. nPoints and speed scores reflect the speed tiers sold in a country as much as the engineering behind them.
| Methodological aspect | MedUX | Opensignal | Ookla | nPerf |
| Capture mechanism | Dedicated hardware probes in panel homes | SDK in third-party and own apps | User-initiated tests on web, desktop and mobile | User-initiated tests in apps and embedded web widgets |
| Connection point | Ethernet cable to the router LAN port | Smartphone on home Wi-Fi | End device, Ethernet or Wi-Fi | End device, Ethernet or Wi-Fi |
| Wi-Fi treatment | Fully excluded; measures the line only | Fully included; cannot be separated | Segmentable via device metadata | Published as a separate index per operator |
| Scheduling | Automated 24/7, peak and off-peak | Passive plus automated active bursts, 24h | Voluntary, unscheduled | Voluntary; busy hours 18:00-23:00 split out |
| Test endpoints | Commercial CDNs, OTT and gaming platforms | Commercial CDN application hosts | Lowest-RTT node, often inside the ISP or at an IXP | Dedicated high-capacity server fleet |
| Headline composite | Global score 0-5 from service opinion scores | None; metrics published separately | Speed Score (9:1 download:upload, trimean P10/P50/P90 at 1:8:1) | nPoints, logarithmic on rates and latency |
| Reliability construct | Qualifier KPI = 55% of every service score | Reliability 100-1,000 and consistent quality % | Consistency: % of samples above 25/3 Mbps | Embedded in browsing and streaming scores |
| Latency under load | Implicit in multi-thread tests | Implicit in sufficiency thresholds | Published explicitly, download and upload | Not broken out publicly |
| Sample normalisation | Panel weighted by technology and speed tier | One device, one vote | Unified daily samples; modern-chipset filter | Validity filtering over a 12-month cycle |
| Inclusion threshold | Panel design | Statistical significance of the sample | 3% of national samples; no virtual operators | More than 5% of national tests |
| Winner rule | Highest aggregated score | Non-overlapping 95% confidence intervals, else a tie | Significance testing with a material effect size | Highest nPoints |
| Best used for | Engineering audit and commercial compliance | Perceived household experience | Capacity and behaviour under saturation | Balanced everyday functional quality |
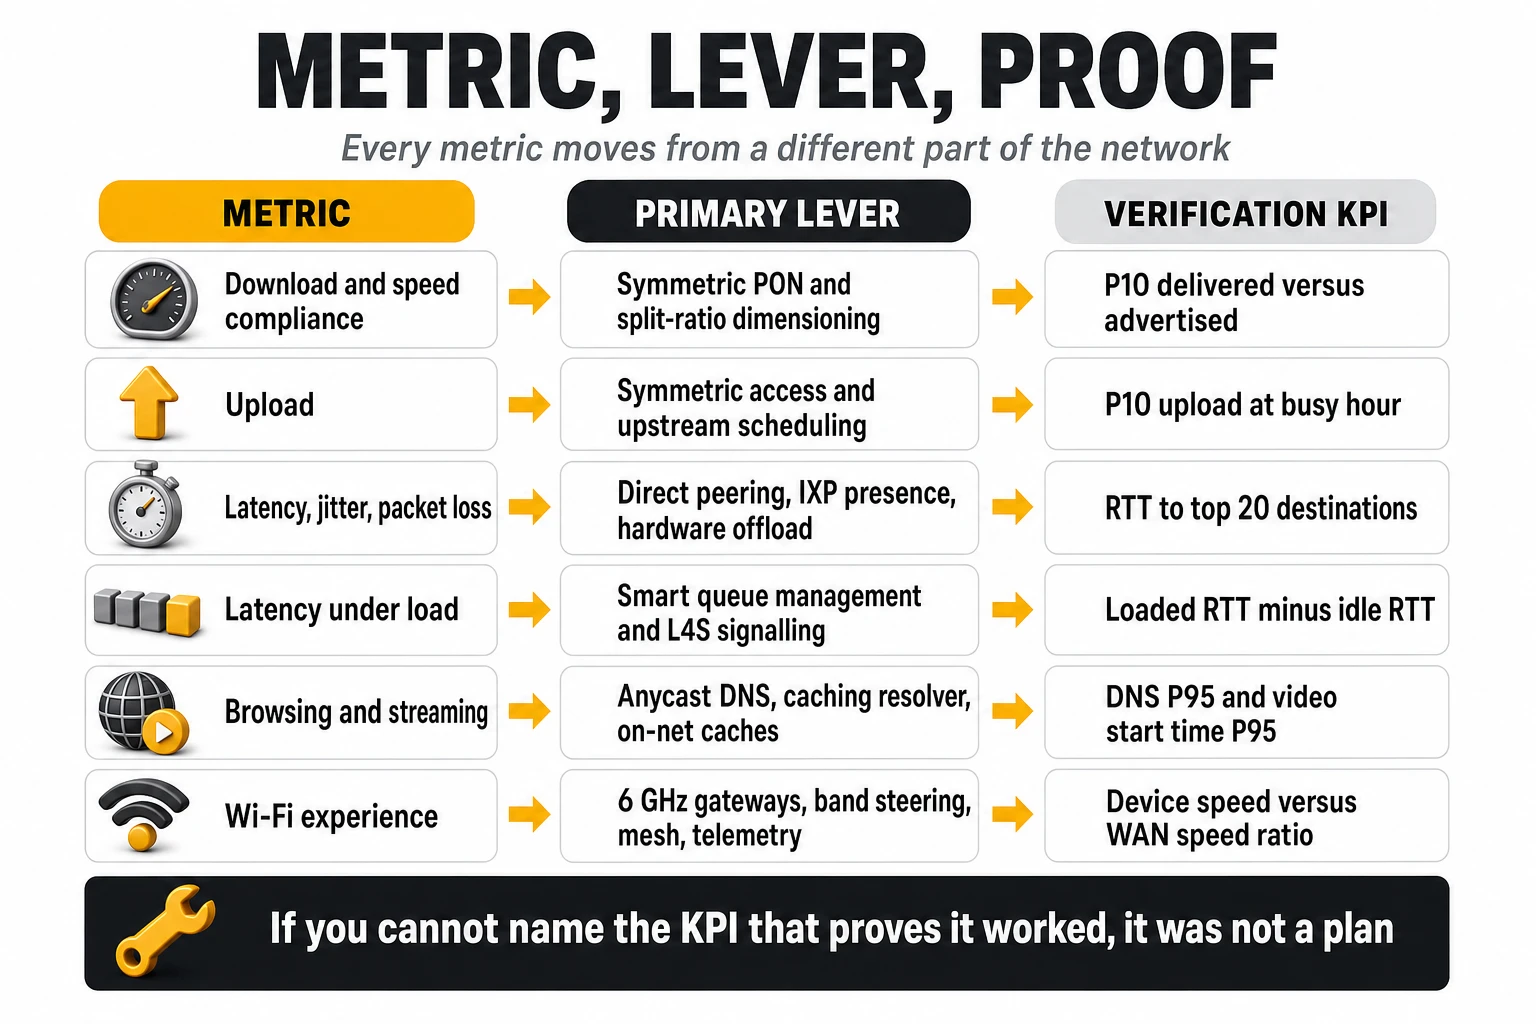
3. How to move each metric: levers, and the KPI that proves it worked
Each metric responds to a different part of the network, and the most common engineering mistake is spending capital on the wrong segment. Adding capacity to an aggregation ring will not fix a browsing score dominated by DNS resolution time, and replacing routers will not fix an upload figure constrained by a GPON split ratio. What follows maps every metric the four methodologies publish to the levers that actually move it, and to the internal indicator that confirms the change landed.
Download speed and contracted-speed compliance
Headline download is set by the access technology, but compliance is set by dimensioning. A 1 Gbps tariff on GPON shared across 32 or 64 subscribers will meet its advertised rate at 04:00 and miss it at 21:00 if the split is overloaded, and that single behaviour damages three different metrics at once: matching the promise, speed score percentiles and busy-hour barometer averages.
- Access layer: migrate optical line terminals from GPON to XGS-PON with symmetric 10 Gbps capability, and manage split ratios as a dimensioning variable rather than a deployment default. Where copper remains, the honest lever is migration, not optimisation.
- Aggregation and backhaul: set busy-hour utilisation ceilings per PON port, per OLT uplink and per aggregation ring, and trigger capacity works automatically when the ceiling is crossed for a defined number of consecutive days rather than when complaints arrive.
- Provisioning integrity: audit the rate-limiting profile applied to each subscriber against the tariff sold. Mismatched profiles after tier changes are a recurring and entirely self-inflicted source of compliance failures.
- Test-node strategy: host high-capacity measurement nodes inside the operator’s own autonomous system and at neutral exchange points, so that a customer running a speed test is not throttled by a third-party transit path that has nothing to do with the product sold.
Watch: delivered-versus-advertised ratio at the 10th percentile (not the average), busy-hour PON port utilisation distribution, and the share of subscribers whose measured rate falls below 80% of tariff for more than three consecutive days.
Upload speed
Upload is now the clearest technology discriminator in every dataset, and the gap is enormous. In the US measurements for the first quarter of 2026, the fibre operator delivered 120.0 Mbit/s upstream against 46.9 and 26.8 for the two cable operators – a two-and-a-half to four-and-a-half times advantage that no amount of downstream capacity compensates. Cable is closing the gap fast (upload grew 20% and 36% year on year for the two largest US cable operators), but the architectural asymmetry remains.
- Symmetric PON: XGS-PON removes the upstream ceiling structurally. On GPON, the 2.5/1.25 Gbps asymmetry combined with high split ratios makes upstream the first thing to congest in the evening.
- Cable plant: mid-split or high-split upgrades, and DOCSIS 4.0 where the economics allow. These are capital-heavy and slow, which is why upload is the metric where fibre operators should be most aggressive commercially.
- Upstream scheduling: review dynamic bandwidth allocation parameters on the OLT; conservative default schedulers leave measurable upstream capacity unused.
- CPE processing: an underpowered gateway can cap upstream throughput before the access network does, particularly with NAT and firewall processing done in software.
Watch: upstream utilisation per PON tree at busy hour, the 10th percentile of upload speed (which is where cloud backup and video calls break), and upload speed segmented by CPE model.
Idle latency, jitter and packet loss
Idle latency is a routing and interconnection problem far more often than an access problem. On fibre, the access segment to the OLT contributes very little delay; the difference between an operator at 7.82 ms and one at 28 ms in the same barometer is built in the IP path, the peering strategy and the position of the content. Jitter, meanwhile, is frequently manufactured inside the customer’s own gateway.
- Peering and interconnection: direct private interconnects with the largest content and platform networks, plus presence at the main exchange points, remove transit hops and the congestion that comes with them. This is the highest-leverage latency action available to most operators, and it is commercial as much as technical.
- Edge caching: hosting content caches inside the operator’s own points of presence moves the content itself closer to the customer, cutting both latency and transit cost.
- Routing hygiene: traffic engineering that avoids tromboning traffic through a distant core, and regular audits of which destinations are being reached over transit when a direct path exists.
- CPE jitter: enabling hardware acceleration for NAT and routing in the gateway chipset removes per-packet CPU interrupt handling. Industry measurements put the improvement at roughly three milliseconds of internal jitter down to sub-millisecond levels, which is invisible on a speed test and decisive on a consistency threshold of 12 ms.
- Packet loss: in fibre networks, persistent loss is usually a symptom – a failing optical module, a duplex mismatch, a saturated uplink or a faulty drop cable – not a design parameter. It should be managed as an alarm condition, not an average.
Watch: round-trip time to the top twenty destinations by traffic volume, the ratio of traffic served from on-net caches and direct peering versus transit, jitter distribution by CPE model and firmware, and loss events per subscriber line per month.
Latency under load: the metric that decides how fast a network feels
Bufferbloat is the gap between a network that tests well and a network that feels good. When a line saturates, oversized buffers in the gateway and in the access node fill with packets, and round-trip time for every other flow in the house collapses from tens of milliseconds to hundreds. The video call freezes while somebody uploads a file, on a gigabit connection, and every diagnostic the customer can run says the line is fine.
- Active queue management: deploy modern queueing disciplines – the fair-queueing CoDel family or CAKE – on the WAN interface of the gateway and on access line cards. This is a firmware and configuration change, not a capital project, and it is the single highest return-on-effort action in this entire article.
- L4S and explicit congestion notification: the low latency, low loss, scalable throughput architecture lets congestion be signalled rather than inflicted. Comcast’s field trials, run with device and platform partners including Apple, Nvidia and Valve, reported working latency reductions of around 75%, targeting the sub-10 millisecond range for marked traffic against the dozens to hundreds of milliseconds typical under load.
- Buffer sizing discipline: audit default buffer configurations on OLTs, broadband network gateways and CPE. Defaults are frequently tuned for throughput benchmarks, which is precisely the wrong objective.
Watch: the delta between idle round-trip time and round-trip time at full download and full upload, measured per CPE model and per access technology. If that delta exceeds 30 to 50 ms, the network has a bufferbloat problem regardless of how good the speed test looks.
Reliability, availability and consistency
These three metrics reward the absence of bad events, which makes them the hardest to improve and the most valuable to own. A reliability score built from connectivity, completion and sufficiency cannot be raised by making good sessions better; it can only be raised by eliminating failures and by lifting the worst sessions above the threshold. The distributional consequence is important: chasing the median is useless here, and every point of improvement comes from the bottom decile.
- Eliminate the failure tail: identify the subscriber lines that generate a disproportionate share of failed sessions – typically a small percentage of the base with a degraded drop, a marginal optical budget, an overheating gateway or an ageing power supply – and fix them proactively.
- Design for sufficiency thresholds: since the binding constraints are 25 Mbps down, 3 Mbps up, 50 ms latency, 12 ms jitter and 0.8 s time to first byte, the engineering question is not “what is our average” but “what percentage of sessions fails any one of these five”.
- Power and resilience: mains interruptions register as connectivity failures. Battery backup in aggregation sites and, in some markets, in the home gateway, converts directly into reliability points.
- Change management: a meaningful share of reliability degradation is self-inflicted through firmware pushes, configuration changes and maintenance windows. Canary deployment on a small subscriber cohort with automated rollback is cheaper than a lost award.
Watch: session failure rate per thousand attempts, share of sessions failing each individual threshold (so you know which of the five is binding), unplanned outage minutes per subscriber, and the reliability delta between the best and worst CPE model in the fleet.
Web browsing: a DNS and time-to-first-byte problem
Browsing scores are almost never limited by bandwidth above 100 Mbps. A modern page load is dozens of small object fetches across several domains, so the score is dominated by name resolution, connection setup and time to first byte. This is why an operator can lead every speed table in a country and still finish last in browsing – which is exactly the pattern the barometers show when raw throughput leaders sit at the bottom of the browsing column.
- Anycast DNS with geographic distribution: resolve queries at the nearest node rather than at a central farm. Resolution time is a direct multiplier on every page load.
- Local caching resolver in the gateway: a lightweight caching resolver in CPE firmware, with pre-fetching of the most requested domains, moves typical resolution for popular destinations from tens of milliseconds to near zero. Industry estimates put the reduction at 35 to 50 ms down to low single-digit milliseconds for cached entries.
- Resolver capacity at peak: DNS infrastructure is frequently dimensioned on average query rates and then falls over in the evening peak, producing exactly the degradation a busy-hour benchmark is designed to catch.
- TLS and connection setup: support for modern transport and session resumption reduces handshake round trips; on a high-latency path this is worth more than extra bandwidth.
Watch: DNS resolution time at the 50th and 95th percentiles at busy hour, time to first byte for the twenty most visited local sites, and full page load time distribution rather than mean.
Video streaming
Streaming scores are decided by where the content sits, not by how fast the line is. Every streaming model in these methodologies rewards the same three things: how quickly playback starts, whether it stalls, and what resolution is sustained. All three are functions of the distance and capacity between the player and the content server, and adaptive bitrate algorithms punish variable throughput more than they punish low throughput.
- On-net content caches: deploying the major platforms’ caching appliances inside regional points of presence is the decisive lever. It removes the transit path from the critical section entirely, which cuts startup time and eliminates peak-hour stalls.
- Direct peering with video platforms: where a cache is not available, a direct interconnect with the platform is the next best option. The South African operator that swept all five Opensignal categories in the first quarter of 2026 credits its accreditation as a Google peering provider for its video experience ranking – a concrete, attributable link between an interconnection decision and a benchmark result.
- Throughput stability over peak throughput: an adaptive player will hold 1080p on a stable 15 Mbps path and oscillate between resolutions on an unstable 200 Mbps path. Variance is the enemy, which points back to queue management and congestion control.
Watch: video start time at the 95th percentile, stall rate per thousand playbacks, percentage of session time at the highest resolution, and the share of video bytes served from on-net caches.
Gaming
Gaming metrics are a latency, jitter and loss test pointed at specific destinations. Because the test targets the live infrastructure of the major game platforms, the result is a direct audit of how the operator routes to those specific autonomous systems, and nothing else. Bandwidth is essentially irrelevant: competitive titles consume single-digit megabits.
- Direct interconnection with game platforms: the named targets of these tests are a short list. Establishing direct paths to them is a finite, executable project rather than an open-ended programme.
- Jitter control end to end: gateway hardware acceleration, active queue management and avoiding asymmetric routing matter more than absolute round-trip time once latency is below about 30 ms.
- Low-latency traffic handling: the L4S mechanisms that fix bufferbloat also protect interactive traffic from the household’s own bulk transfers, which is the scenario in which gamers actually complain.
Watch: round-trip time and jitter to each major gaming platform by region, packet loss during peak hours, and the difference between idle and loaded latency on lines with gaming traffic.
Wi-Fi experience: the segment that decides two of the four benchmarks
The home radio is where most of the measurable customer experience is now won or lost. Opensignal measures nothing else; nPerf publishes it as its own index; Ookla mixes it into mobile-device samples. Only MedUX excludes it. An operator that treats the gateway as a commodity is effectively conceding two and a half of the four benchmarks before measurement begins.
- Generational upgrade of the installed base: replacing Wi-Fi 5 gateways with Wi-Fi 6, 6E or 7 equipment with 6 GHz support, wide channels and multi-link operation is the largest single step available. Industry estimates for the throughput a smartphone actually achieves put single-band Wi-Fi 5 gateways in the 100 to 150 Mbps range against several hundred megabits for current generations, which is the difference between a gigabit product measuring like a gigabit product and measuring like a mid-tier one.
- Band steering and channel management: automatic steering of capable devices to 5 GHz and 6 GHz when signal strength allows, plus dynamic channel selection that reacts to neighbouring networks, prevents tests from running on the most congested band in the building.
- Mesh where the floor plan demands it: coverage extension with wired or dedicated-backhaul mesh nodes, provisioned on the basis of measured coverage rather than customer complaint, addresses the multi-room failures that surveys consistently identify.
- Router placement: the cheapest intervention in this list and the most neglected. Installation standards that forbid placing the gateway inside a cabinet, behind a television or on the floor in a corner are worth more than a firmware release.
- In-home telemetry: standardised device management through the user services platform framework (TR-369/USP) gives per-device, per-band visibility of signal strength, channel utilisation, retransmissions and airtime, which is what converts Wi-Fi from an anecdote into an operable network.
Watch: share of the installed base by Wi-Fi generation; percentage of connected devices attached to 2.4 GHz despite being capable of 5 or 6 GHz; median airtime utilisation per radio at busy hour; percentage of homes with at least one room below a defined signal threshold; and the ratio between the speed measured at the gateway WAN port and the speed measured at the device.
The operating layer: telemetry, automation and applied AI
None of the levers above holds its value without an operating layer that detects degradation before the customer does. The benchmarks are published quarterly or annually; the degradations that damage them happen daily and locally. An operator that discovers a problem when the report lands has already lost two quarters of measurement.
- Synthetic monitoring that mirrors the benchmarks: run your own probe fleet executing the same test families against the same endpoint types, so that the published report contains no surprises. This is the single most effective governance mechanism available, and the cheapest.
- Continuous CPE and Wi-Fi telemetry: standardised, always-on collection from the gateway is the raw material for everything else. Without per-home data there is no proactive care, only reactive support.
- Anomaly detection and closed-loop tuning: automated detection of degradation patterns – a PON tree drifting, a firmware version raising jitter, a channel plan collapsing in a dense building – with automated remediation where the action is safe and reversible.
- Preventive replacement: optical modules, power supplies and gateways with known failure signatures replaced before they fail, driven by telemetry rather than by age.
- Remote diagnosis before dispatch: the ability to determine from the operations centre whether a fault is in the line, the gateway or the radio removes both truck rolls and the misattribution that leads to fixing the wrong segment.
The measurement path itself: on-net test nodes, sampling artefacts and where the line sits
A measured result is a property of the network and of the path the measurement took, and the second half of that sentence is a legitimate object of engineering up to a clearly definable point. Hosting high-capacity test nodes inside the operator’s own autonomous system and at neutral exchange points is ordinary good practice: it ensures a customer running a speed test is measuring the product they bought rather than a third-party transit path that was never part of it. Every major measurement company publishes a server-hosting programme for precisely this reason. Beyond that, the ground gets less solid, and it is worth being explicit about where.
- The auditor’s own endpoint placement: a crowdsourced test server hosted behind a security or scrubbing platform, or on an address range affected by blocking infrastructure, will penalise whichever operators route through that platform, for reasons unrelated to the network under test. This is worth raising with the measurement company, with path measurements attached. It is a data quality issue on their side, not a network defect on yours.
- Sampling concentration in user-initiated tests: where a test is voluntary and unweighted, a small number of very active testers can move a national figure. Regulator-operated speed tests are particularly exposed, because participation is self-selected and there is rarely a cap per subscriber. An operator seeing an unexplained shift should check the test-volume distribution before it commissions engineering work.
- Device mix as a confounder: a gateway refresh programme changes a crowdsourced result before it changes anything in the network, because the sample is measured over the new radio. That is a genuine improvement in customer experience and a misleading attribution if it is reported internally as a network gain. The same applies in reverse when a new access technology is launched to a self-selecting early-adopter base.
- Endpoint reachability audits: knowing the round-trip time from your network to every endpoint each auditor uses is basic hygiene, and it occasionally surfaces a routing defect that is costing real customers real milliseconds. That is the legitimate version of this work, and it usually pays for itself the first time it runs.
The line is simple enough to state in one sentence. Engineering the network so that measurements reflect delivered quality is the entire point of a quality programme. Engineering the sample so that measurements stop reflecting delivered quality is misrepresentation, and it fails the only test that matters: whether the operator would be comfortable if the auditor published the method alongside the score. Everything in this article sits on the first side of that line, and nothing in it requires the second.
Watch: round-trip time from your network to each auditor’s endpoint set; distribution of test volume per subscriber for user-initiated methodologies; share of measured samples by CPE generation, tracked alongside any refresh programme; and the delta between your own synthetic probe results and each published external result.
| Metric | Primary levers | Verification KPI |
| Download speed | XGS-PON migration, split ratio management, busy-hour capacity ceilings, provisioning audit | P10 delivered/advertised ratio; PON port utilisation at peak |
| Upload speed | Symmetric PON, cable high-split, upstream scheduling, CPE processing capacity | P10 upload; upstream utilisation per tree; upload by CPE model |
| Idle latency | Direct peering, IXP presence, on-net caches, routing hygiene | RTT to top 20 destinations; on-net and peered traffic share |
| Jitter | Gateway hardware acceleration, queue management, symmetric routing | Jitter distribution by CPE model and firmware |
| Packet loss | Optical budget audits, uplink capacity, faulty drop replacement | Loss events per line per month |
| Latency under load | FQ-CoDel or CAKE on WAN and line cards, L4S and ECN, buffer audit | Loaded minus idle RTT, download and upload |
| Reliability and availability | Failure-tail remediation, power resilience, canary change management | Session failure rate; outage minutes per subscriber |
| Consistency | Raising the bottom decile above each threshold | Share of sessions failing each individual threshold |
| Web browsing | Anycast DNS, caching resolver in CPE, peak resolver capacity, TLS tuning | DNS P95 at busy hour; TTFB on top local sites |
| Streaming | On-net caches, direct peering with platforms, throughput stability | P95 start time; stalls per thousand playbacks; cache hit ratio |
| Gaming | Direct paths to game platforms, jitter control, low-latency queueing | RTT and jitter per platform; loaded-latency delta |
| Wi-Fi experience | Wi-Fi 6/6E/7 refresh, band steering, mesh, placement standards, telemetry | Device speed versus WAN speed ratio; airtime utilisation; 2.4 GHz attach rate |
| DNS resolution time | Regional recursive resolvers on anycast, caching resolver in CPE, filtering policy executed on-net, stub zones for badly placed authoritative servers | Cached resolution P50 and P95 per region; authoritative RTT per top destination |
| Path length to content | Regional caches, direct interconnection, per-destination latency monitoring, route policy overrides | RTT per destination group; share of destinations on a path more than 50% slower than the best available |
| Function placement | Distribution of resolvers, carrier address translation and subscriber user planes into the regional layer, on a platform that makes the next function cheap | Share of traffic breaking out inside the customer region; marginal cost and lead time to place one more function in a site |
4. Distributing the network: the latency budget and where the functions sit
Every lever in the previous section assumes the function being tuned is already close to the customer. In most networks it is not. Two decades of consolidation put the recursive resolvers, the address translation, the subscriber user plane, the security platforms and the content itself into two or three national sites, because that was the cheapest way to operate them and because access capacity was the binding constraint on experience. Access capacity stopped being the binding constraint somewhere around the first gigabit tariff. What remains is distance, and distance is a placement decision.
This is the part of a quality programme that never appears in a speed test and decides most of what a customer feels. What follows covers how to build a latency budget, why the access network is almost never the answer, and what happens to each benchmark metric when the resolver, the address translation, the user plane, the filtering policy and the content itself move from the national core into the regional layer. It ends with the part that determines whether any of it is affordable: the platform those distributed functions run on, and the sequencing mistake that doubles the cost of the entire programme.
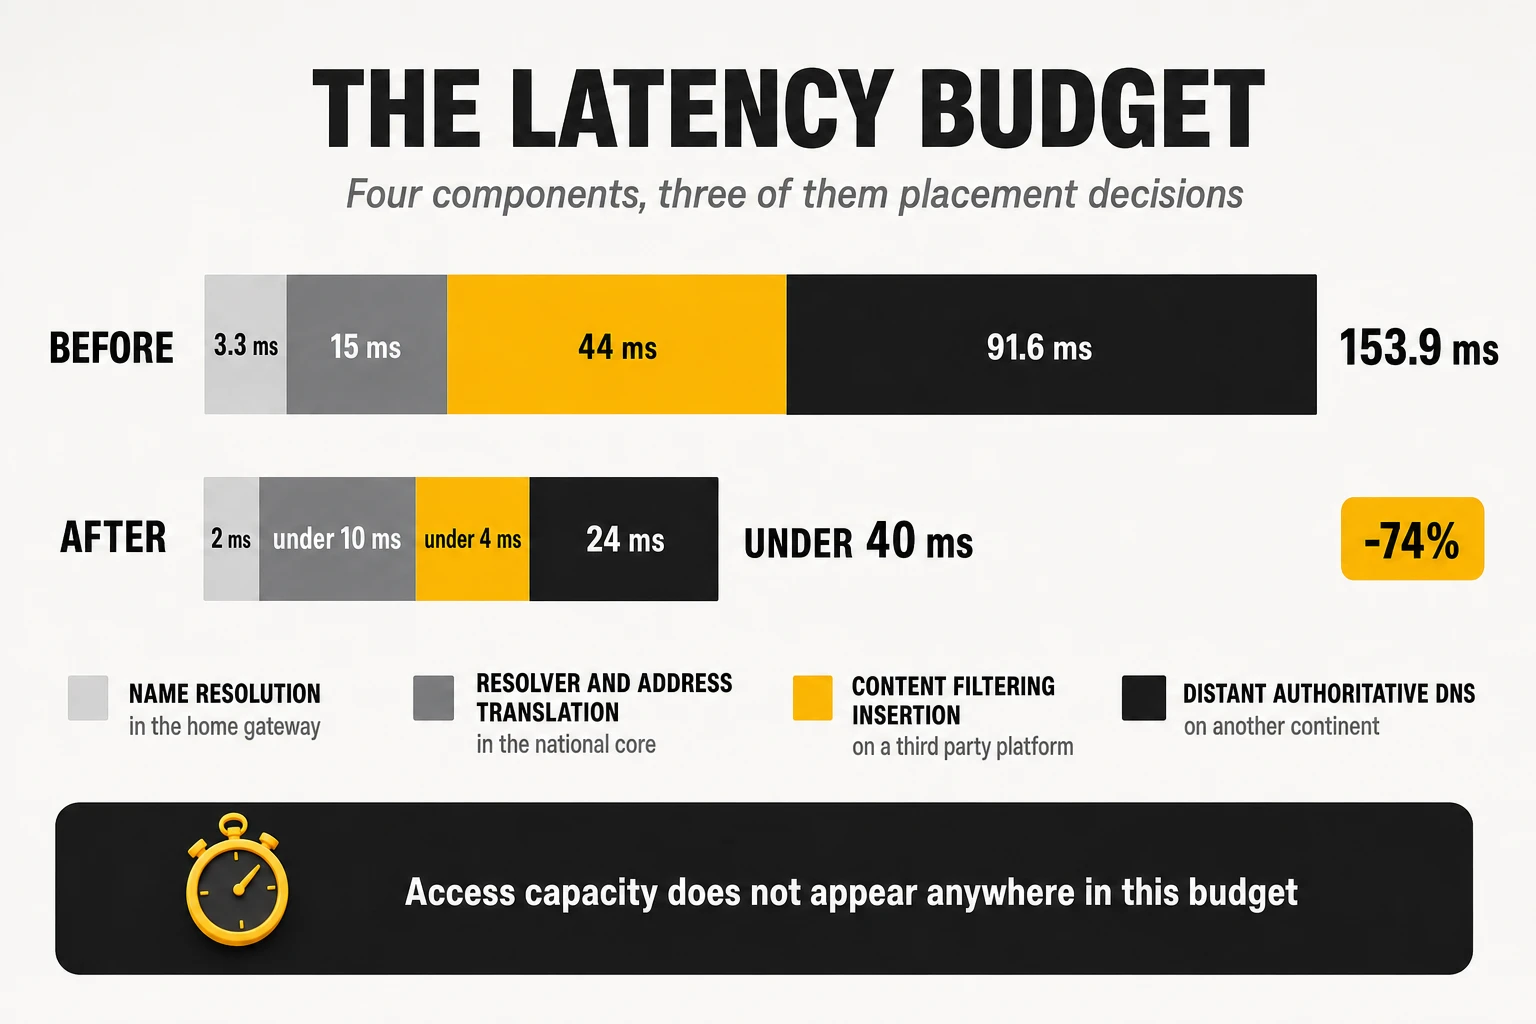
Start with a latency budget, not a capacity plan
The first artefact of a serious quality programme is a decomposition of one ordinary session into its delay components, with an owner against each line. Not an average round-trip time to a reference server, which hides everything that matters, but the full sequence a customer triggers by opening a page: the gateway resolves a name, the query reaches a recursive resolver, the resolver applies whatever policy the operator has inserted, the resolver reaches an authoritative server that may be on another continent, and only then does the first byte of content begin to move. Each of those steps has a location, a millisecond cost and a department that owns it, and in most operators no single document puts the three together.
A worked example from an operator distribution programme documented in 2026 shows what the decomposition usually reveals. The figures below come from a real national programme, anonymised and not independently published, so they should be read as the shape of the problem rather than as a benchmark. The shape is the point: the largest single component sits outside the operator’s network, the second largest is a service the operator inserted into its own path, and access capacity does not appear at all.
| Component of the path | Before | After | What moved it |
| Name resolution inside the home gateway | 3.3 ms | 2 ms | Caching resolver enabled in CPE firmware |
| Recursive resolver plus carrier address translation | 15 ms | Under 10 ms | Resolver instances moved into the regional layer, translation moved with them |
| Content filtering and security insertion | 44 ms | Under 4 ms | Filtering policy executed on the operator’s own resolvers instead of a third-party platform |
| Reaching the destination’s authoritative DNS | 91.6 ms | 24 ms | Interconnection and route policy work on the paths to those authoritative servers |
| Accumulated access-to-content latency | 153.9 ms | Under 40 ms | Reduction of roughly 74% |
Three conclusions follow from any budget built this way, and they are why the exercise is worth a quarter of somebody’s time. The first is that the biggest number is usually not yours: the distance to a destination’s authoritative name servers and origin infrastructure dominates, and it is addressed by interconnection and route policy rather than by capital works. The second is that operators insert a surprising quantity of their own latency, through filtering platforms, security services and blocking infrastructure procured by teams that were never given a latency target. The third is that the components respond to completely different actions – firmware, placement, contract negotiation, route policy – which is exactly why one budget with named owners beats four departmental roadmaps that never intersect.
Watch: a monthly latency budget per region with one line per component and one named owner per line; the ratio of operator-controlled to externally controlled milliseconds; and the delta between the budget’s modelled total and the measured time to first byte for the twenty most requested destinations.
The access network is not where your milliseconds are, and you should prove it
Before a distribution programme can be funded, somebody will argue that the problem is really in the access network, and that argument has to be closed with measurements rather than with opinion. Characterising the per-element delay of the access and aggregation chain in a laboratory is cheap, takes weeks rather than quarters, and produces a number that ends the conversation permanently. On a modern fibre network the answer is consistent across vendors and technologies: the access elements contribute microseconds to hundreds of microseconds, while the components in the latency budget above contribute tens of milliseconds.
- Upstream scheduling on the PON: the report-and-grant cycle of dynamic bandwidth allocation is the largest structural delay in the access segment, and published work on low-latency allocation schemes puts it in the range of several hundred microseconds – which is why it matters for mobile fronthaul carried over the same fibre and is irrelevant to a browsing score. Cooperative and low-latency schedulers are worth deploying where mobile transport shares the PON. They are not a broadband quality lever.
- Broadband network gateway forwarding: laboratory characterisation of two vendor platforms carrying 4,000 PPPoE sessions at 90% utilisation of 10 Gbps interfaces measured added latency of roughly 17 and 34 microseconds respectively. That is a two-times difference between vendors, and it is invisible next to a 40 millisecond insertion elsewhere in the same path.
- Optical line terminal profiles: the profiles that maximise throughput are not always the profiles that minimise delay, and default configurations are frequently tuned for the first. Worth auditing because it is free; the recoverable delay is sub-millisecond.
- The gateway itself: the one access-side element that genuinely moves tens of milliseconds, through software packet processing, absent hardware offload and oversized buffers. It belongs to the device programme covered in section 3, not to the access programme.
The organisational value of this measurement exceeds its engineering value. A published internal characterisation of the access chain converts an argument about where to spend into an arithmetic problem, and it protects a distribution programme from the standing institutional preference for buying access equipment. It also does the reverse service: when the access chain genuinely is the problem – an overloaded split, a saturated uplink, a misapplied rate profile – the same instrumentation finds it in days.
Lever one: distribute the recursive resolver
The recursive resolver moves first because it is the cheapest function to distribute and the one whose delay multiplies across everything else. A modern page is dozens of object fetches across several domains, and every domain that is not already cached costs a full resolution before any byte of that object moves. Research on page load composition attributes up to 13% of the critical path delay of a page load to queries for uncached names at the recursive resolver. That is a multiplier on browsing scores, on time to first byte, on video start time and on the social media test families that two of the four methodologies weight heavily.
The typical starting point is two to four national resolver sites, and the typical symptom is a latency spread the operator cannot see from the core. In the programme cited above, cached resolution ranged from 0.9 ms in the regions co-located with the resolver farms to 15 ms in the distant ones, and reached 27 ms for an island region – a thirty-fold spread on the same product, invisible in any national average, and immediately visible to any benchmark that samples by region. The redesign targeted under 10 ms of median cached resolution in every region, achieved by adding resolver instances in regional aggregation sites while keeping the original national sites as mutual global backup.
- Anycast addressing with regional instances: one resolver address answered by the nearest healthy instance is what makes distribution invisible to provisioning and to the installed base of gateways. Without it, every redistribution becomes a configuration campaign across millions of devices.
- Cache warmth as a design variable: splitting one large cache into many small ones lowers the hit ratio of each. Distribution buys round-trip time and spends cache efficiency, and the net gain depends on query volume per site. Pre-fetching the most requested domains and tiering regional resolvers behind a national cache recovers most of it.
- Load balancer capacity is the real constraint: the front end of a resolver farm is where distribution programmes stall. Virtualised balancers dimensioned for a centralised design frequently cannot scale to the distributed one, and the pattern among operators that have completed this work is to move that specific function to bare metal. Certification of the balancer, and the availability of the right line cards and optics for it, then become gating dependencies of the whole programme – an unglamorous sentence that has delayed more than one national rollout by a year.
- Capacity dimensioned on the peak, not the mean: resolver infrastructure sized on average query rates falls over in the evening, which is precisely the hour an unattended probe fleet is sampling.
Watch: median and 95th-percentile cached resolution time per region at busy hour; the number of regions above the 10 ms target; cache hit ratio per instance before and after distribution; and resolver CPU and query rate at the evening peak rather than at the daily mean.
Lever two: move the address translation and the subscriber user plane with it
Distributing the resolver and leaving the address translation in the national core is the most reliable way to spend a distribution budget and measure nothing. If a fifth of a customer base sits behind carrier-grade address translation and that translation happens in two national clusters, then for those subscribers every session still travels to the core before it can leave the network, whatever the resolver did. The resolver moved. The path did not.
The distinction that matters is between processing delay and geographic delay, and the public evidence is clear about which one is the problem. Controlled testing of carrier-grade translation behaviour reported to the IETF found no significant difference in latency or jitter with the translation device in the path compared with without it. The device is not slow. Its location is. A translation function 600 kilometres from the subscriber adds the round trip to that location to every flow that traverses it, and no amount of faster silicon recovers propagation delay.
- Sequence the translation clusters against the resolver sites: the two programmes should share a site list and a calendar. A region that gets a resolver and not a translation cluster gets a fraction of the benefit, and the published result will look like the distribution did not work.
- Separate the control and user planes of the broadband gateway: control and user plane separation is what makes distribution operationally sane – user planes close to subscribers, one control plane managed centrally. Vendors have shipped disaggregated designs for several years, and Dell’Oro projects that close to half of all new broadband gateway subscriber licences by 2030 will sit on edge-router-integrated gateways rather than on centralised chassis.
- Converged operators should place the residential and fixed-wireless user plane function on the same site list: a converged core that breaks out fixed traffic regionally and mobile traffic nationally produces two different experiences for the same household.
- The cheapest translation capacity is the session that never needs it: native IPv6 coverage removes traffic from the translation path entirely. It is slower to deliver than a new cluster, and it is the only lever in this list that reduces the problem instead of relocating it.
Watch: the share of subscriber traffic whose first hop out of the operator’s network happens inside the customer’s own region; the round-trip-time delta between translated and untranslated subscribers on the same access node; and the share of traffic carried natively over IPv6.
Lever three: interconnection, because AS-path length is not latency
The single most under-monitored defect class in fixed broadband is a route that is perfectly valid, entirely stable and several times slower than an available alternative. Border gateway protocol path selection does not consider delay. It compares local preference first, then the length of the autonomous system path, then a sequence of tie-breakers, none of which is latency, bandwidth or distance. A path across an ocean with three AS hops beats a path across the same city with four. The protocol is behaving exactly as specified, and the customer is paying for it in every interactive session.
The effect has been measured, and the magnitudes are not marginal. A 2025 study of inter-domain path inflation documented a probe in Brazil reaching a virtual machine in South Africa at 254 ms over the selected path against 115 ms over an available alternative, and a probe in Australia reaching a destination in India at 196 ms against 149 ms. The same work found that 9% of vantage points failed to adopt a lower-latency path to a single major cloud region. In a third case, an anycast destination answered a probe in Washington DC from Singapore at over 250 ms when a regional instance two milliseconds away was available.
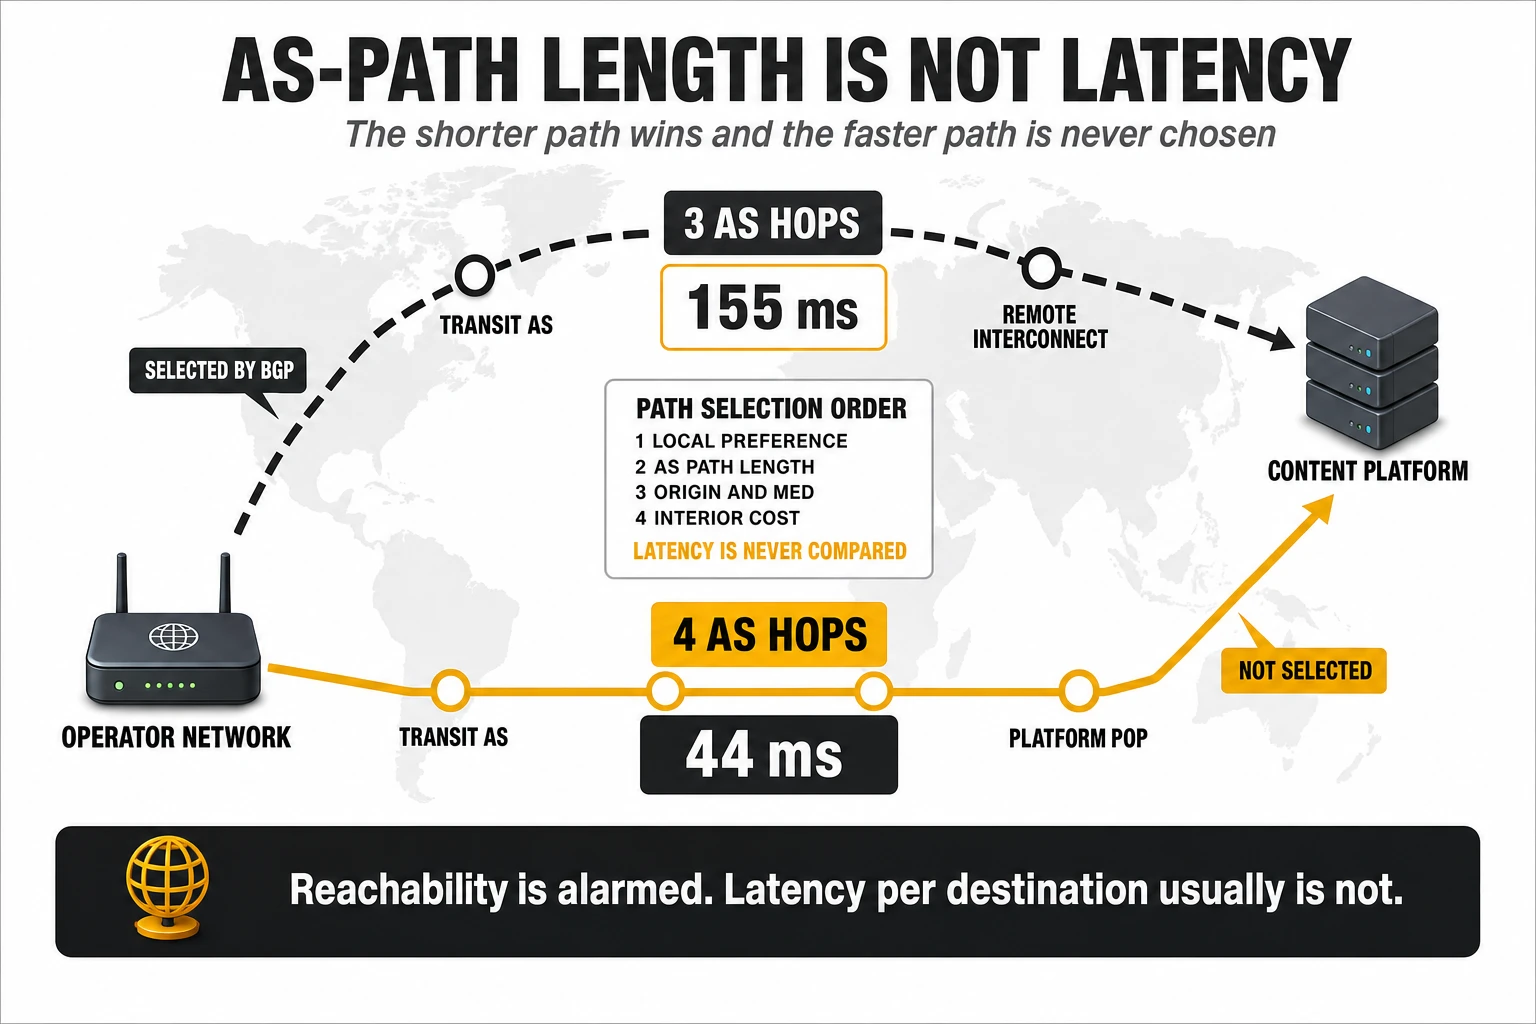
The operator-facing version of this pathology has a specific and recurring shape. A content or platform network hands its prefixes to an operator’s transit provider over a direct interconnect on another continent. That announcement has the shortest AS path, so it wins. The same prefixes are also reachable through a regional exchange with one additional AS hop, at a fraction of the delay, and that path is never selected. Operators discover it when a benchmark reports a gaming or streaming result that no internal metric predicted, because reachability monitoring shows the destination as healthy throughout. Two documented cases from 2026 make the shape concrete. In the first, a transit provider measured an alternative path to a set of authoritative name servers at 44 ms against the 155 ms of the path its own best-path selection had chosen; the remedy was to ask the content network to announce those prefixes over a regional interconnect instead. In the second, traffic to a major gaming platform fell from 95 ms to 25 ms once the transit provider was asked to prefer a route reaching the platform through a European carrier rather than over its own direct interconnect on another continent – a routing policy change with no new capacity involved and no equipment purchased.
- Monitor latency per destination, not reachability per prefix: reachability is a binary every operator already alarms on. Round-trip time to the top destinations by traffic volume and by benchmark relevance is a continuous variable that most operators do not monitor at all, which is why this defect class survives for years without generating a ticket.
- Ask the content network to re-announce: the fastest fix is usually commercial rather than technical. Content networks will generally announce affected prefixes over a regional interconnect when shown the measurement, because the poor path costs them quality too.
- Make route policy a contract item: a transit agreement that specifies availability and capacity but says nothing about per-destination latency has left the most important variable to an algorithm that does not optimise for it. Latency targets per destination group belong in the contract and in the quarterly review.
- Use the policy tools you already own: where the operator controls the decision, local preference and community-based policy override best-path defaults for specific destination groups. This is ordinary traffic engineering that is rarely applied to consumer destinations because nobody owns the metric.
- Build direct paths to the destinations the benchmarks actually name: gaming platforms, the large video platforms and the handful of sites used in browsing tests are a short and stable list. Direct interconnection with them is a finite project, not an open-ended programme.
Watch: round-trip time per destination group, tracked continuously and alarmed on deviation rather than on loss; the number of destination prefixes reached over a path more than 50% slower than the best available alternative; and the share of traffic exchanged at regional exchanges versus national ones.
Lever four: the destination’s own DNS is as far away as the destination
Distributing your resolver is worth very little if the authoritative servers it has to query are on another continent. The authoritative name servers of most large consumer services are themselves hosted on content delivery networks, announced from whichever points of presence the platform chooses, and subject to exactly the same path-selection pathology described above. The difference is where the cost lands: an authoritative lookup happens before the first byte of content, so it is paid in full by time to first byte, video start time and every browsing metric, and it is paid again whenever the record expires.
In the programme cited earlier, authoritative lookups against three high-traffic destinations averaged 91.6 ms and fell to 24 ms after interconnection and route work on those specific paths. Nothing about the operator’s own network changed. What changed was which interconnect the destination’s name servers were reached over – which means the largest line in that latency budget was recovered by a commercial conversation and a routing policy, not by capital expenditure.
- Latency-aware resolver selection needs volume to work: resolvers that learn which authoritative instance is fastest need enough queries per destination to make that decision reliably. Low-volume destinations get arbitrary or stale selections, which is how a site with modest traffic can end up being resolved from another continent while a popular one is resolved locally. The symptom is a browsing metric that degrades on exactly the destinations a benchmark happens to test.
- Configure rather than learn for the destinations that matter: explicit stub zones pointing at the correct regional authoritative instances for the highest-value or lowest-volume destinations replace a statistical decision with a deterministic one. It is a small configuration change that recovers tens of milliseconds on the specific destinations most likely to be sampled.
- Record time-to-live is somebody else’s decision and your problem: destinations that publish very short TTLs force repeated authoritative lookups and defeat resolver caching. It is worth knowing which of your top destinations do this before assuming a distribution programme will fix their numbers.
Watch: authoritative resolution time per top-twenty destination domain; the share of authoritative lookups answered by an instance inside the region or the continent; and the proportion of resolutions that are cache misses, by destination.
Lever five: audit what you inserted into the path yourself
Operators insert a remarkable amount of equipment into their own data path and almost never measure what it costs in delay. Parental control, security and anti-phishing services, advertising filters, legally mandated blocking platforms, distributed denial-of-service scrubbing and transparent proxies are all procured against availability and efficacy requirements. Latency is rarely in the specification, the platforms are frequently operated by third parties outside the operator’s network, and the resulting delay is charged to the network team that did not buy them.
The measured example is worth stating precisely because the magnitude surprises people. In the programme cited above, a name resolution that completed in 3.9 ms end to end when answered from the operator’s own resolver took 41 ms when the customer had the protection service enabled and the answer was not cached: 3.7 ms to reach the operator’s resolver, plus 40 ms for that resolver to consult an external filtering platform. Across the installed base, mean in-home resolution time fell from around 25 ms to under 10 ms with the service disabled. The service was not defective. It was simply hosted somewhere else, and every uncached lookup paid the round trip.
The fix is not to withdraw the service, which customers value and regulators sometimes require. It is to execute the policy on the operator’s own distributed resolvers, which converts a 40 ms external round trip into a local policy lookup, and to put the filtering function on the same site list as the resolver distribution so the two arrive together. Where the function must remain external, the minimum is to interconnect with the provider regionally rather than reaching it over transit – the same lever as the previous section, applied to a supplier instead of a content network.
There is a benchmark-specific version of this problem that is not the operator’s to fix. Measurement companies host their own test endpoints, and those endpoints sometimes sit behind security or scrubbing platforms, or on address ranges affected by blocking infrastructure. When that happens, the measured result degrades for whichever operators route through the affected platform, for reasons that have nothing to do with the network under test. This is a conversation to have with the auditor, with packet captures and path measurements attached, and it is a legitimate one – unlike the adjacent temptation discussed in section 3.
Watch: resolution and page-load time with each opted-in service enabled and disabled, by CPE model; the percentage of the base on each filtering or protection profile; the share of filtered queries answered on-net; and a standing inventory of every element inserted into the consumer data path with its measured delay contribution against its name.
Lever six: push the content down the same hierarchy
On-net caching appears in section 3 as a lever for streaming and browsing; in a distribution programme it is the same decision applied at regional granularity, and the traffic concentration makes the business case unusually simple. Sandvine’s 2024 global internet phenomena report put Google, Meta and Netflix at roughly 65% of all fixed traffic between them, and a top-ten list typically accounts for around 80%. A caching programme is therefore not an open-ended content strategy. It is a finite list of counterparties, most of which already operate embedded-cache programmes, and the engineering question is where inside the network their appliances sit.
What regional caching actually delivers, measured, follows a consistent pattern. In a 2026 deployment across the regional layer of a national network, one large platform ended up serving 59% of its traffic from on-net caches at a 2.2 Tbps peak, with median latency falling from 43 ms to 34 ms, median download throughput rising from 29 Mbps to 33.5 Mbps and mean time between playback interruptions rising 14%. A second platform reached 47.2% of its traffic served from caches, with average round-trip time falling from 45.96 ms to 17.18 ms – a 62.6% reduction – goodput up 9.8% and mean time between rebuffers up 14%. Overall, that operator had roughly 52% of its internet traffic served from on-net caches, with a modelled ceiling near 64% once two further platforms deployed.
Read the shape of those numbers rather than the headline. Latency falls by a fifth to two thirds, throughput rises by a tenth to a sixth, and interruptions fall – and the largest single movement is in round-trip time, which is what streaming, browsing and video-experience models reward most. This is why operators with strong regional cache footprints win streaming metrics without leading on raw throughput, and why a caching programme is the best-value action available to an operator whose access network is already competitive.
- The constraints are physical and contractual, not technical: several platforms ship appliances that require direct-current power, and a regional site wired only for alternating current can block a deployment for a year. Rack space, cooling, floor loading and the appliance supply schedule of the platform itself are the recurring critical-path items. None of them appears on an architecture slide, and all of them decide the calendar.
- Some platforms will not deploy at all: for those, the options are direct interconnection at a regional exchange or multi-tenant capacity through Open Caching, the Streaming Video Technology Alliance specification set that lets an operator offer its own edge capacity to content providers that do not ship hardware. Multi-tenancy on the alliance testbed was demonstrated in 2025, which makes this a practical option for the medium tier of the traffic list rather than a standards aspiration.
- Caching and the transit contract are one negotiation, not two: flat-rate or franchise-based transit agreements are priced against a projected traffic curve. A successful caching programme moves actual volume below that curve, and the operator ends up paying for committed capacity the caches made unnecessary. Operators that run the two roadmaps in separate departments fund the same traffic twice, and the effect is large enough to swallow the savings the caching programme was approved on.
- Traffic with a local origin is not necessarily on-net traffic: content handed over by a wholesale carrier inside the same country still crosses an interconnect and still carries the delay of whichever site that handover happens in. Counting it as domestic traffic overstates the cache footprint and hides a distribution opportunity.
Watch: share of internet traffic served from on-net caches, by platform and by region; cache hit ratio per appliance cluster; round-trip time and median throughput for each platform, cached against interconnected; and the gap between committed transit volume and actual transit volume.
The platform question: what distribution actually costs
Every lever above has the same hidden dependency, and it is the reason most distribution programmes are decided by an infrastructure roadmap rather than by a latency target. Distribution multiplies sites. A function that ran in two national data centres now runs in ten, thirty or two hundred regional ones, and every instance needs lifecycle management, patching, monitoring, capacity planning, security hardening and a support model. The software is trivial. The sites are not. The economics of distributing a network function are set by the marginal cost of a site, not by the cost of the function.
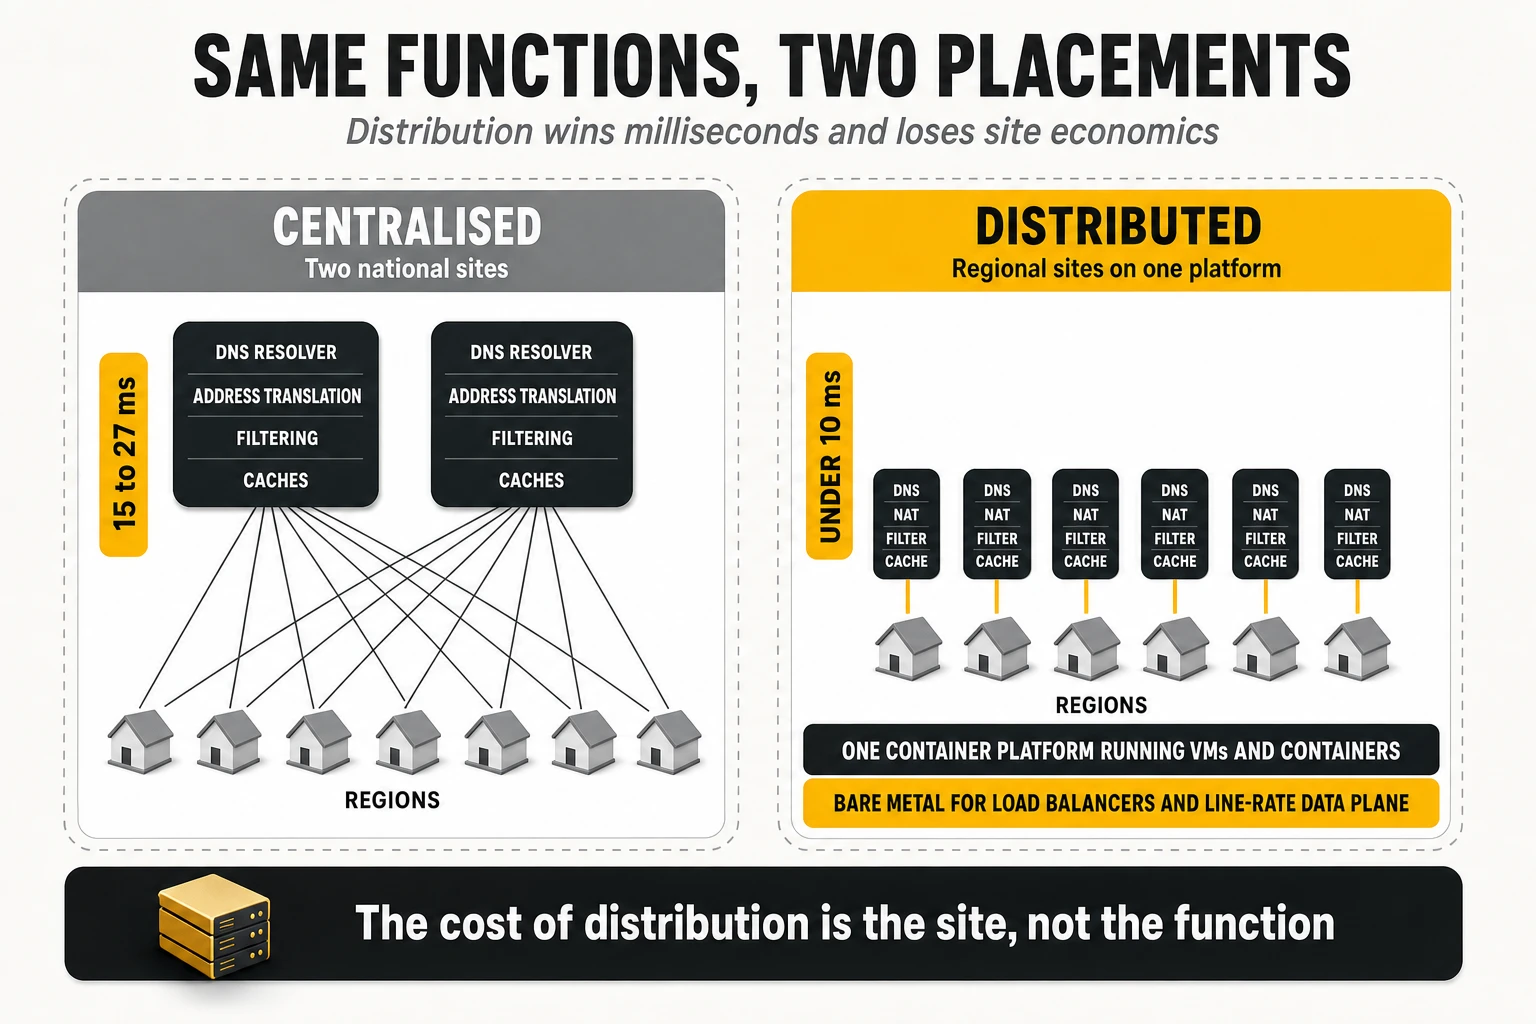
Historically, each of those regional sites would have carried a full infrastructure-as-a-service stack, because network functions were virtual machines and virtual machines needed one. Compute, networking, block storage, image and identity services, a database, a message bus, high-availability tooling and an upgrade path, replicated per site and operated by a team that understands it. For a site running a handful of functions, that is an international airport built to land two light aircraft. It is also the reason so many distribution proposals die in the business case: the platform cost per site, multiplied by the site count, exceeds the value of the milliseconds recovered.
What changed is that Kubernetes platforms can now run virtual machines as first-class managed objects. The open-source project underneath is KubeVirt, productised by the major enterprise distributions, and the practical consequence is that virtual-machine network functions and containerised ones share one control plane, one operating model, one skill set and one upgrade path. An operator that already runs a container platform in its regional sites for other workloads can host the virtual-machine functions there too, instead of standing up a second infrastructure stack purely because a supplier has not containerised its product yet.
One correction matters here, because it is where these programmes are routinely oversold internally. Running a virtual network function on a Kubernetes platform does not make it cloud-native. A hypervisor is still underneath; the function is still a virtual machine with the same scaling behaviour, the same upgrade procedure and the same failure modes it had before. What changes is the management plane, not the virtualisation. Teams that present the migration as containerisation end up promising elasticity, rolling upgrades and horizontal scaling that the function cannot deliver, and the credibility cost lands on the next programme.
The real argument for the converged platform is the marginal cost of the next distributed function, and it is decisive. If a regional site already hosts the operator’s platform for other workloads, adding a resolver, a user plane, a filtering policy engine or a cache controller is a capacity increment and a namespace. If it requires its own infrastructure deployment, the case for thirty sites collapses before it reaches the network team. This is why the honest answer to “should we distribute the recursive DNS” is frequently “not until the platform is there”, and why a broadband quality programme that is not represented in the cloud infrastructure roadmap will lose two years discovering that.
Bare metal remains the right answer for a specific and predictable set of functions. Anything doing per-packet work at line rate – the load balancers in front of a distributed resolver farm, high-throughput forwarding, subscriber-facing user planes at scale – frequently outgrows virtual instances, and the pattern among operators that have completed this work is to move those functions to bare metal rather than to keep scaling virtual machines. The functions that do stay virtual need the unglamorous performance engineering that these deployments have always needed: non-uniform memory access awareness, CPU pinning, huge pages, single-root input/output virtualisation, kernel-bypass data planes and precision timing where the function requires it. None of that is new. All of it is still where distributed deployments fail.
The transition is where the money actually goes, and it is the line most often missing from the business case. Running a legacy virtualisation stack and the target platform in parallel duplicates testing, certification and orchestration for every function in flight, for as long as the migration lasts. That duplication is a real cost with a real headcount behind it, and it produces no customer benefit whatsoever. The sequencing consequence is blunt: migrate the infrastructure to the target platform first, then distribute onto it. Distributing onto a platform that is about to be replaced means doing the work twice and certifying it three times, and it is the most expensive avoidable mistake in this entire article.
There is also a capital framing that makes these programmes far easier to approve than they look. Because distribution reuses a regional footprint the operator was going to build anyway for other workloads, the decision is often not “buy new infrastructure” but “bring the platform forward”. A quality programme that pulls a planned regional cloud build forward by a year is a scheduling argument with a capital consequence, and it competes very differently from a standalone request for distributed resolvers. Operators that have run this successfully present one number – the cost of accelerating the platform – against the combined benefit of every function that then becomes cheap to distribute, rather than asking for each function separately and losing each one on its own merits.
Watch: marginal cost and lead time to place one additional network function in a regional site; number of sites running more than one distinct infrastructure stack; duration of the parallel-run window and its cost per month; and the share of distributed functions running on the target platform rather than on the legacy one.
One distribution plan, not six
The functions listed above move together or they do not move usefully at all, which makes the site list the central artefact of the programme. One list of regional sites, one calendar, one platform, and a stated dependency chain per function. The table below is the minimum version of that plan; the column that decides the sequencing is the third one, because a function whose dependency is not ready will either wait or be deployed twice.
| Function to distribute | Why it has to move | What it depends on | What it moves |
| Recursive DNS resolver | Resolution delay multiplies across every object in a page | Regional platform footprint; anycast addressing; balancer capacity, often bare metal | Browsing, time to first byte, video start, social media tests |
| Content filtering and protection policy | An external filtering platform adds tens of milliseconds per uncached lookup | Resolver distribution; policy engine running on-net | Browsing and latency for the subscribers who opted in |
| Carrier-grade address translation | Traffic tromboning to a national cluster cancels the resolver gain | Address plan; IPv6 coverage; platform or bare metal at the regional site | Idle latency, gaming, loaded latency |
| Broadband gateway user plane | Subscriber traffic should break out in the customer’s own region | Control and user plane separation; regional transport capacity | Latency, backhaul cost, resilience |
| Residential and fixed-wireless user plane function | A converged household should not get two different path lengths | Converged core roadmap; same site list as the fixed user plane | Latency and consistency for converged and fixed-wireless customers |
| Content caches | The first video segment should come from inside the region | DC power, rack space, platform contracts, appliance supply | Streaming, video experience, browsing, transit cost |
| Load balancers in front of distributed farms | Distributed farms need front ends that scale with the site count | Bare-metal platform; line card and optics roadmap; certification | Reliability and availability of every distributed service |
| Measurement probes and on-net test nodes | A distributed network cannot be managed from central probes | Probe fleet; test node hosting; regional site access | Nothing directly – it is how you prove everything else |
What distribution moves, and what it does not
A distribution programme improves real session quality substantially and improves some published benchmark numbers by nothing at all, and confusing the two is how these programmes lose their sponsor in year two. The mapping below states which of the four methodologies each action actually reaches. It is worth reading alongside the metric-to-lever map in section 3, because the two together are the argument a quality programme needs to survive a budget cycle.
| Distribution action | Metrics it moves | Metrics it does not move |
| Distributed recursive resolver | Web browsing and social media test families; time to first byte; video start time | Speed index measured to the nearest node; contracted-speed compliance; upload |
| Filtering policy executed on-net | The same browsing metrics, for the share of the base that opted into the service | Anything measured on a clean profile, which usually includes the auditor’s own probes |
| Address translation and user plane distribution | Idle latency, gaming latency and jitter, loaded latency | Download and upload throughput |
| Interconnection and route policy | Gaming, idle latency, streaming start time, browsing, video experience | Contracted-speed compliance; Wi-Fi metrics; local-node speed tests |
| Regional content caches | Streaming and video experience, browsing, consistency at busy hour, transit cost | Speed index measured against a server inside the operator’s own network |
| The platform programme itself | Nothing directly | Everything – it is an enabler, and it should never be justified as a metric lever |
Two consequences follow, and both are uncomfortable. The first is that a speed index measured against the nearest server inside the operator’s own autonomous system is close to insensitive to everything in this section: a programme can cut real session latency by three quarters and move that number by nothing, which is precisely why an operator should never be judged internally on a single external index. The second is that a methodology sampling over home Wi-Fi will dilute every millisecond gained in the network with a radio the distribution programme never touched. The network work is still correct. It simply needs the gateway programme running alongside it, or the measured result will understate it for years.
One further limit deserves naming, because its addressable share is shrinking. A distributed resolver only serves the queries that reach it. Where a browser or an operating system sends lookups to a public encrypted resolver by default – and default-on encrypted DNS is now normal in mainstream browsers – the operator’s investment in resolution latency is bypassed entirely, and so are its filtering policy, its stub zones and its telemetry. The lever is real and worth pulling; any business case built on it should state what share of the base it still covers, and should assume that share declines. The durable version of the same investment is the part that cannot be bypassed: the caches, the interconnection, the user plane placement and the gateway.
5. World benchmark: who leads, in what, and measured how
There is no single global ranking of fixed broadband operators, and any article that presents one is misreading its sources. Tariff structures, regulatory regimes and infrastructure maturity differ so much between countries that cross-market comparison is only meaningful at the level of a specific metric measured by a specific methodology. What follows is organised that way: by dimension, by source, with the technology and the relative position stated each time.
The country ceiling: what the market allows before the operator competes
Measured against local servers, the fastest fixed markets on earth are concentrated in a handful of dense, fibre-saturated economies. In the March 2026 edition of the Speedtest Global Index, Singapore led global fixed broadband with a median download of 425.46 Mbps, ahead of the United Arab Emirates at 384.51 Mbps and Hong Kong at 352.40 Mbps, with France, Iceland, Chile, Macau, the United States, Switzerland and Denmark completing the top ten. The global figure sat around 120.52 Mbps download and 60.35 Mbps upload. Those are medians of user-initiated tests against nearby servers, so they describe the ceiling a market’s access infrastructure can deliver, not the experience inside its homes.
Measured from a phone on home Wi-Fi, the same continent reorders itself. In Opensignal’s May 2026 European analysis of 18 markets, France led download at 182.5 Mbps and upload at 135.3 Mbps, the United Kingdom ranked sixth at 119 Mbps download and 39.4 Mbps upload, and Germany trailed at 76.8 Mbps and 27.5 Mbps. On consistent quality the order changes again: Denmark led at 85.3%, Norway at 84.3% and Sweden at 81.5%, ahead of France at 79.7% – markets with less fibre coverage beating markets with more, because consistency is decided by the home network and the failure tail rather than by headline capacity. Sweden, Norway and the United Kingdom all cleared the 650-point band on reliability.
nPerf 2026: the operators that win a balanced composite
The most useful cross-country operator comparison published anywhere is nPerf’s world barometer, because it applies one scoring function to operators in dozens of markets. The 2026 edition covers April 2025 to March 2026 and splits countries by geographical size. Among 35 mid-size countries, Bouygues Telecom took the overall title with 163,038 nPoints, and the podium behind it is dominated by markets with mature FTTH and aggressive interconnection strategies.
| Dimension | Leaders (mid-size countries, 2026) | Reading |
| Overall nPoints | Bouygues Telecom (FR) 163,038; Orange (FR) 157,320; Free (FR) 156,243; Bahnhof (SE) 155,439; Mundo (CL) 151,365 | Balance beats raw speed under a logarithmic composite |
| Download | Mundo (CL) 564.19 Mb/s; Bouygues (FR) 515.51; Free (FR) 462.07; Orange (FR) 437.02; Iliad (IT) 403.25 | Multi-gigabit FTTH tariffs; Mundo also took the global fastest-network title |
| Upload | Mundo (CL) 451.60 Mb/s; Bouygues (FR) 388.37; Bahnhof (SE) 356.55; Free (FR) 335.84; Orange (FR) 332.60 | Symmetric PON is the only route to these figures |
| Latency | Sognenett (NO) 7.82 ms; Enivest (NO) 8.30; AIS (TH) 11.81; Bouygues (FR) 12.38 | Small, dense, well-peered networks beat large ones |
| Browsing | Bouygues (FR) 86.65%; Orange (FR) 86.21%; Sognenett (NO) 85.97%; Free (FR) 85.61% | DNS and TTFB, not bandwidth |
| Streaming | Bahnhof (SE) 91.40%; Virgin Media (GB) 89.67%; Fibrus (GB) 88.65%; Bouygues (FR) 88.40% | Cache and peering placement decides this column |
Two observations from that table are worth more than the rankings themselves. First, the operator with the fastest line in the world does not win the overall title: Mundo leads both download and upload by a wide margin and finishes fifth on nPoints, because a logarithmic composite refuses to pay for capacity the user cannot perceive. Second, the latency leaders are small regional fibre operators in Norway at under 8.5 ms, roughly half the figure of the large national players – a reminder that network diameter and peering proximity beat scale on this specific metric.
The same effect repeats inside individual national barometers, which is where it becomes commercially awkward. In one 2026 national edition, the operator with the best average download in the market (350.85 Mb/s) and the best average upload (291.22 Mb/s) finished fourth on the overall composite. The winner’s download was roughly 17% lower, but it led the market on latency at 20.26 ms and took both the browsing and the streaming columns. An operator can hold every speed record in its country and still be ranked fourth by a methodology that asks how the connection feels rather than how much it carries.
In the large-country barometer the absolute numbers fall sharply, and the competitive structure changes. Across Brazil, India, Argentina, Kazakhstan, Algeria, the Democratic Republic of the Congo, Saudi Arabia, Mexico, Indonesia and the United States, Totalplay in Mexico (118,061 nPoints) and Vivo in Brazil (118,006) shared the overall title, ahead of Megacable in Mexico (112,972) and Oi in Brazil (105,492). Download leadership went to Claro Brazil at 242.55 Mb/s, followed by Vivo at 236.63 and Oi at 225.42; on upload, Totalplay reached 167.04 Mb/s and Vivo 155.96, both within reach of the category leader at 178.25 Mb/s. On the FTTH-only cut, Totalplay (139,640) and Megacable (138,953) led, with Vivo third at 136,657 – a Mexican-Brazilian duopoly at the top of every list in that barometer.
The Wi-Fi tax, quantified from published data
Because nPerf publishes an FTTH index and a Wi-Fi index for the same operators in the same scoring system, the cost of the home network can be computed directly. The table below compares each operator’s FTTH nPoints with its Wi-Fi nPoints in the 2026 large-country barometer. The gap is the share of the delivered network that the customer never experiences.
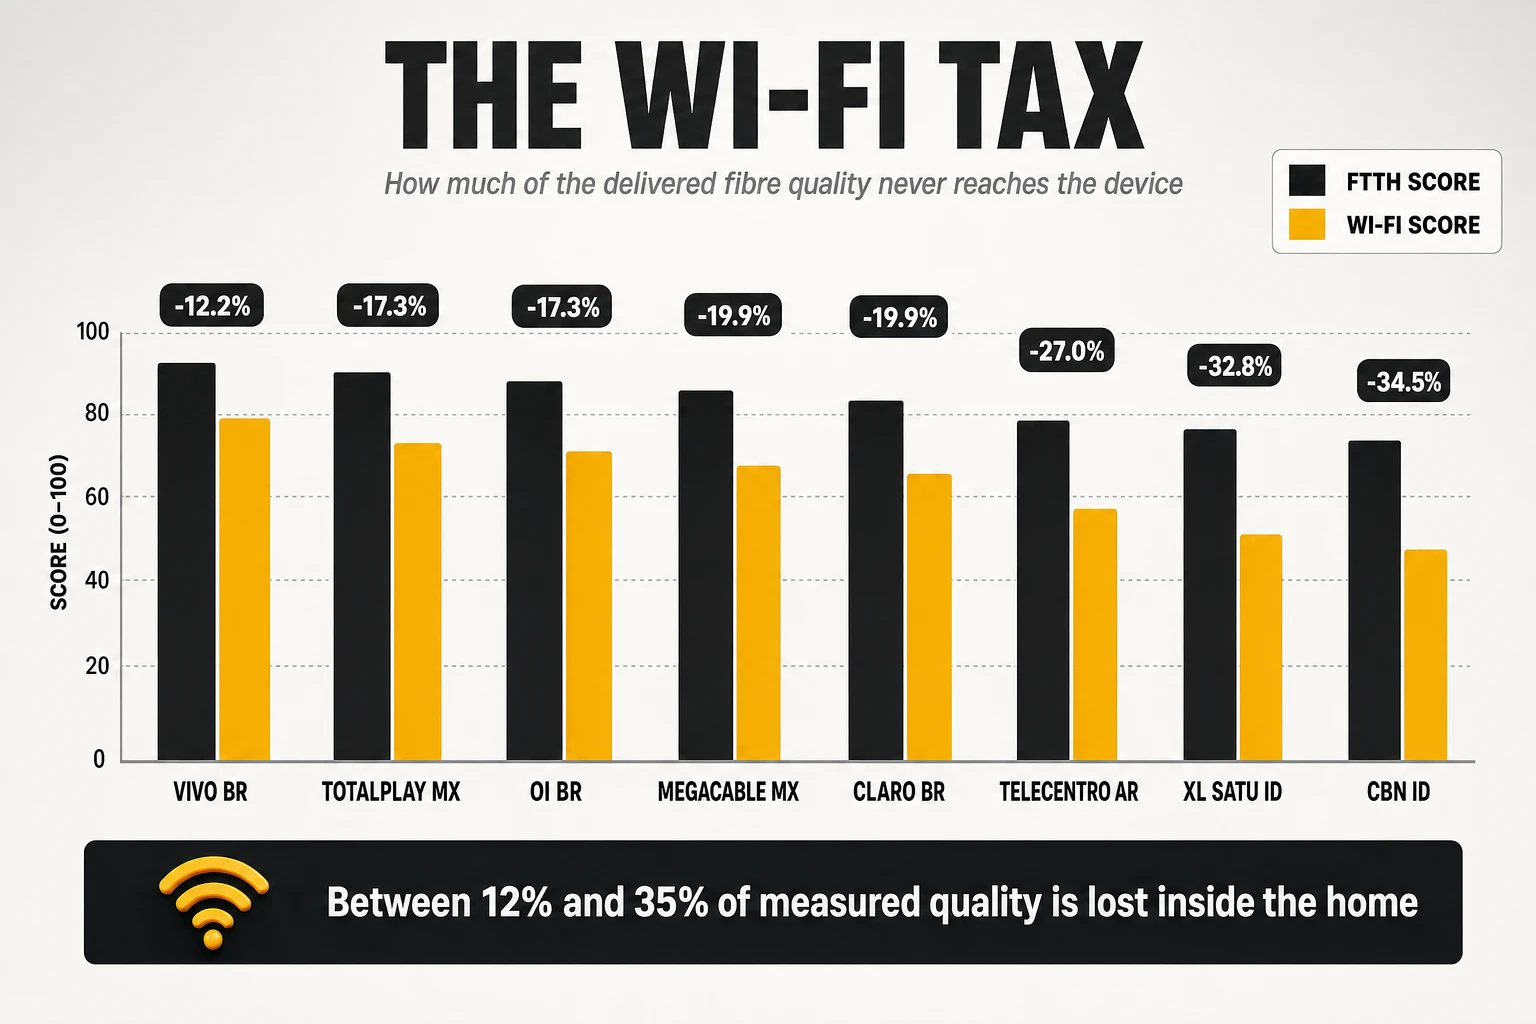
| Operator (country) | FTTH nPoints | Wi-Fi nPoints | Gap |
| Vivo (BR) | 136,657 | 119,938 | -12.2% |
| Totalplay (MX) | 139,640 | 115,481 | -17.3% |
| Oi (BR) | 125,651 | 103,925 | -17.3% |
| Alma+ (KZ) | 125,867 | 104,015 | -17.4% |
| Megacable (MX) | 138,953 | 111,289 | -19.9% |
| Claro (BR) | 129,741 | 103,954 | -19.9% |
| TeleCentro (AR) | 136,539 | 99,721 | -27.0% |
| Telmex (MX) | 127,440 | 89,550 | -29.7% |
| XL SATU (ID) | 133,932 | 90,045 | -32.8% |
| CBN (ID) | 134,793 | 88,336 | -34.5% |
The spread is the point: between 12% and 35% of measured quality disappears between the fibre and the device, and the difference between the best and worst performers on that gap is almost a factor of three. Two operators with near-identical FTTH scores – one at 136,657 and one at 134,793 – end up 31,600 nPoints apart on Wi-Fi. That difference was not built in the access network. It was built in the gateway, the radio plan and the installation process, and it is entirely within the operator’s control.
The penalty is not confined to emerging fibre markets. In one 2026 European national barometer, the operator with the best FTTH result in its market scored 162,727 points on the fibre cut and 133,791 on the Wi-Fi cut – a 17.8% gap on the strongest fibre network in the country. The home network does not care how good the access line is, and it applies its tax uniformly.
Opensignal: who wins the in-home experience
The United States dataset for the first quarter of 2026 is the clearest published illustration of technology trade-offs. Across hybrid fibre-coax, fibre to the premises, DSL and fixed wireless, the cable operators took download, consistent quality and video, while the fibre operator took upload by a factor of two and a half and the second cable operator took reliability.
| Operator | Download | Upload | Consistent quality | Reliability |
| Comcast (HFC) | 228.6 Mbit/s | 46.9 Mbit/s | 83.7% | 748 |
| Charter (HFC) | 220.4 Mbit/s | 26.8 Mbit/s | 81.7% | 761 |
| AT&T (FTTP + DSL) | 201.4 Mbit/s | 120.0 Mbit/s | 79.7% | 675 |
| Verizon (FTTP + FWA) | 174.1 Mbit/s | 58.0 Mbit/s | 83.3% | 684 |
| T-Mobile (FWA) | 148.5 Mbit/s | 26.4 Mbit/s | 78.8% | 656 |
Three findings in that table deserve attention. The fibre network with by far the best upload does not win reliability or consistent quality, because those metrics are decided in the home and in the failure tail rather than at the access layer. Video experience is compressed into a 1.6-point band across five operators on three different access technologies, which tells you the metric has saturated in this market and no longer discriminates. And the fixed wireless operator, carrying a growing subscriber load, improved its reliability by 58 points year on year – the opposite of what capacity-based intuition predicts.
- Denmark (June 2026): Fibia won download and upload nationally with 175 Mbps and 122 Mbps, reaching 211.0 Mbps in North Jutland, and shared the consistent quality award with TDC at 85.9% and 85.8% – a statistical tie correctly declared rather than a one-tenth-of-a-point victory.
- Canada (June 2026): Bell took consistent quality at 88.2%, the highest published figure in any market cited here, on a national FTTP footprint.
- South Africa (Q1 2026): Vox swept all five categories against five competitors – 24.9 Mbit/s download, 17.5 Mbit/s upload, first in consistent quality, 66.1 points on video and 363 on reliability. The absolute numbers are an order of magnitude below European ones, which is exactly why reliability scores must never be compared across markets: 363 is a market-leading result in that context.
MedUX: who wins when Wi-Fi is removed from the equation
The cabled-probe view produces the highest absolute quality figures of any methodology, because it measures the network the operator actually built. In the United Kingdom campaign, BT took the overall quality of experience title with 4.59 out of 5, on more than 900,000 tests, with 99.88% service reliability, a 99.92% success rate on web browsing, 99.99% on streaming and 99.78% on gaming at 24.67 ms of in-session latency. Second place was close enough on responsiveness and streaming – under half a percentage point – to be treated as shared leadership.
In Italy, the same methodology produced a different kind of winner. Fastweb took both the overall quality of experience award and the reliability award on a campaign of more than 5 million tests across 16 regions, with the market as a whole scoring below the European average – an illustration of how a controlled panel separates operator performance from national infrastructure maturity. Both results share a pattern worth naming: under a scoring model where 55% of each service score is a reliability gate, the winners are operators whose sessions essentially never fail, not operators with the highest peak speeds.
A 2025 campaign in a different market provides the reference points for the top of this scale. The winner scored 4.8 out of 5 on its FTTH footprint with a 99.4% streaming success rate, and the two leading operators both delivered above 93% of advertised download speed on packages between 600 Mbps and 1 Gbps. Those are the numbers worth calibrating against: on a cabled measurement, world-class means reliability above 99.5% in every service category and delivered speed within single-digit percentage points of the tariff.
Ookla: capacity, consistency and the awards that follow
- Hong Kong – Netvigator: six awards in the first half of 2026, including fastest and best fixed network in East Asia, and the market’s most consistent fixed network for the first time, the latter measured as the share of users reaching at least 25 Mbps download and 3 Mbps upload. A dense, fully fibred market where regional leadership and national consistency were won simultaneously.
- Chile – Mundo: named the world’s fastest fixed network by Ookla for full-year 2025, and the fastest fixed internet in the world in nPerf’s 2026 barometer at 564.19 Mb/s download and 451.60 Mb/s upload. Two methodologies with opposite biases agreeing on the same operator is a strong signal about the underlying symmetric fibre plant.
- Belgium – Proximus: fastest fixed network for a second consecutive year and, new in 2025, most stable network, on more than five million fixed tests; nPerf’s Belgian barometer put it first with 130,251 nPoints from over 400,000 tests, on an FTTH footprint of nearly 2.5 million premises and 41% population coverage. The operator attributes the result to fibre rollout plus Wi-Fi performance on its own gateways.
- Philippines – Converge: fastest fixed provider for the first half of 2026 with a Speed Score of 61.86, ahead of 60.84 and 58.48 for its two closest competitors – a reminder that in a developing fibre market, a two-point Speed Score gap is the entire competitive distance.
- Australia – Superloop: fastest fixed network on a wholesale access network, with 768.77 Mbps average download on its highest tiers. In a structurally separated market, the retail operator’s differentiation is provisioning, backhaul dimensioning and CPE, because the access line is identical for everyone.
Reading the benchmark as a whole
- Raw capacity: symmetric multi-gigabit fibre operators in Chile, France and Mexico, with download figures between 400 and 565 Mb/s and upload figures between 330 and 450 Mb/s in nPerf’s crowdsourced measurement.
- Upload as a differentiator: the US fibre operator at 120.0 Mbit/s over Wi-Fi against 26.8 for the nearest cable competitor; and Chile’s leader at 451.60 Mb/s in a wired-and-wireless mix.
- Latency: Norwegian regional fibre operators under 8.5 ms, roughly 40% better than the best large national operators in the same barometer.
- Consistency and reliability: Canada at 88.2%, Denmark at 85.9%, the Nordic markets and the UK above 650 reliability points, US cable at 748 to 761.
- In-home Wi-Fi: Brazil’s Vivo, with both the top Wi-Fi index in the large-country barometer and the smallest FTTH-to-Wi-Fi gap at 12.2%.
- Overall balanced quality: Bouygues Telecom in mid-size countries and the Totalplay-Vivo pair in large ones, none of which leads on raw speed – which is the whole argument of this article in one line.
6. What the operators at the top of these tables actually do
The operators that appear repeatedly across methodologies with opposite biases are not winning by optimising for one of them. An operator that tops a cabled-probe scorecard and a smartphone-on-Wi-Fi ranking and a local-server speed index has, by construction, built three different things well. The practices below are what the published cases have in common, and each is stated as a capability rather than as a project.
Symmetric fibre architecture, and dimensioning treated as a quality control
Every operator at the top of the speed and upload tables runs symmetric fibre to the premises, and the ones with the largest margins run it at 10 Gbps. The Chilean operator that holds both the Ookla world fastest-network title for 2025 and the nPerf world download and upload titles for 2026 does so on a symmetric plant; the US fibre operator’s 120.0 Mbit/s upload against 26.8 for cable is the same architectural fact expressed in a different market. Upload is where the architecture becomes visible, because there is no configuration that compensates for an asymmetric medium.
The less visible half of this is dimensioning discipline. A PON tree is a shared medium, and split ratio is a commercial decision with a quality consequence. Leading operators treat busy-hour utilisation per tree as a hard engineering ceiling with automatic capacity triggers, rather than as a metric reviewed when complaints spike. The practical test of whether an operator does this is simple: ask what percentage of its PON trees exceeded a defined utilisation threshold last month, and whether that number produced work orders without human escalation.
Interconnection treated as a product decision, not a cost line
The clearest attributable link in the entire public record between an engineering decision and a benchmark result is an interconnection decision. The South African operator that swept all five Opensignal categories in the first quarter of 2026 explicitly credits its accreditation as a Google peering provider – obtained in February 2026 – for its video experience ranking, alongside ownership of both the fibre infrastructure and the retail ISP. That is a specific, dated commercial action followed by a specific measured outcome in a third-party benchmark.
- Direct interconnects with the platforms that generate the traffic: the destinations that dominate every benchmark are a short and well-known list. Private interconnection with them removes transit hops, transit congestion and transit cost simultaneously.
- Presence at the main exchange points of the region, not only the national one, because the content a customer consumes is frequently served from a neighbouring market.
- Explicit paths to gaming platforms, which are measured directly by two of the four methodologies and are almost never part of a default peering strategy.
- Ownership of the full path where regulation allows it: the vertically integrated cases in these benchmarks consistently cite end-to-end control – infrastructure and service under one operator – as the reason they can optimise at all.
Content caches inside the network, close to the customer
Streaming and browsing scores are geography problems disguised as network problems. Hosting the caching appliances of the major video platforms inside regional points of presence changes the physics of the measurement: the first video segment comes from inside the operator’s own network rather than from across a transit path, which removes the two things streaming models punish hardest – startup delay and peak-hour stalls.
The measurable consequence is a change in the shape of the distribution, not just the mean. Cached content produces consistent delivery at busy hour, and consistency is what adaptive bitrate players convert into sustained high resolution. This is why operators with strong cache footprints tend to win streaming metrics even when they do not lead on raw throughput, and why the streaming column of the nPerf world barometer is topped by a Swedish operator rather than by the multi-gigabit leaders.
A distributed function footprint, and a platform that makes it affordable
The operators that hold leading positions across methodologies with opposite biases have one structural thing in common that rarely appears in their marketing: their network functions are not all in two buildings. Recursive resolvers, address translation, subscriber user planes, filtering policy and content caches sit in a regional layer close to the customer, and the site list for all of them is the same. That is the architectural difference behind a large share of the latency gap between a leader and a competent follower, and it is invisible in any published speed figure.
- One platform for virtual and containerised functions: the leaders do not stand up a separate infrastructure stack per site for the network functions that have not been containerised yet. A single container platform capable of running virtual machines as managed objects keeps the marginal cost of the next distributed function close to zero, which is the condition that makes a thirty-site plan viable at all.
- Bare metal reserved for the functions that earn it: load balancers in front of distributed farms and per-packet data-plane functions at line rate are moved off virtual instances rather than scaled on them. Deciding this early avoids the mid-programme capacity wall that has delayed several national distribution rollouts.
- Quality represented in the cloud roadmap: the quality programme has a named seat in the infrastructure planning cycle, because the thing that determines when the resolver can be distributed is when the platform reaches the site. Operators where these two roadmaps are owned by departments that meet quarterly discover the dependency after they have committed to a date.
- Migration sequenced before distribution: the infrastructure is moved to the target platform first and the functions are distributed onto it afterwards. The alternative – distributing onto a stack scheduled for replacement – duplicates testing, certification and orchestration for every function in flight, and it is the most expensive avoidable error in this kind of programme.
The gateway treated as a strategic asset rather than a unit cost
The router is the only piece of operator equipment the customer looks at, and it determines the result of two of the four benchmarks. The Belgian operator that holds both the fastest and the most stable fixed network awards in its market explicitly attributes part of that to Wi-Fi performance on its own gateways, not only to fibre rollout. The 12% to 35% spread in the FTTH-to-Wi-Fi gap computed earlier is, in large part, a gateway fleet difference.
- Generational refresh as a continuous programme: the leaders replace Wi-Fi 5 equipment on a rolling schedule rather than waiting for churn or breakdown, because every month a legacy gateway stays in the field is a month of depressed measurements from that household.
- 6 GHz and multi-link operation: the newest generations matter less for their headline rate than for their access to a clean band and their ability to hold a stable link, which is what consistency and reliability metrics reward.
- Hardware acceleration enabled by default: offloading routing and address translation to the chipset removes the internal jitter that consumes the 12 ms consistency budget before the packet leaves the house.
- Firmware discipline: a single bad firmware release across a large fleet can move a national metric. Staged rollout with automated regression on measured quality indicators is standard practice among the leaders and absent among the laggards.
Mesh and automatic optimisation of the home network
Coverage inside the home is now an engineering deliverable, not a customer responsibility. Surveys consistently find around a third of households reporting Wi-Fi problems, frequently affecting several rooms, on lines whose access performance is not in question. The operators that have moved their in-home numbers treat this as a design problem: measured coverage at installation, mesh nodes provisioned on evidence rather than on complaint, and automatic steering and channel selection running continuously rather than at setup.
The complexity argument is now on the side of automation. Multi-band, multi-link home networks with dozens of connected devices cannot be tuned manually at fleet scale, and the industry consensus for 2026 is that always-on telemetry with automated anomaly detection and closed-loop tuning becomes the only viable operating model for Wi-Fi. An operator that cannot change a channel plan across a city overnight is not operating its home networks; it is hoping.
Telemetry from the CPE, standardised and always on
Everything proactive depends on data the operator does not have unless it deliberately collects it. The migration from legacy remote management to the user services platform framework (TR-369/USP) is what turns the gateway from a device that can be rebooted into a sensor that reports continuously: per-radio channel utilisation, per-device signal strength and retransmission rates, per-interface throughput, error counters and firmware state. That data stream is the precondition for anomaly detection, for proactive care and for any meaningful segmentation of a quality problem between line, gateway and radio.
The operating consequence is a different support model. With continuous in-home telemetry, the question at the contact centre changes from “have you tried restarting the router” to “your 5 GHz radio has been at 90% airtime every evening for eleven days and there are four neighbouring networks on your channel”. Operators without that visibility describe the home network as a blind spot, and it is precisely the segment two of the four benchmarks measure.
Proactive degradation management and preventive replacement
Reliability metrics are won against the failure tail, which means the operating model has to find degradation before it becomes an incident. The pattern among leaders is consistent: continuous scoring of every subscriber line, automatic identification of lines drifting towards a threshold, and intervention scheduled before the customer notices. Optical modules with rising error counts, gateways with thermal or memory signatures, drops with deteriorating optical budgets and power supplies near end of life are replaced on evidence rather than on failure.
This is also the cheapest reliability programme available. A small share of lines generates a disproportionate share of failed sessions in any network, and those lines are identifiable from telemetry months before they generate a complaint. The economics are straightforward: a preventive gateway swap costs a fraction of a truck roll plus a churn event, and it moves a metric whose improvement cannot be bought any other way.
Remote diagnosis, automation and applied AI in operations
The decisive capability is segmentation: knowing, without visiting, whether a problem is in the line, the gateway or the radio. Misattribution is expensive in both directions – a dispatched technician who finds a healthy line, or a firmware investigation for a fault that was a failing drop cable. Operators with end-to-end telemetry resolve that question in the operations centre, which compresses both mean time to repair and field cost.
- Automated detection of patterns no human is monitoring: a firmware version that raises jitter by two milliseconds across a fleet, a PON tree whose evening utilisation has been climbing for three weeks, a city block where a new deployment collapsed the channel plan.
- Closed-loop remediation where the action is safe and reversible: channel changes, band steering thresholds, queue parameters and cache redirection can be automated; capacity works and hardware replacement remain human decisions with machine-generated evidence.
- Synthetic monitoring that mirrors the external benchmarks: the leaders run their own probes executing equivalent test families against equivalent endpoints, continuously. The purpose is not to game the benchmark – it is to ensure that the published result contains no information the operator did not already have.
- Model discipline: anomaly detection generates alerts, and alerts without a defined owner and a defined action become noise. The organisational half of this capability is more often the failure point than the analytical half.
The organisational pattern: one owner for experience, across three segments
The recurring organisational failure is that the three segments the benchmarks measure are owned by three different departments with three different incentives. Access engineering owns the line, IP engineering owns peering and caching, and the devices team owns the gateway – and none of them owns the customer’s experience, which is the product of all three. When a benchmark result arrives, each department can demonstrate that its own metrics are healthy.
- A single accountable owner for measured experience, with the authority to commission work across access, IP and devices, and with the external benchmark results as an explicit objective alongside internal KPIs.
- A published internal quality model that mirrors how the external methodologies aggregate, so that engineering trade-offs are made in the same currency the market will use to judge them.
- Vertical integration where it is available: the cases that sweep categories tend to control both the infrastructure and the retail service, which removes the interface where quality problems become someone else’s responsibility.
- Benchmark literacy in the commercial organisation: marketing teams that understand why the operator won consistency and lost speed will build campaigns that survive contact with the next report. Teams that do not will demand engineering work that moves nothing.
7. The twelve practices that separate the leaders
For an operator that wants to sit among the world leaders in fixed broadband and Wi-Fi quality, these are the twelve capabilities the published evidence supports, in the order in which they should be built.
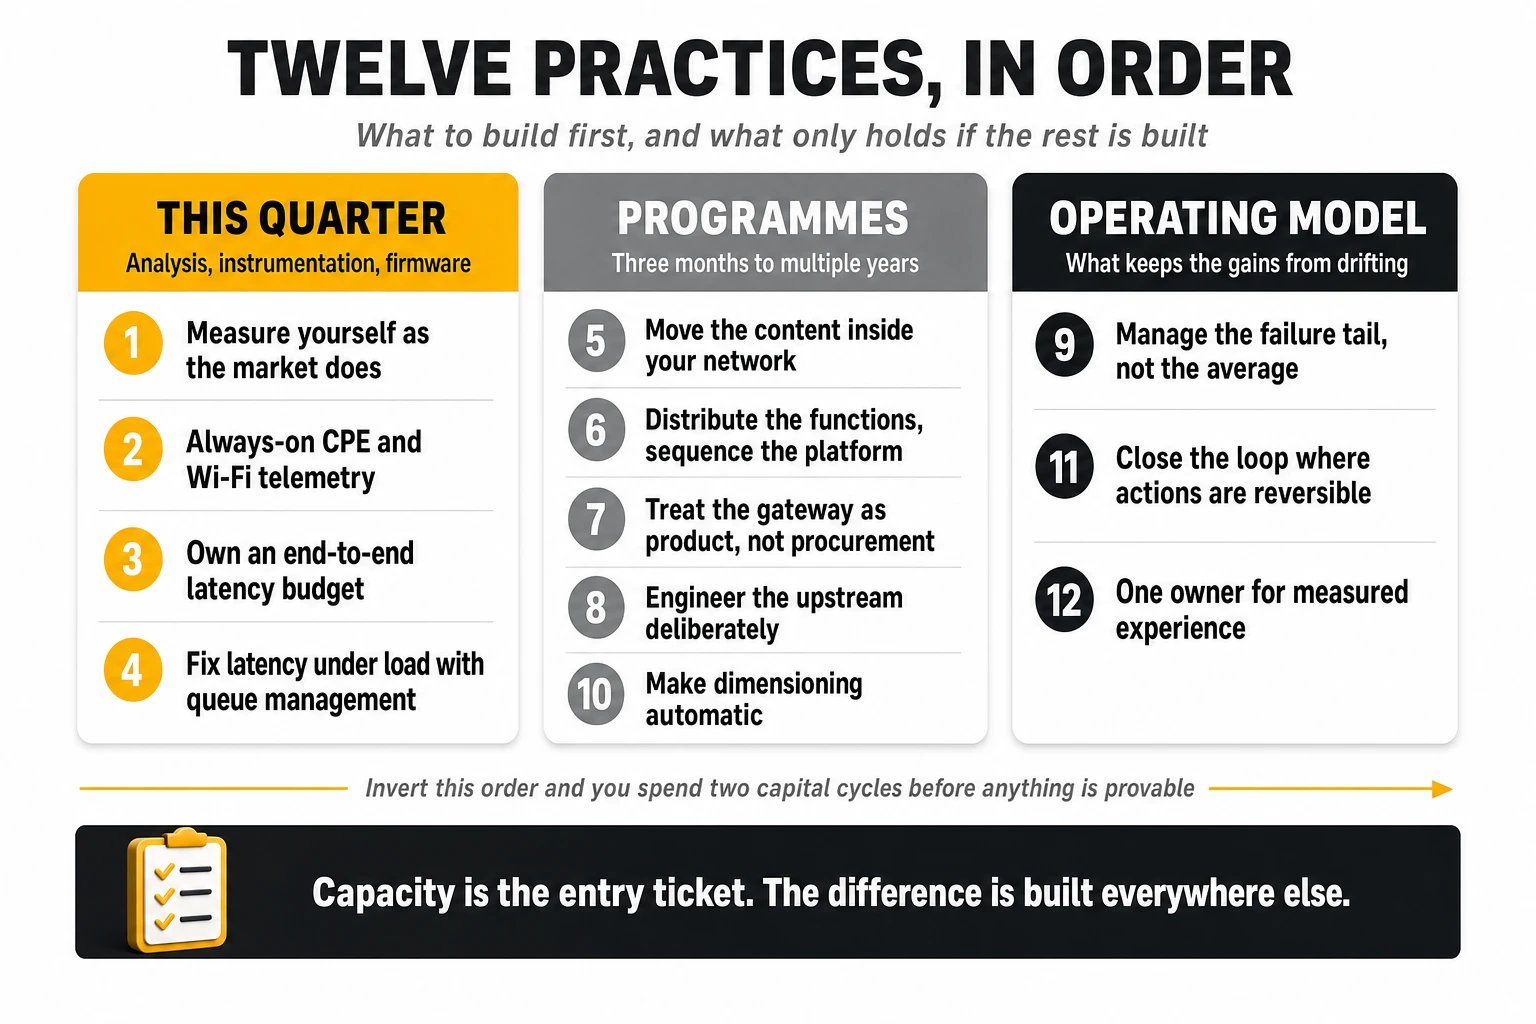
- Measure yourself the way the market measures you, before it does. Run a permanent synthetic probe fleet reproducing the four test families – cabled and over Wi-Fi, against local nodes and against commercial CDNs, at busy hour and off-peak. No published report should ever contain new information.
- Instrument the home with standardised, always-on CPE and Wi-Fi telemetry. Without per-radio, per-device data, two of the four benchmarks are unmanageable and the support model stays reactive.
- Own an end-to-end latency budget, not a capacity plan. Decompose one ordinary session into its delay components – gateway resolution, recursive resolver, inserted filtering or security services, authoritative lookup, path to content – with a millisecond figure and a named owner against each line. It takes a quarter, costs nothing, and it is the artefact that stops a capital programme being aimed at the wrong segment.
- Fix latency under load before buying more capacity. Modern active queue management on the gateway WAN and access line cards, and L4S with explicit congestion notification where the access technology supports it. Field trials report working-latency reductions of around 75%, and it is a firmware and configuration programme rather than a capital one.
- Move the content inside your network. On-net caches for the major video platforms plus direct interconnection with the platforms and game networks that the benchmarks explicitly target. This is the highest-leverage action for streaming, browsing, gaming and idle latency simultaneously.
- Distribute the functions that decide session latency, and sequence the platform that carries them. Recursive resolvers, carrier address translation, subscriber user planes, filtering policy and caches belong in the regional layer on one site list and one calendar. Migrate the infrastructure to the target platform first and distribute onto it afterwards; the parallel run is the expensive part, and distributing onto a stack you are about to replace means doing the work twice.
- Treat the gateway as product, not procurement. Continuous generational refresh towards 6 GHz-capable equipment, hardware acceleration enabled by default, staged firmware rollout with automated quality regression, and installation standards that govern where the device is physically placed.
- Engineer the upstream deliberately. Symmetric PON where possible, upstream scheduling reviewed as a parameter rather than accepted as a default, and the 10th percentile of upload managed as the binding constraint for video calls and cloud backup.
- Manage the failure tail, not the average. Reliability and consistency metrics are won by eliminating the small population of lines and homes that generate most failures, identified from telemetry and remediated preventively.
- Make dimensioning automatic. Busy-hour utilisation ceilings per PON tree, per uplink and per interconnect that generate capacity work orders without human escalation, so that congestion never survives long enough to appear in a barometer.
- Close the loop with automation where the action is reversible. Channel plans, steering thresholds, queue parameters and cache policies are machine-operable; anomaly detection without an owner and a defined action is an expensive alert feed.
- Give measured experience a single owner with cross-segment authority. Access, IP and devices must answer to one accountability for the customer’s experience, using the same aggregation logic the external methodologies use.
The sequencing matters as much as the list. Items 1, 2, 3 and 4 are measurable within a quarter and require instrumentation, analysis, firmware and configuration rather than construction. Items 5, 7, 8 and 10 are three to twelve-month programmes with clear unit economics. Item 6 is the outlier and the one most often mis-planned: its duration is set by the infrastructure platform roadmap rather than by the network team, which is why it has to enter the cloud planning cycle a year before anyone expects a latency number from it. Items 9, 11 and 12 are operating-model changes that determine whether the rest holds its value once the programme team disbands. Operators that invert this order – starting with access construction and finishing with instrumentation – typically spend two capital cycles before they can prove anything moved.
8. The bottom line
The four methodologies are not competing descriptions of the same reality; they are four instruments pointed at different segments of the same path. A cabled probe certifies what the operator delivers to the router and audits the commercial promise. A smartphone on home Wi-Fi measures what the household actually receives, radio included. A user-initiated test against a local node measures the ceiling of the access line and how it behaves when full. A functional test scored logarithmically measures whether everyday sessions feel fast. An operator that reads all four and treats the differences between them as diagnostic information has a complete map of its own network. An operator that argues about which one is right has none.
The evidence from the 2026 reports converges on one uncomfortable conclusion for infrastructure-first strategies: the operator with the fastest line in the world did not win the composite it competed in, the fibre operator with two and a half times the upload of its rivals did not win reliability or consistency, and the difference between the best and worst in-home performance was almost a factor of three among operators with near-identical fibre scores. Capacity has become the entry ticket. The differentiation now sits in the interconnection edge, the queueing behaviour, the gateway and the operating model that keeps all three from drifting between one report and the next.
The structural consequence is where the next cycle of investment should go. A gigabit access line is now a commodity input in most competitive markets, and the measurable difference between operators has moved into three places that no access programme reaches: the distance between the customer and the functions that decide session latency, the interconnection and routing choices that determine how far the content actually is, and the radio in the customer’s home. The first two are placement problems, and placement is constrained by what an operator can afford to operate per site – which makes the infrastructure platform roadmap a quality decision, whether or not anyone in the quality programme is invited to that meeting. The third is a device programme. None of the three is a capacity project, and all three take longer to deliver than the reporting cycle that will judge them.
At TelcoCrux, we analyse how network quality is measured, ranked and monetised, so that operators can tell the difference between engineering that moves a benchmark and engineering that only moves a budget. If you are building a broadband and Wi-Fi quality programme – the instrumentation, the metric-to-lever map or the operating model behind it – and want a pragmatic second opinion, let’s talk.